Report Published October 28, 2015 · Updated October 28, 2015 · 96 minute read
Ready for the New Economy
Jonathan Cowan, Jim Kessler, Gabe Horwitz, & Joon Suh

“You press the button, we do the rest.”
That slogan could have come from Apple in 2015—but it’s from Kodak in 1888, the year its name was trademarked.1 For more than a century, Kodak was one of the most advanced technology companies in the world. In 1922 alone, Kodak produced 147,000 miles of motion picture film.2 In 1975, it built one of the first digital cameras.3 In 1976, it accounted for 90% of film and 85% of camera sales in America.4 In 1988, it employed 145,000 people.5 In 1997, the company was worth $30 billion.6 But by 2013, Kodak employed practically no one, was worth virtually nothing, and had been all but replaced by iPhones and apps from Instagram to Snapchat.
This radical dynamism is the defining feature of the nascent global digital age, placing the United States merely at the beginning of a long period of profound economic change. Thus, the political party that speaks honestly and persuasively about these new realities—and offers an agenda that harnesses these trends to benefit all Americans—will have the best shot at restoring shared prosperity and therefore winning political majorities.
In Section 1 of this paper, we argue that the challenge facing the middle class is less about fundamental economic unfairness—but fundamental change due to globalization and technology coupled with a country, a workforce, and a set of institutions that are simply not ready for this new economy. Moreover, we show that the narrative of fairness has demonstrably failed to excite voters, with three consecutive losing performances with the middle class—leaving Democrats with the fewest number of officeholders since 1928. In Section 2, we propose an ambitious and actionable Democratic agenda that would generate economic growth that directly benefits the middle class through over 70 policy ideas that create more skills, more jobs, and more savings.
Section 1: The Argument
Between 1950 and 2000, the U.S. economy grew at an average annual rate of 3.7%.7 It was a growth rate strong enough to build and sustain the world’s largest middle class. By 2000, median household income in America stood at $57,730 in 2014 dollars—an all-time high.8 But starting in 2001, U.S. economic growth shrank to an average annual rate of 1.9%. In only two of the last 14 years has growth exceeded 3% and not once since 2005. This is the longest period of prolonged slow growth in at least a century. By 2014, median household income stood at $53,900—a 5.9% decline from the peak.9
Slow growth and sinking middle class wages have led to a vigorous economic discussion in Washington—one that had been put on hold for the first decade of the 2000s. After the boom of the 1990s, political leadership was consumed by the twin crises of Islamic terrorism and a near-economic collapse. In addition, arguments over the Affordable Care Act (ACA) occupied both parties. This makes 2016 the first presidential race since the new millennium in which a vision for a 21st century U.S. economy can be fully debated absent either an existential crisis or the drive to complete the 20th century task of stitching together basic safety net and worker protections.
In this lively and essential intraparty conversation, there is broad recognition among Democrats that this new vision must center on restoring prosperity to the nation and its middle class. This year, Rep. Ron Kind (D-WI) and the moderate House New Democrats proposed an “American Prosperity Agenda.” The more liberal Senator Elizabeth Warren (D-MA) and Representative Elijah Cummings (D-MD) offered a “Middle Class Prosperity Project.” Presidential candidate Hillary Clinton speaks often of “lasting prosperity.” And fellow candidate Senator Bernie Sanders (I-VT) calls for “health, prosperity, security and joy.”10
Thus, the two wings of the Democratic Party are united in the goal: prosperity for everyday people. But where Democrats differ internally is over the cause of our current economic woes. And as Democrats differ in cause, so too do they differ on solutions.
On the left, the culprit is a fundamentally unfair economic system that stacks the deck in favor of the wealthy and powerful. The slogan “the 1%” often sums up the left’s indictment of the U.S. economic system, and their main goal is to divide up the pie much more evenly. In 2010, the top 1% of earners accumulated 13% of national income after taxes, employer benefits, and government transfers were factored in. This is a slight decline from 2000, but it is nearly double the share of income the top 1% claimed in 1979.11 Persistent income and wealth disparities have sparked a national debate on the topic with President Obama declaring in December 2013 that income inequality is the “defining challenge of our time.”12 It has also garnered widespread public interest—a Google search of “the 1%” yields 303 million entries.13
This viewpoint certainly has merit. Income inequality can be measured in many different ways, but the disparity exists in all of them.14 There are also inequalities in our political system, including donors on both the left and right who contribute sums of money so vast that it would be naïve to believe that along with it doesn’t come outsized influence. And some corporations have arguably done more for shareholders than for employees.
However, while the fortunes of the middle class and the U.S. economy have changed drastically since 2000, income distribution in America has not. The top 5% of household earners captured 22.1% of aggregate income in 2000 and 21.9% in 2014, according to the Census Bureau. The middle three quintiles took in 46.7% of aggregate income in 2000 and 45.7% in 2014.15 Insofar as there have been recent fluctuations in income inequality, disparity actually declined between 2007 and 2013, as economist Stephen Rose documents using Congressional Budget Office (CBO) data that takes taxes and government transfers into account.16
Income disparity also doesn’t necessarily correlate with stagnating middle class wages. From 1970 to 2000, when income inequality in America widened, middle class incomes still jumped 22.8% in real dollars.17 From 1980 to 2010, income gains (after taxes and government transfers are included) favored the wealthy but were still spread across all income brackets: a 53% increase for the bottom quintile; a 41% increase for the next two; a 49% increase for the 4th; and a 90% increase for the richest fifth.18 Thus, while income inequality may offend our sense of justice, its actual impact on the middle class may be small.
With a singular focus on income inequality, the left’s main solutions are greater re-distribution and a re-writing of the rules to “un-rig” the system. But, however well motivated, some of the biggest ideas into which they are directing their energy do not remotely address the underlying “Kodak” conundrum—how do Americans find their place in a rapidly changing world? In fact, some would actually make the task of increasing shared prosperity significantly harder.
Take, for example, a policy championed by Senator Bernie Sanders and others that is in danger of becoming a top progressive litmus test for Democrats—expanding Social Security benefits for all, regardless of income. The leading House version of this idea raises taxes on every working person and employer.19 It takes trillions of dollars from working age people and transfers it to the elderly—many of whom don’t need it. In fact, those who would get the greatest benefit net of new taxes are well-to-do suburban elderly couples.20 Meanwhile, this huge tax increase would do nothing to foster new investments in children, schools, research, or innovation—investments that have taken a back seat to entitlements.
Another populist policy would spend $15 trillion to create a single-payer, government-run health care system21—a massive amount especially when we have just finished the largest expansion of the social safety net in decades with the enactment of the Affordable Care Act (which we strongly support). Single-payer would be funded with a large payroll tax increase on all who work, according to the plan offered by Senator Sanders. As with the proposal to expand Social Security for rich and poor alike, it would divert money away from job-creating public investments—such as cancer research, bridge repair, and school construction.
Moreover, the narrative of fairness and inequality has, to put it mildly, failed to excite voters. In each of the last three election cycles, Democrats—the self-styled party of the middle-class—have lost the middle class by an average of seven points, a combined margin of defeat of 20.4 million votes.22 In 2014, this margin was 11-points,23 indicating once again that the “fairness” agenda and narrative Democrats offered did not connect well with middle income voters. Between 2008 and 2013, party registration for Democrats shrunk (-428,687) as Independent registration surged (+2.5 million).24 And, at the sub-presidential level, Democrats are in their deepest hole in nearly a century. Democrats today hold fewer House, Senate, and governors’ offices than at any time since 1930. When state legislative bodies are included, Democrats now have the smallest number of legislative majorities since Reconstruction. These trends should compel the party to rigorously question the electoral value of today’s populist agenda.
In contrast, political moderates view the erosion of the American Dream as less about unfairness and more about the dynamics of the new economy—where we are now in competition for jobs with everyone everywhere, and digitization and robotics are disrupting almost everything. Just 28% of moderates feel that “the deck is stacked against me.”25 By a 67-27% margin, moderates would rather see Washington focus on economic growth over income inequality.26 And, in a series of 2015 focus groups, swing voters pushed back against a narrative of unfairness and opined that the notion of the “deck being stacked” denotes pessimism, being “cursed,” “a probability of success [that is] slim to none,” and a “lack of hope for change.”27
Rather than being consumed with populist anger, moderates expressed a different emotion: economic anxiety. They felt they had survived the recession not because of government intervention, but because they did the right things on their own—sacrificing, tightening their belts, staying out of debt, postponing luxuries, and taking on extra work.28 But even though they have re-defined downward what it means to get ahead, they still express concern about reaching even that lower bar of success. They worry that as the economy goes through these vast changes, the best days for them, their children, their community, and their country may be in the past. And insofar as they are angry, their anger is directed toward a polarized government that lets them down, a Washington that bickers, and a political climate consumed by “my-way-or-the-highway” posturing, self-interest, and a lack of respect for the views of others.
We have a new economy and I don’t think we’ll ever recover to the same place we were before. Things are different and changed and so should the mindsets of individuals, companies, and the government. We need to find solutions that adapt to this new economy and not live in the past looking for the way things were.
— Millennial female focus group participant, July 201529
So what must Democrats do to offer a narrative and agenda that can restore broad prosperity and help the party do better at the ballot box in the long-run?
They must begin by recognizing that while this transition to a global, digital economy is a paradigm shift comparable in scale and scope to our move from an agrarian to industrial economy—2015 is simply not 1915. Large government was absent 100 years ago; today, total government spending is more than one-third of the economy.30 There was no safety net back then; today’s social safety net now ranks 2nd in social spending and subsidies among wealthy nations, according to the Organization for Economic Cooperation and Development (OECD).31 We had few regulations and worker protections and little legal infrastructure to enforce them; we now have myriad regulations and an extensive enforcement capacity. The top tax rate was 7% a century ago;32 it is 42% today* and is among the most progressive tax codes in the world.33 From climate regulations to the critical Dodd-Frank reform legislation, we have come a long way in the last decade. That is not to say that the safety net cannot still be strengthened, regulations toughened, enforcement beefed up, and taxation made more just. But this century demands dramatically different priorities.
*This includes the 39.6% marginal tax rate plus the 1.45% Medicare surcharge from the 1993 budget deal and 0.9% surcharge from the ACA in 2010.
Kodak, with its 145,000 employees, was not undone by economic unfairness, but by digital photography and the fact that people can take photos with their phones. Nine years ago, Borders Books had more than 1,000 stores and over 35,000 employees.34 Four years ago, it liquidated. This did not happen because of a stacked deck in Washington, but because of the Kindle and Amazon. Tower Records fell to iTunes. Radio Shack’s more than 7,000 brick-and-mortar stores were ill-suited for internet sales.35 Airbnb did not exist ten years ago; by next year, it will serve more travelers than the largest hotel chain in the world,36 and yet it will employ just 1,600 people37—about the same number of people employed as hotel desk clerks in North Dakota.38 Similarly, Lyft and Uber weren’t even imaginable just eight years ago; now they are increasingly used as an alternative to the highly regulated taxi industry. The daily reality for many working and middle-income voters is less about being treated unfairly and more about finding a way to succeed in an economy where change is occurring at a dizzying pace.
Most poignantly for Democratic policymakers, while voters try to navigate these economic tides, they sense our public policies and institutions haven’t been modernized for this global information age. They worry that they and their families are on their own in this journey, and that the basic middle class bargain—work hard, play by the rules, achieve the American Dream—has fallen into dis-repair. Driving this anxiety is deep skepticism about the efficacy of government, especially as a vehicle to help them succeed. To cite just one statistic: in a 2013 Gallup survey, 72% of voters cited “big government” as the greatest threat to the country, while just 21% named “big business”.39 This sentiment is a potent indicator of our national failure to re-imagine, much less reform—not simply expand—our government institutions, regulations, and policies to better fit this new era.
Thus, to ensure America and Americans are ready for this “Kodak” moment, a modern Democratic economic agenda should be organized around one over-arching goal: sustained private sector economic growth that expands and greatly benefits the middle class. And given the existing dynamics—a truly global economy, an ongoing technology revolution, and an already expansive government—the most effective formula for achieving that will be one that focuses relentlessly on the virtuous cycle that will drive widespread prosperity in the 21st century: more skills, more jobs, and more savings.
- Skills: Gone are the days when getting a high school diploma was enough to secure a middle-class lifestyle. Attaining and holding a series of solid-paying jobs now requires far more knowledge acquisition and mid-career learning. Yet our K-12 system is mired in mediocrity, higher education costs too much and delivers too little, and there are no easy avenues to keep one’s skills sharp over decades. The result is a massive mismatch between skills and available middle-income jobs that is likely to only widen.
- Jobs: Businesses are no longer required to locate, expand, and hire in the U.S. Globalization and digitization have transformed where and how jobs are created. Democrats too often are playing catch-up in this new economy, failing to re-think regulations, the tax code, R&D investment, small business promotion, export policy, and foreign direct investment to best enable private sector job creation.
- Savings: With entitlement spending already on an unsustainable path, wages squeezed, and defined benefits plans increasingly relics, we need to focus on fresh strategies to boost savings, giving job-hopping Americans a better shot at financial security for their families.
Bill Clinton began the conversation about economic modernization in the quieter and prosperous 1990s; President Obama continued it by making health care portable and secure, updating Wall Street rules, cutting the budget deficit, and pursuing the biggest export deal ever. But as the global economy evolves, so too must the Democratic Party. This is a discussion the Democratic Party will have for decades to come, as it seeks a substantively and politically resonant response to the economic enigma of our time: how to restore middle class well-being in ways that seek to seize, not stifle, the forces that are propelling our global, digitized century.
Building off the analytic and narrative shift laid out so far in this report, we turn next to exploring the major trends in skills, jobs, and savings. We then propose a set of ideas that could form the foundation of a modern Democratic economic growth agenda—one that shows that Democrats can govern and offers the best opportunity for generating long-term shared prosperity and restoring the timeless and essential American promise: if you work hard and play by the rules, success will be yours.
Section 2: The Agenda
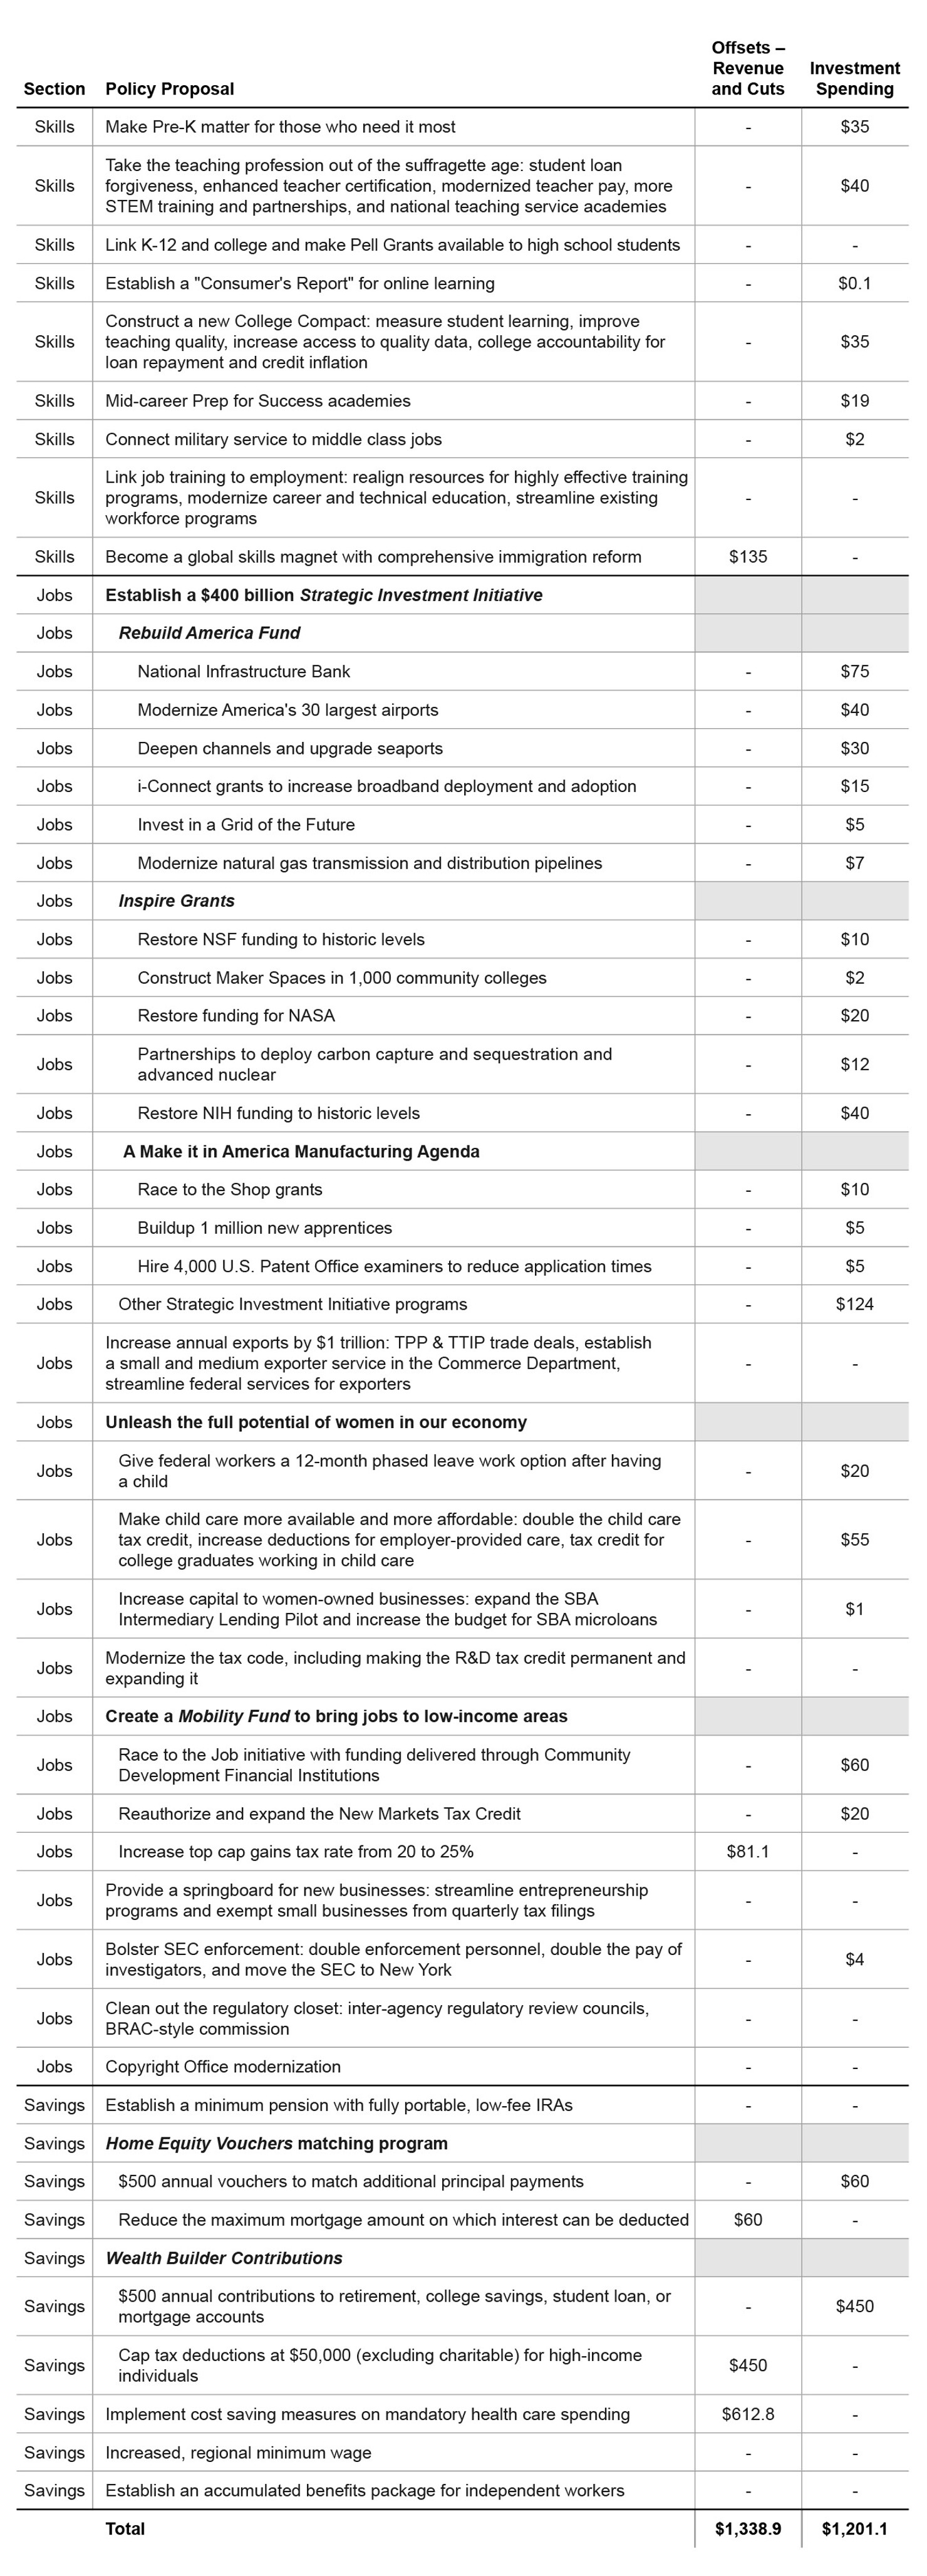
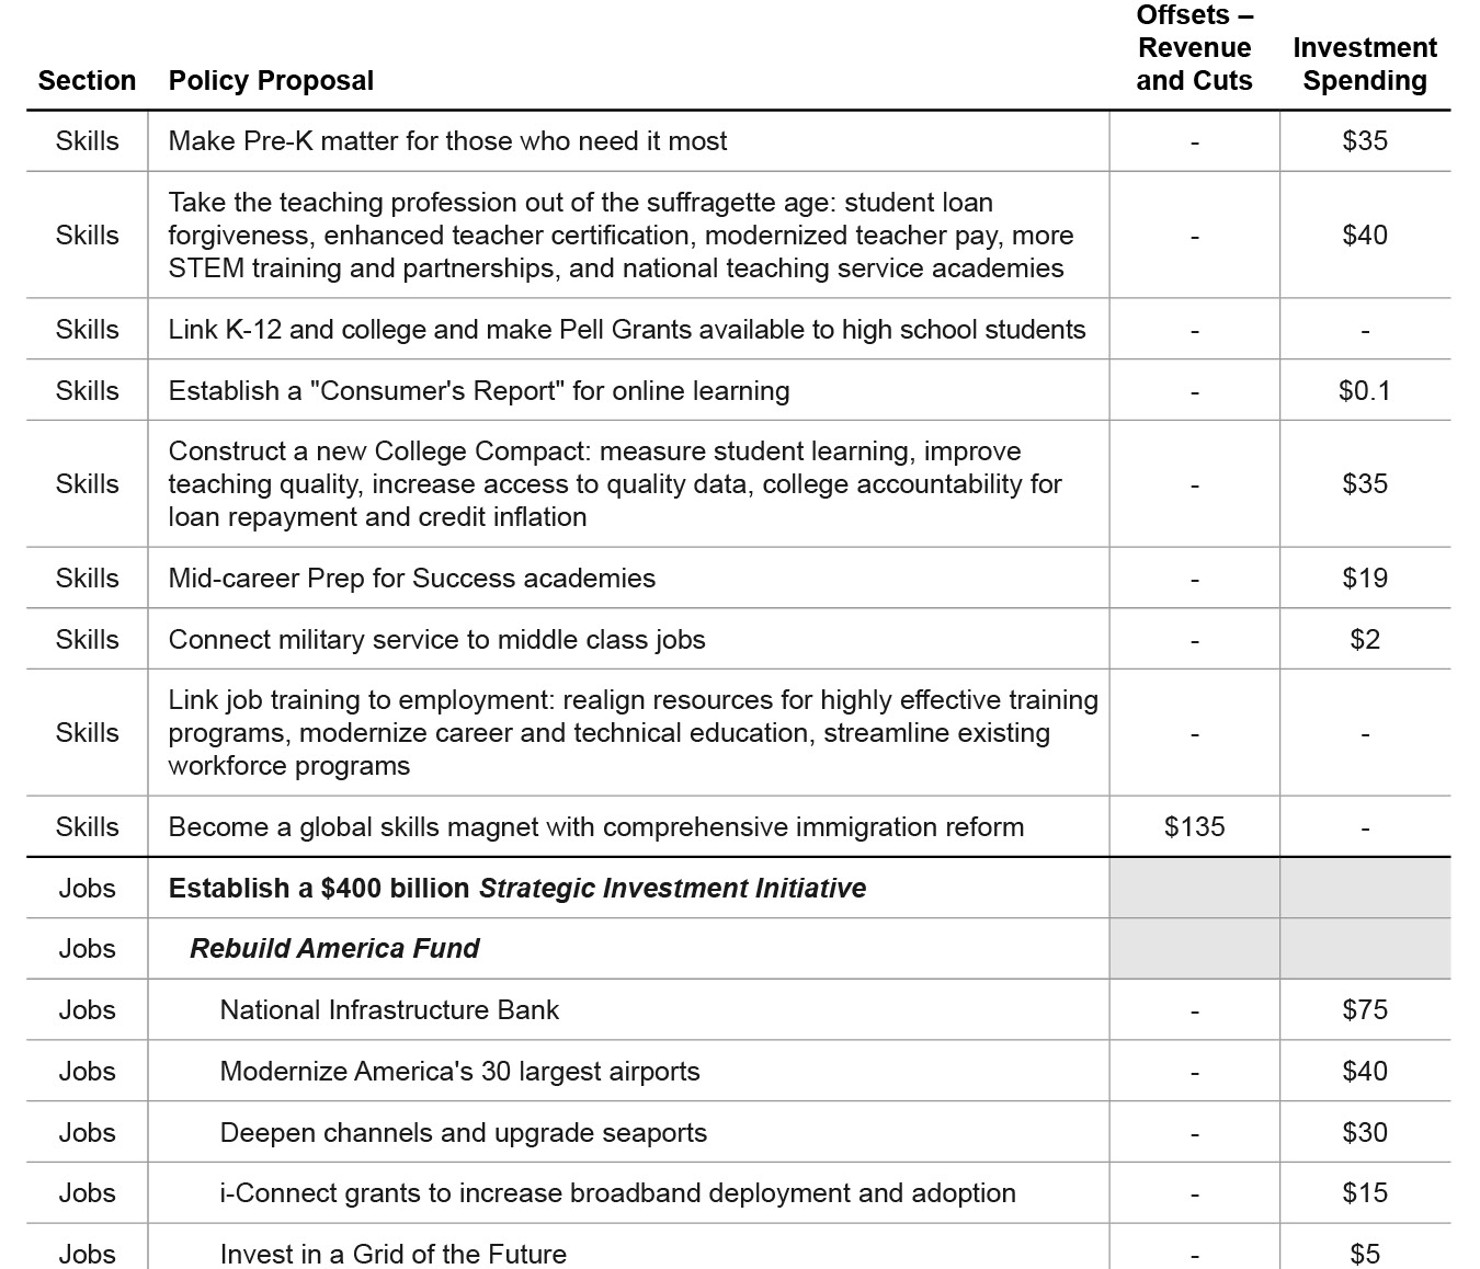
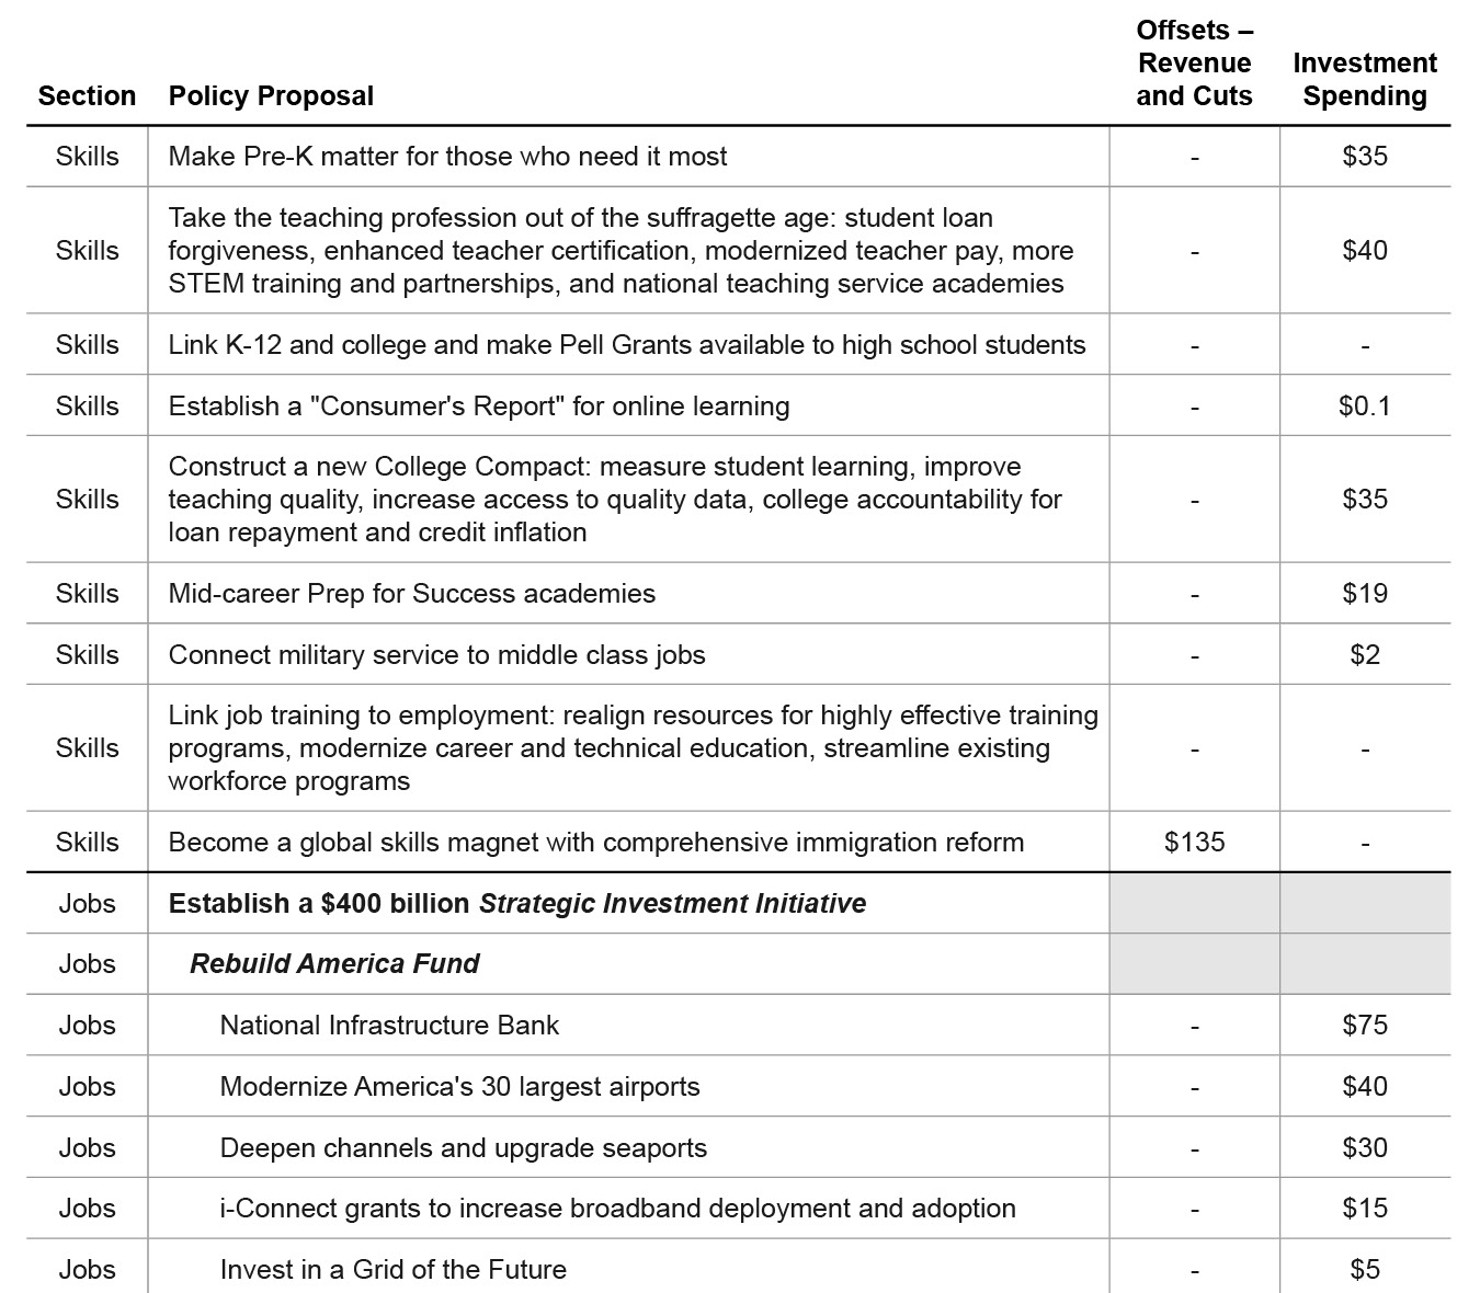
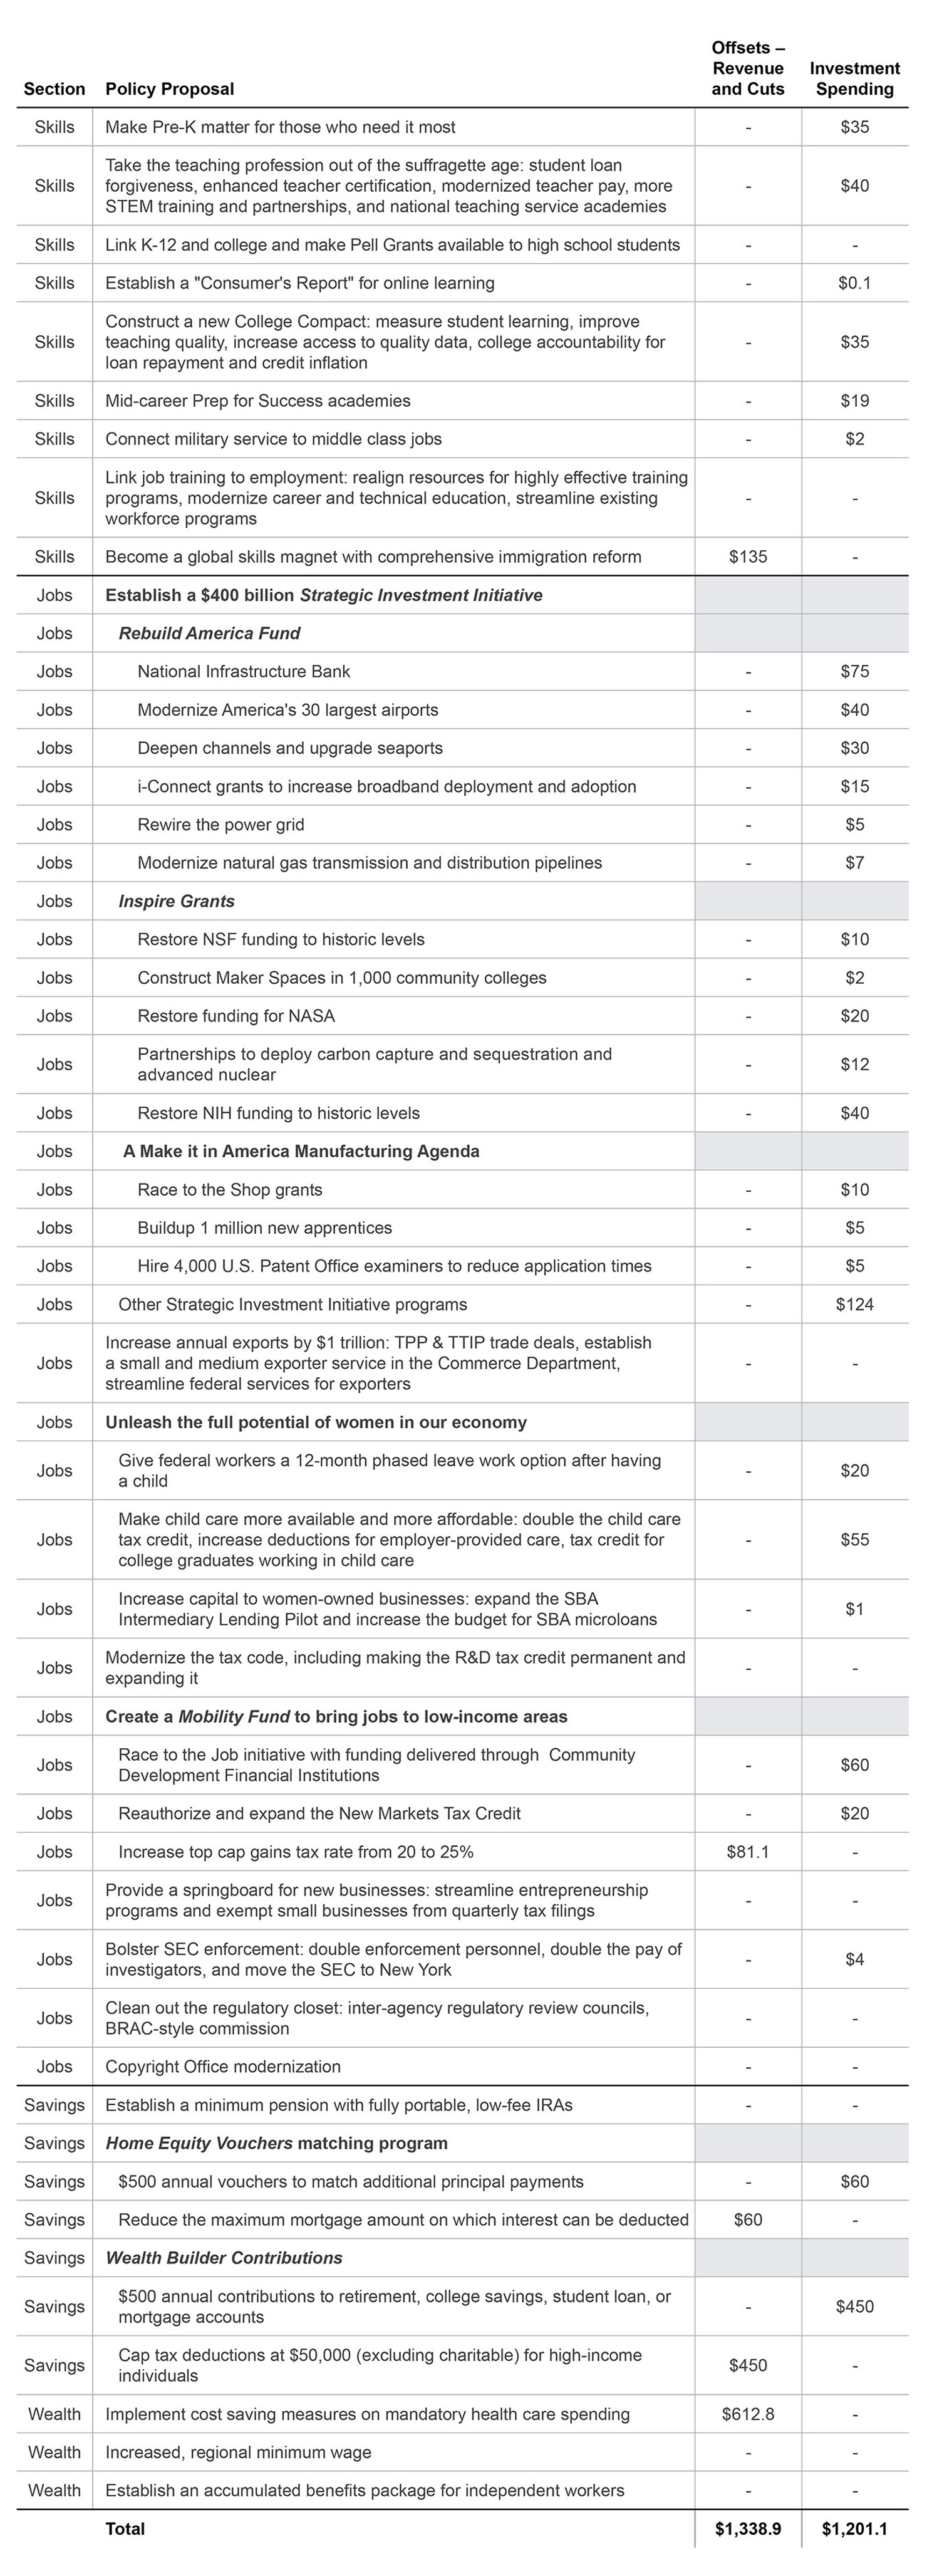
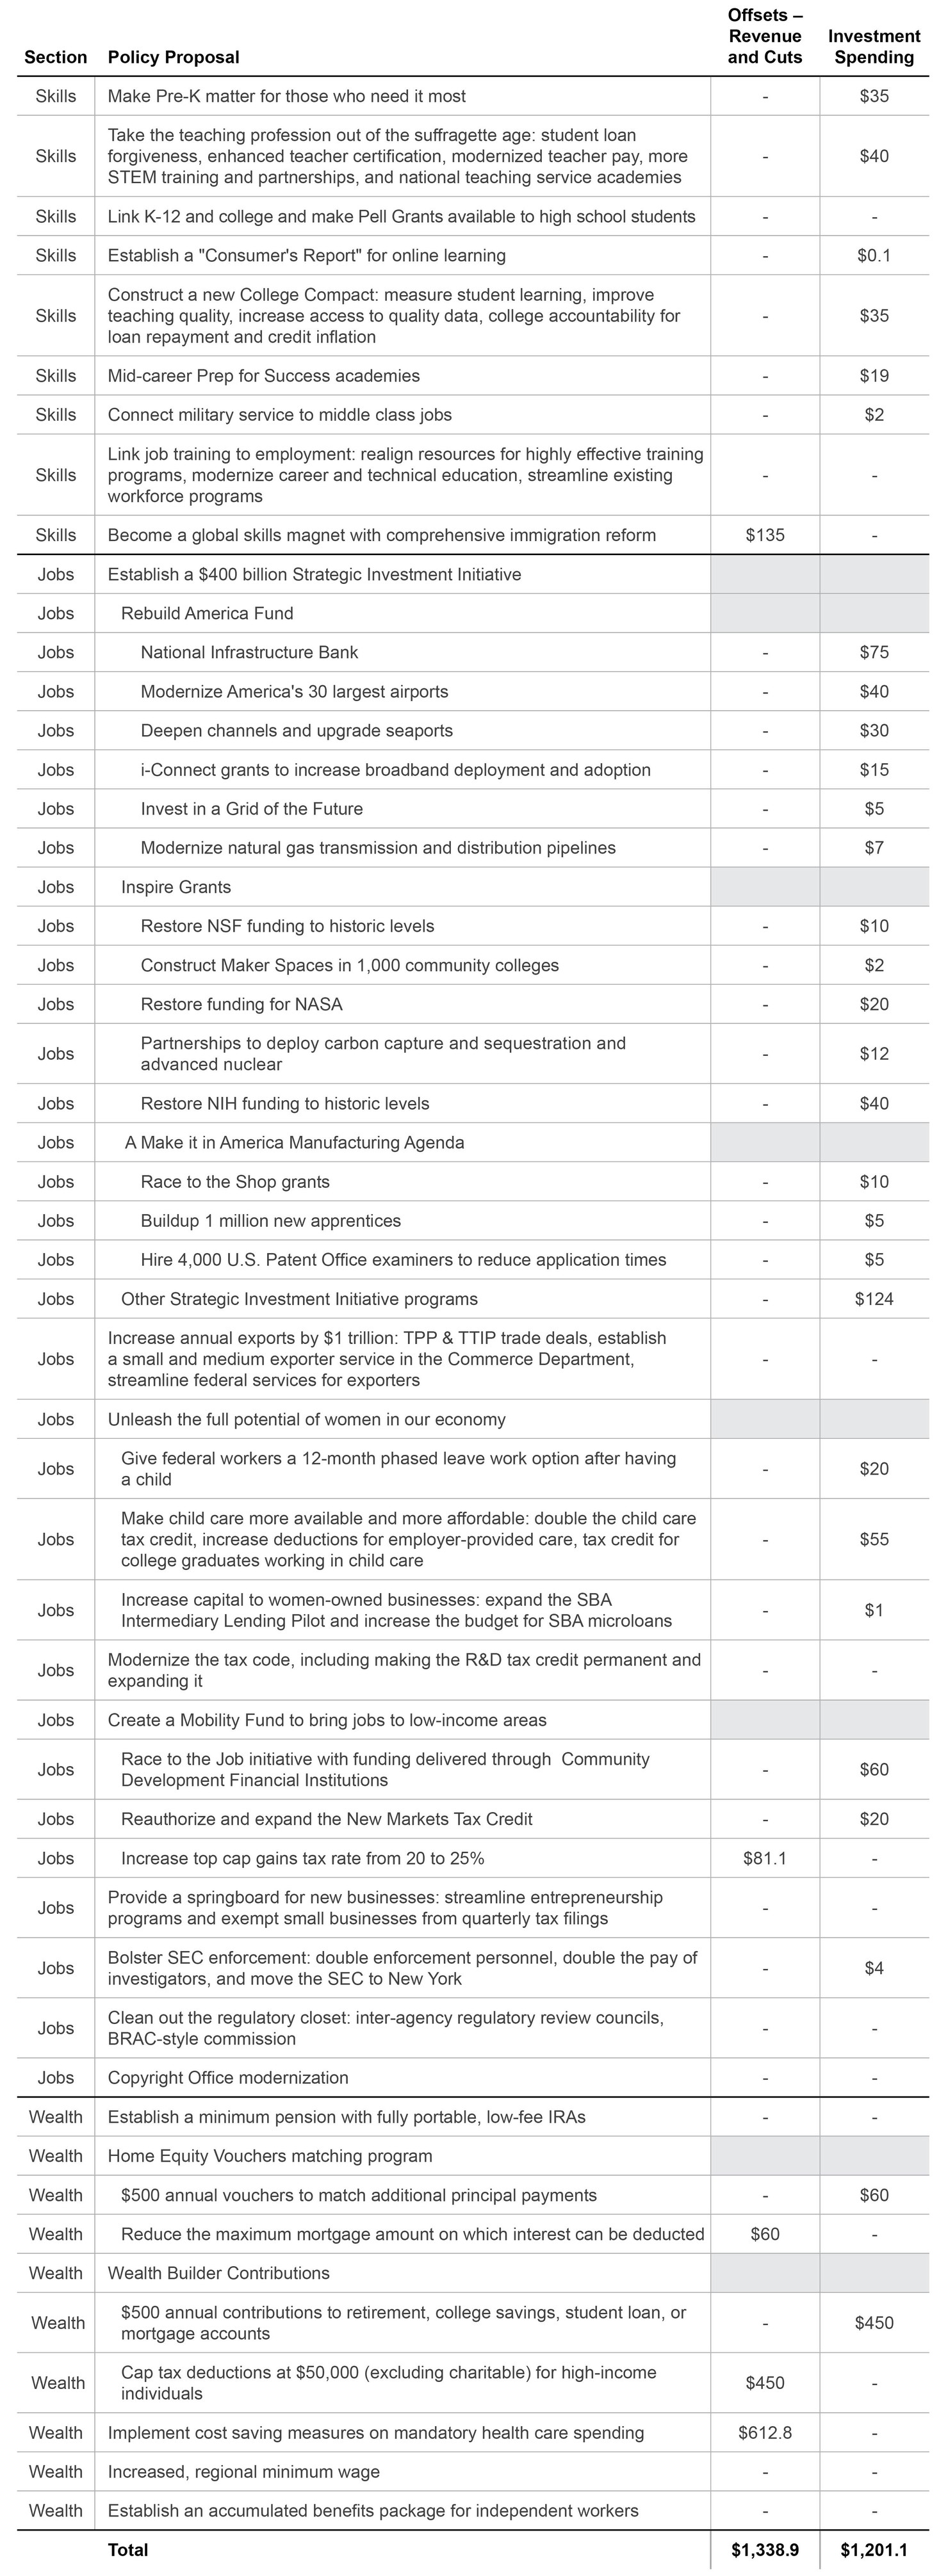
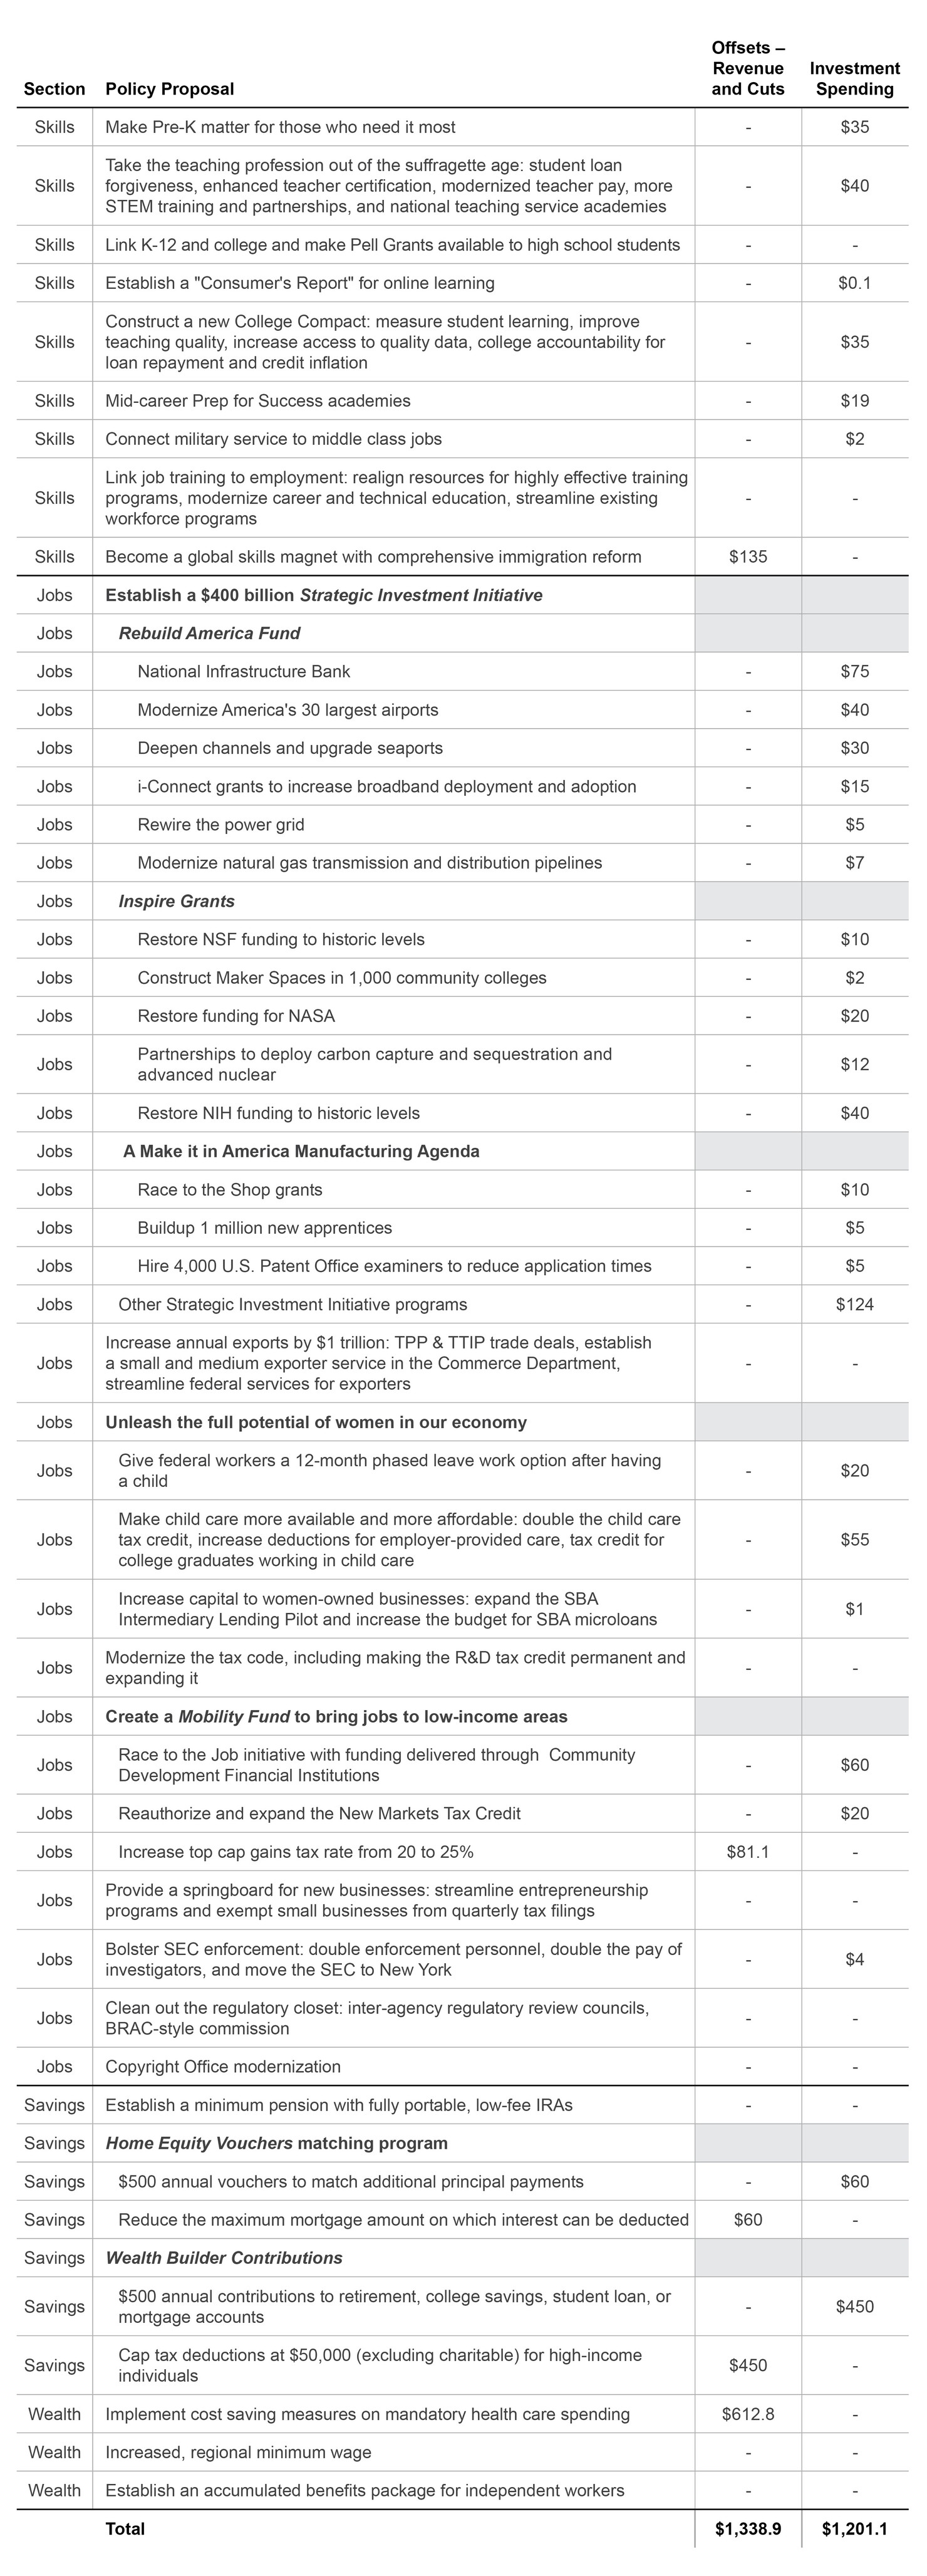
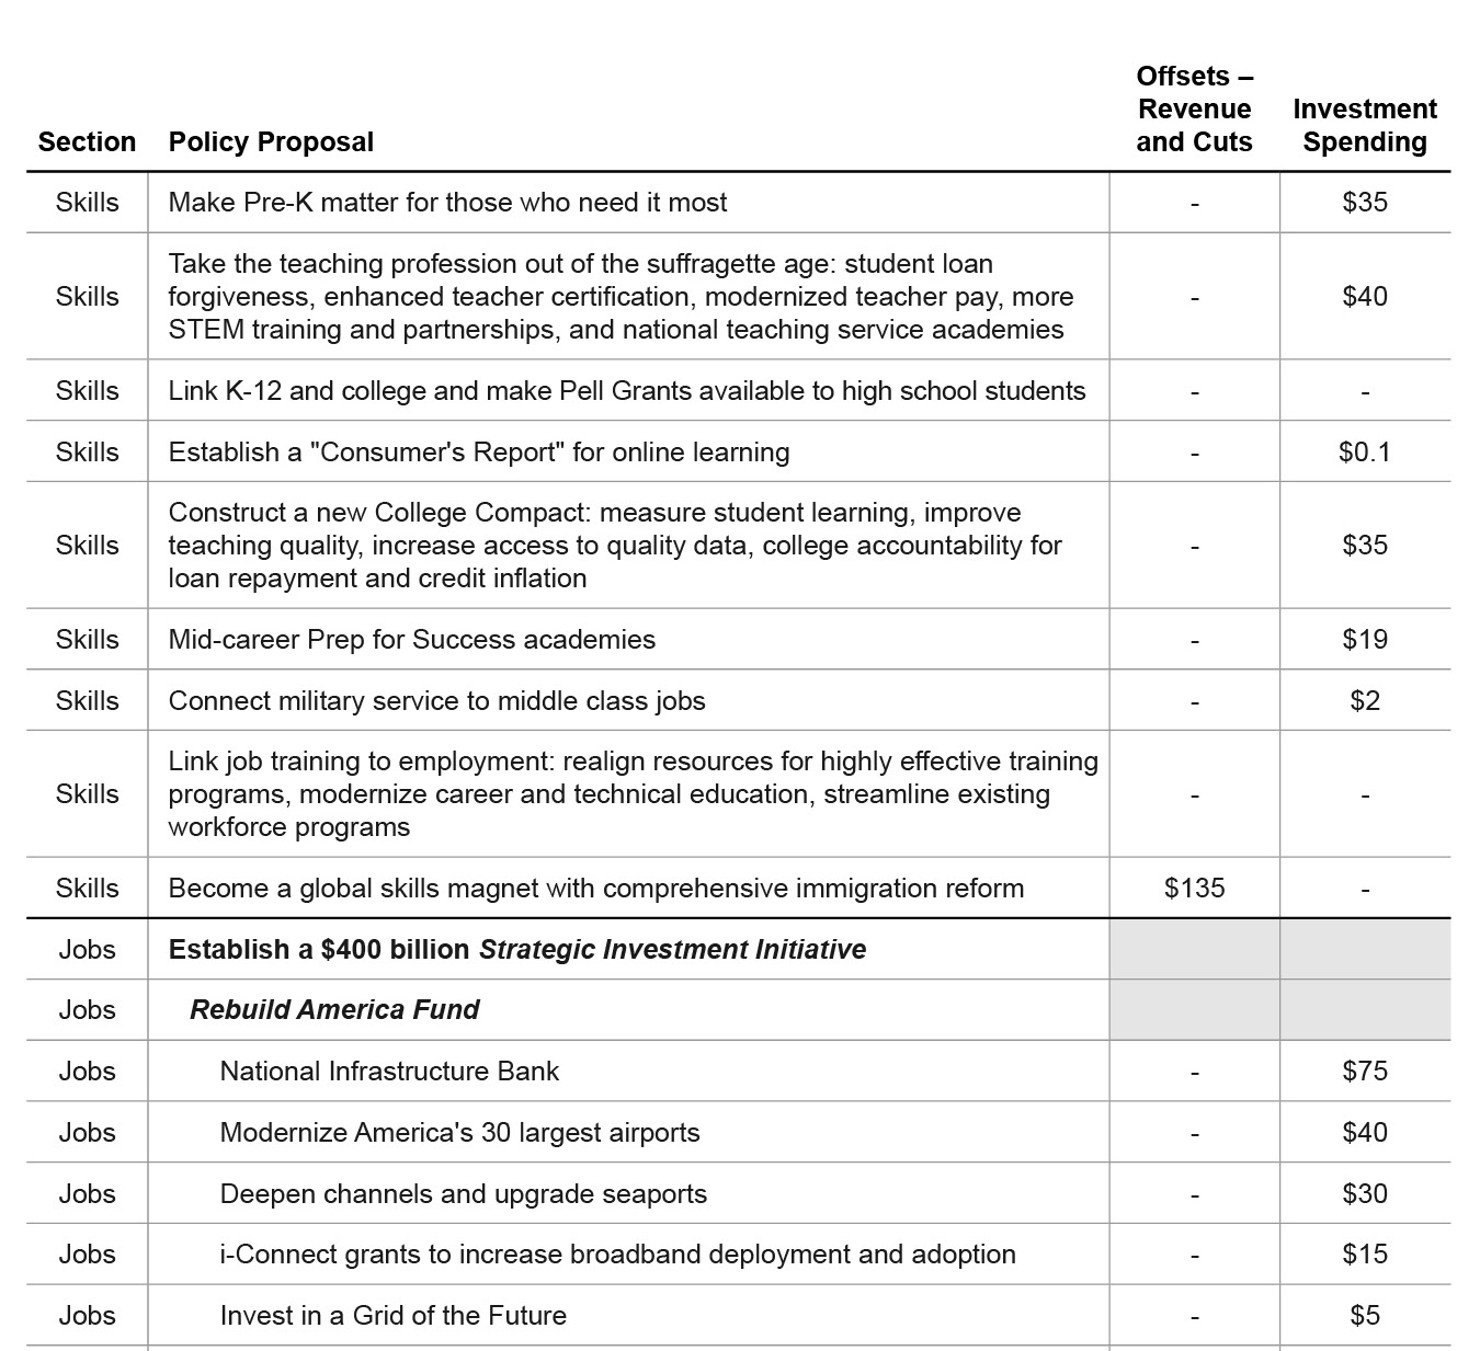
Summary: In this section, we call for an ambitious and actionable Democratic economic agenda organized around one over-arching goal: sustained economic growth that expands and benefits the middle class. We propose more than 70 policy ideas to create more skills, more jobs, and more savings. These budget-neutral policies provide more than $1 trillion in new investments in jobs, growth, education, and people. And the agenda restores the quintessential American promise: if you work hard and play by the rules, success will be yours.
Launch a Skills Revolution
We outline three major trends that are having profound effects on how Americans obtain and retain skills from childhood through their career: Stalling Schools, the College Wall, and Adult Atrophy. We then call for a skills revolution through the entire learning lifecycle—from age 4 to 64—so that far more Americans possess the skills to get and hold 21st century middle class jobs.
Policy Snapshot
• Make Pre-K matter for those who need it most. Comprehensive, peak-quality pre-K for every low- and moderate-income three- and four-year-old in the nation.
• Modernize the teaching profession. Robust loan forgiveness, enhanced teacher certification programs, an overhaul of the way we pay and promote teachers, and national teaching academies.
• Construct a new College Compact. Hold colleges accountable for improving instruction, increases abysmal graduation rates, and improves student outcomes so a family’s biggest investment in the future pays off.
• Mid-career Prep for Success academies. Free, high-quality prep courses for adults to hone basic skills so they can then succeed in community colleges or worker training programs.
• Link job training to employment. Reward training programs that actively engage local business, use labor market data and job projections to tailor training, and bring transparency to the job market.
• Become a global skills magnet. A renewed call for comprehensive immigration reform that prioritizes skills-based immigration, creates a path for temporary workers, and brings undocumented immigrants into the legal economy.
Change the Jobs Equation
We describe three major trends that are reshaping where and how jobs are created: the Upside-Down Economy, the Anywhere Economy, and the Malnourished Economy. We then show how to increase private sector jobs by getting businesses to locate, expand, and hire in the United States.
Policy Snapshot
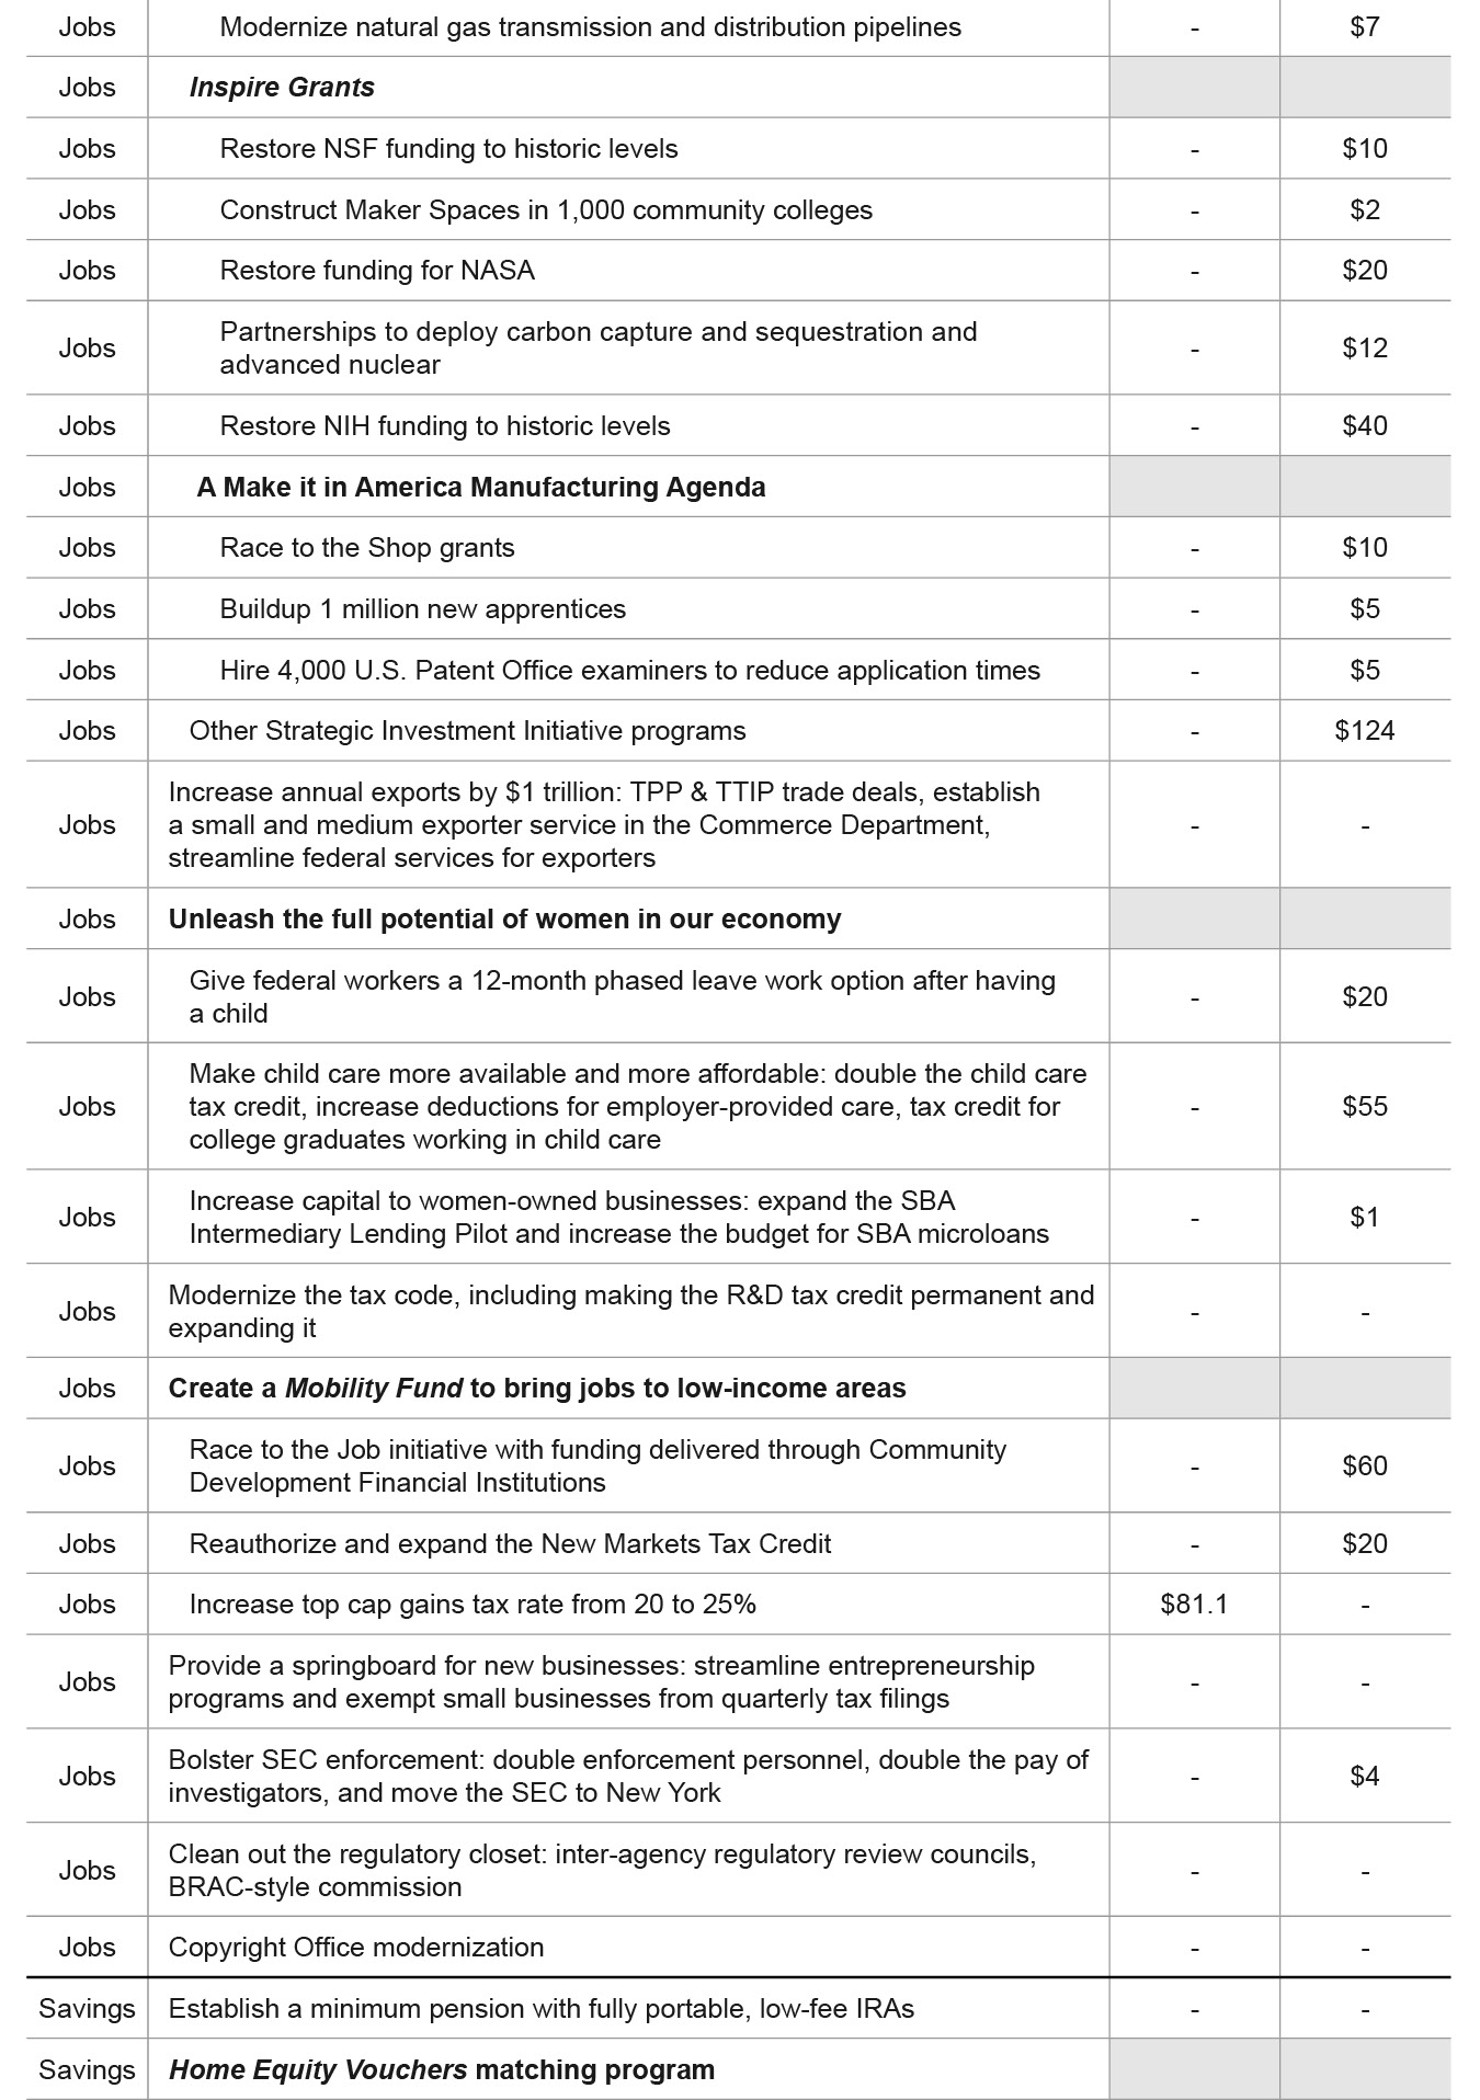
• Establish a $400 billion Strategic Investment Initiative. A fully offset infusion of new capital for federal investments in infrastructure, research, science, energy, and advanced manufacturing that directly creates private sector jobs.
• Increase U.S. annual exports by $1 trillion by 2025. TPP and TTIP trade deals, personalized export assistance for small and medium-sized businesses, and streamlined export bureaucracy.
• Unleash the full potential of women in our economy. More available and affordable child care, a “phased leave” work option for new parents, and more capital to women-owned businesses.
• Modernize the tax code. Revenue-neutral tax reform that lowers tax rates, broadens the base, eliminates loopholes, and makes the United States more attractive for businesses to locate and expand within our borders.
• Create a Mobility Fund to bring jobs to low-income areas. Raise the top capital gains rate by 5-points and apply the $80 billion in savings to a Mobility Fund that leverages and attracts over $700 billion in private capital to remake low-income areas with sustainable jobs and businesses.
Rewire Compensation to Boost Savings and Wages
We describe four major trends that are reshaping the workplace and worker compensation: the Hopscotch Workforce, the Nickel-and-Dimed Workforce, the Asset-Starved Workforce, and the D.I.Y. Workforce. We then propose a series of policies to boost savings, giving job-hopping Americans a better shot at financial security.
Policy Snapshot
• A minimum pension that closes the wealth gap. A minimum pension of 50¢ an hour, on top of current wages, to help all working Americans build assets, supplement Social Security, and guarantee a comfortable and dignified retirement.
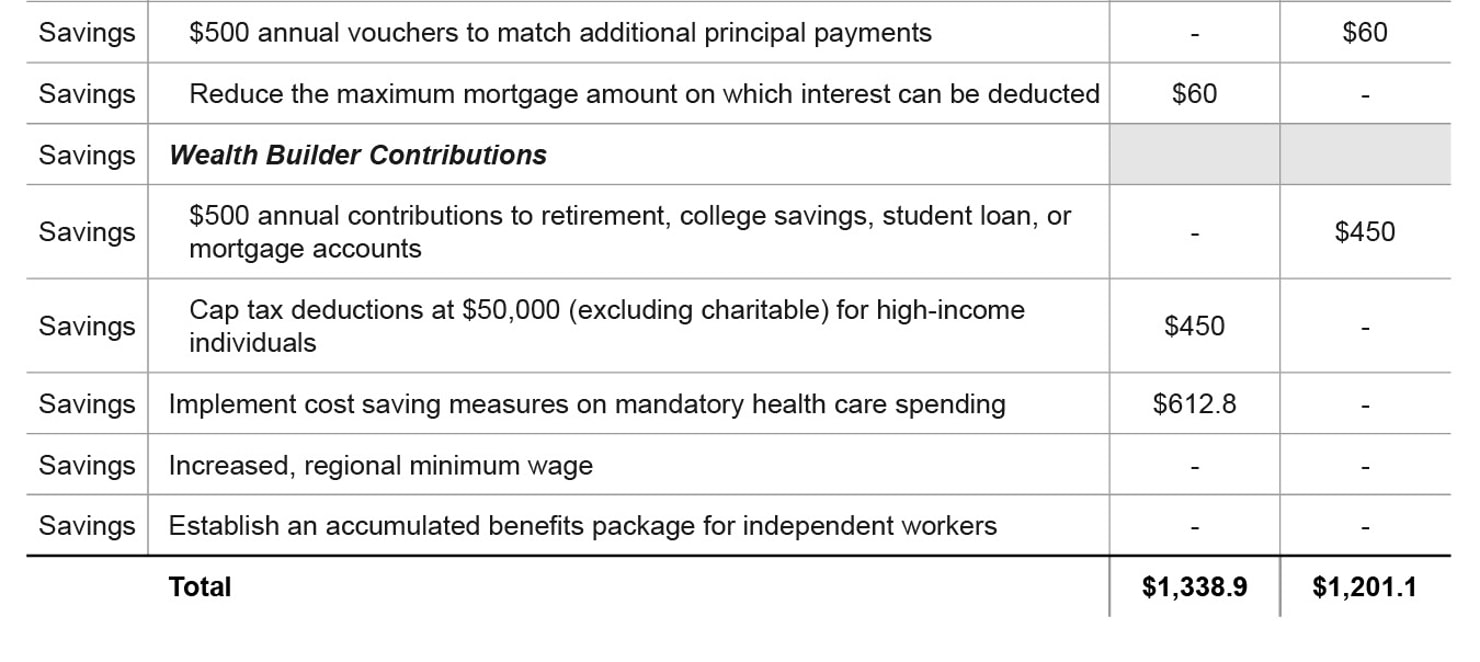
• Home Equity Vouchers for 12 million families. A $500 annual matching contribution for additional principal payments above a family’s current monthly mortgage to help build home equity, relieve the burden of debt, and realign incentives in the mortgage market.
• Wealth Builder Contributions for 90 million middle class workers. An annual contribution of $500 that can be directed to retirement, college savings, student loans, or a mortgage.
• A middle class wage hike through trimming the cost of non-wage benefits. Fifteen policies that would reduce both federal government health care spending and health care costs to employers and employees—making much needed room for increased wages.
• A regional minimum wage hike. Raise to $10-$12 by 2020 based on average hourly wages and regional cost variations, with readjustments every 3 years.
Launch a Skills Revolution
In 2011, with the U.S. unemployment rate at 9%, a survey of 2,000 U.S. companies found that 600 had positions open for more than six months that they could not fill.40 Even for those companies that could hire middle-skill employees—what the Markle Foundation defines as those that require some postsecondary education and pay north of $40,000—the lack of skills hurt productivity for one of every two manufacturers, one of three health care companies, and one of five retail companies.41
A high school diploma and a willingness to work hard used to be enough to reasonably secure a middle class job and lifestyle. Forty years ago, only 28% of jobs were held by those with postsecondary education.42 And that high school diploma went further, as the major tickets to enter the middle class—from housing to college to health care—were far less expensive than they are today. But as MIT economist David Autor notes, “while jobs at the top of the skill ladder—professional, technical, and managerial occupations—grew even more rapidly between 1980 and 2010, … skilled blue-collar occupations shrank rapidly and … the vulnerable ‘production jobs’ of the information age sharply reversed course.”43
Autor is among many prominent economists who believe that America is poised to create more middle class jobs that require middle-skill abilities, but he warns of “one obvious catch: the ability of the U.S. education and job training system … to produce the kinds of workers who will thrive in these middle-skill jobs of the future.” A report by the OECD bears this fear out, concluding that “the skill level of the American labor force is not merely slipping in comparison to that of its peers around the world, it has fallen dangerously behind.”44 “Human capital investment must be at the heart of any long-term strategy for producing skills that are complemented by rather than substituted for technological change,” Autor cautions as a postscript to his prediction of future job growth.45
This underscores the skills gap which is real, consequential, and spans a vast number of sectors and professions. Therefore, for policymakers to effectively address the first pillar of middle class prosperity—increasing individual skills—they must accept that solid-paying jobs now require far more formal education and mid-career learning than in the past. The changing nature of work, rapid development of technology, and inescapable global currents have fundamentally altered the set of skills necessary to sustain the standard of living we once knew. Yet our K-12 system is mired in mediocrity, higher education costs too much and delivers too little, and there are no easy avenues to keep skills sharp over decades. All of this leaves a massive mismatch between skills and available middle-income jobs.
According to the Society for Human Resource Management, “Employers and HR professionals continue to confront persistent gaps between the skills of the existing labor pool and the skills sought by employers to fill specific positions. One out of two organizations reported difficulty recruiting for full-time regular positions over the past year. One-half of those organizations cited lack of work experience, lack of the right technical skills or competition from other employers as a primary reason for difficulty in hiring qualified candidates.”46
Below, we outline three major trends that are having profound effects on how Americans obtain and retain skills from childhood through their career: Stalling Schools, the College Wall, and Adult Atrophy. We then argue for a skills revolution that makes adjustments through the entire learning lifecycle—from age 4 to 64—and suggest ways our institutions and public policies need to be modernized so that far more Americans possess the skills to get and hold 21st century middle-class jobs.
Stalling Schools
Since A Nation at Risk was issued in 1983, America’s public schools have shown some improvement. The era of accountability established under No Child Left Behind (NCLB) helped to bring measureable gains for students across the board, narrowing achievement gaps for students of color, English language learners, and students with disabilities. In particular, test scores have gently risen as nine-year olds have gone from an almost flat 0.1 point annual improvement in reading during the ‘70s, ‘80s, and ‘90s, to a modest nine-point improvement between 1999 and 2012. The results are similar in math as nine-year olds improved by a mere two-points through the 90s and have achieved a one point annual improvement each year since.47 Dropout rates have fallen, and graduation rates have edged higher among both boys and girls.48 Coupled with new efforts to create higher standards through the Common Core, we expect student learning to continue to trend in the right direction.
But let’s be clear, the modest improvements in school performance have fallen well short of the massive task of preparing the future workforce for a 21st century economy. College entrance exam scores have drifted lower over the last decade across all three SAT sections (reading, writing, and math).49 The mean ACT score for 2015 high school test takers “echoed results going back a decade,” according to The Washington Post.50 Math scores have fallen since 2012, and one-third of test takers scored below academic readiness in all four areas of math, English, reading, and science.51*
* It should be noted that test takers take the ACT voluntarily and that the universe of test takers changes over time which could have an effect on scoring trends.
Internationally, we are lagging behind competitor nations. According to the 2012 Programme for International Student Assessment (PISA)—a test that measures student aptitude in 34 highly-developed economies—the United States ranks 27th in mathematics and 19th in science.52 Korea is first and fourth, respectively.53 Moreover, the Department of Education reports that only 16% of American high school seniors are proficient in mathematics and interested in STEM (science, technology, engineering, and mathematics) subjects. And only about half of STEM majors end up pursuing a career in the field.54
Many STEM jobs pay double the average salary, and the Department of Commerce predicts STEM positions will increase by more than 17% by 2018.
#
There are many factors contributing to lackluster K-12 performance that are beyond the control of schools, such as poverty, family pressures, substance abuse, and domestic and neighborhood violence. Each of these needs to be addressed, and we do not wish to diminish these factors in any way. However, in this report, we focus on what many studies say is the single most important in-school factor for determining student success: getting the best out of our classroom teachers.55
In short, our antiquated model for teaching needs to evolve so that it becomes an attractive 21st century profession. Third Way’s Tamara Hiler and Lanae Erickson Hatalsky noted in a previous paper that “while other sectors, such as nursing, law, and medicine, have embraced major changes over the years to overhaul the way they train, promote, and compensate their employees, the teaching profession has failed to conduct a similar internal review or make the necessary course correction.”56 This reluctance to modernize discourages high-achieving college graduates from pursuing the profession and creates disincentives to keep excellent teachers from staying. In a 2013 survey of high-achieving 4-year college students, those embarking on the teaching profession were described as “nice” (50%), “patient” (46%), and “selfless” (43%), but—despite the importance of the profession and the dedication of many in the field—the attributes of “smart” (35%), “ambitious” (24%), or “curious” (27%) scored far lower.57
For those who do choose teaching, a survey by the American Federation of Teachers found that less than half of new teachers described their training as "very good," with one in three feeling unprepared for the first day of school.58 One of the major causes is the variable quality of teacher preparation programs and a lack of standardization in the credentialing process across states. As a result, teachers are often held to grossly different standards of entry into the profession, with programs offering varying timelines and degrees of rigor depending on where they are located. The major teachers’ unions agree that we should raise the bar. As a recent report from the National Education Association says, “The first step in transforming our profession is to strengthen and maintain strong and uniform standards for preparation and admission.”59
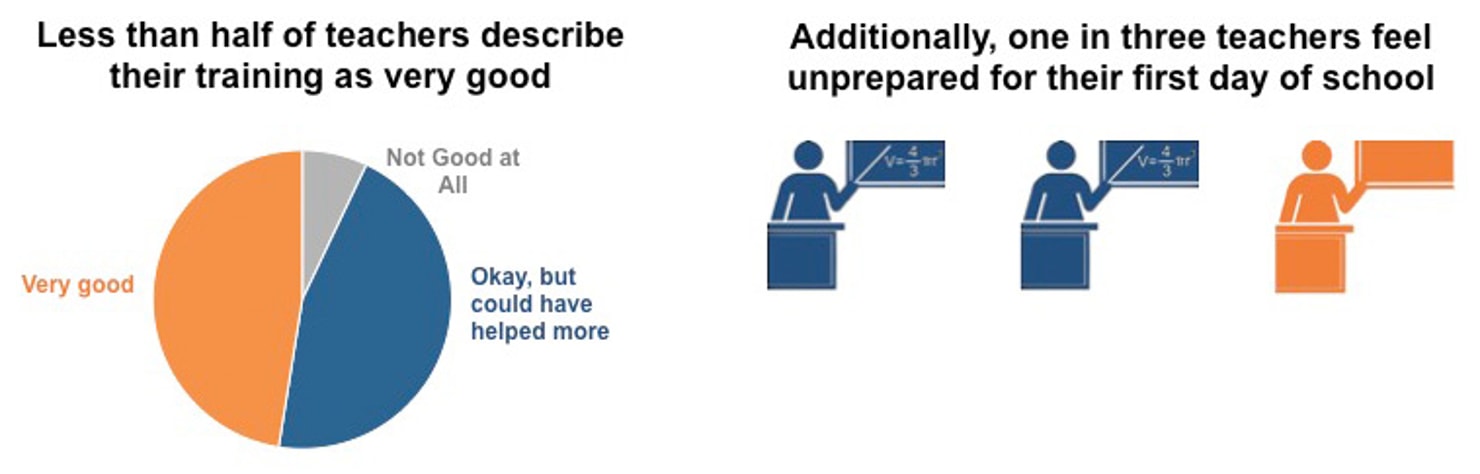
Source: American Federation of Teachers.
Further, the infrastructure for advancement and geographic mobility in teaching is not set up for a modern economy. Advancement opportunities for teachers are limited at best, leaving excellent teachers with little recourse to get raises or take on additional roles and responsibilities. Compensation does little to reward or incentivize great talent to stay. Nine out of ten school districts use a “step-and-ladder” compensation structure that only looks at teacher tenure and educational attainment—not quality, innovation, or excellence.60 And long vesting times and a lack of portability in teacher pension systems penalize young, successful teachers who may choose to enter another profession or move across state lines.
Over the next decade, America is expected to need to hire up to three million new teachers to fill classrooms.61 How can we expect our kids to be ready for the new economy when our country has an old-economy teaching profession model that is ill-suited to best attract, retain, or reward talent?
The high school credential has slipped a notch in value. In 2013, a high school graduate earned $22 per week less than a high school drop-out did in 1979, in inflation-adjusted dollars.62 A person with some college or an Associate’s degree earned a $50 per week less in 2013 than a high school graduate in 1979.63 This is how much the vast changes in the economy have affected those without a four-year degree.
The College Wall
This September, 1.2 million students began as full-time freshmen at a four-year college.64 By May of 2022—six school years later—just 700,000 will earn a degree. A staggering 500,000 will not.65
A recent study by Harvard labor economist Lawrence Katz found that a college degree provides four times the income benefit to a family than magically erasing the excess gains of the top 1% since 1979 and distributing them to everyone else.66 But college degree attainment, particularly among men, has stalled in America. A recent OECD report showed that only 30% of working age Americans have achieved a higher level of education than their parents, a showing that ranks 20th out of 23 OECD nations.67 In 1977, 27% of men age 25 to 29 possessed a college degree; 35 years later in 2012, 29.8% of men age 25 to 29 possessed a degree—a miniscule improvement.68 Women have done much better, but less than 40% of women over 25 hold a 4-year degree.69 The bottom line is that even though a two- or four-year college degree is the surest ticket to the middle class, not enough young adults are earning them.
A huge factor in stalled college attainment is that many of those that start degrees won’t make it through. Just 59% of those who begin four-year colleges as full-time freshmen graduate within six years. At two-year programs, just 31% receive a credential within three years.70 Public community colleges have the lowest success rate with just 20% graduating in this timespan.71
For those who do make it through, the quality they are getting for their often huge investment may not be sufficient. A shocking 36% will demonstrate no meaningful gains in critical thinking, 44% will not find work that requires a four-year degree (though this is certainly partly affected by the recession), and 25% will graduate with over $30,000 in debt.72 Employers are unimpressed with the workforce readiness of new graduates—polling by Gallup and the Lumina Foundation found that a mere 33% of industry leaders agree that new graduates have the skills necessary to meet business needs.73
America has accepted failure rates at 4-year colleges that approach 40% and at 2-year colleges in the neighborhood of 70% for too long. In an era where innovative companies must evolve to survive and thrive, why should colleges be any different? The productivity revolution that has changed so many aspects of our economy seems to have completely missed many of our nation’s colleges and universities. While Democrats have focused on going after unscrupulous for-profit universities and lowering student debt, that’s simply not enough. Increasing the quality of college education, improving college instruction, holding colleges more accountable for successes and failures, achieving greater value for tuition dollars, holding down student debt burdens, and ultimately graduating more students is a must for the economy and for families seeking a solid foundation in the middle class.
The Adult Atrophy
During the recession, Michigan launched No Worker Left Behind, an initiative to train 100,000 workers between 2007 and 2010. Michiganders flocked to the program, but it turned out that one in three working-age adults were deficient in basic skills, and a stunning 44% of all Michigan adults read below a sixth-grade level. "It's tragic," said Margaret Williamson, executive director of ProLiteracy Detroit. "You see them, they come in to us after they've been to Work First and they're so dejected because they cannot even get into a job training program."74
Economists Frank Levy and Richard Murname note that, looking ahead, “the human labor market will center on three kinds of work: solving unstructured problems, working with new information, and carrying out non-routine manual tasks.”75 Much of the rest of the work? Computers and low-wage workers. David Autor adds that “workers are more likely to benefit directly from automation if they supply tasks that are complemented by automation, but not if they primarily (or exclusively) supply tasks that are substituted.”76 Researchers at Oxford University predict that 47% of U.S. jobs could be automated within the next few decades.77 These technological and global changes mean that companies have a greater opportunity to hire from anywhere in the world, and Americans will be required to compete more fiercely for high-wage careers that demand continuously adaptive skill sets.
If someone's brain is more wired toward things that are hands-on mechanical and there are fewer and fewer jobs for that skill, they have fewer opportunities to be employed, even though they have a skill. That skill just does not have the value it may have had previously.
— Millennial female focus group participant, July 201578
Yet there are 46.5 million Americans in the workforce today who have no more education than a high school diploma.79 These and future workers who possess only a high school diploma must have an opportunity to increase their skills in order to secure jobs that allow them to enjoy a middle class life. Meanwhile, the Survey of Adult Skills (an international assessment that tests numeracy, literacy and problem solving in the world’s 20 most advanced economies) found that U.S. adults are far behind our international competitors:80
- In literacy, the United States ranked 14th out of 20;
- In numeracy, the United States ranked 18th out of 20; and,
- In problem solving, the United States came in 15th out of 17.*
* Not all countries administered the test measuring problem solving.
Acquiring new skills as an adult has become more self-directed than in the past as companies have decreased their training budgets. Between the years 1996 and 2008, the percentage of workers receiving training paid for by their employer decreased from 19.4% to 11.2% and the percentage of workers receiving on the job training also declined, from 13.1% to 8.4%.81
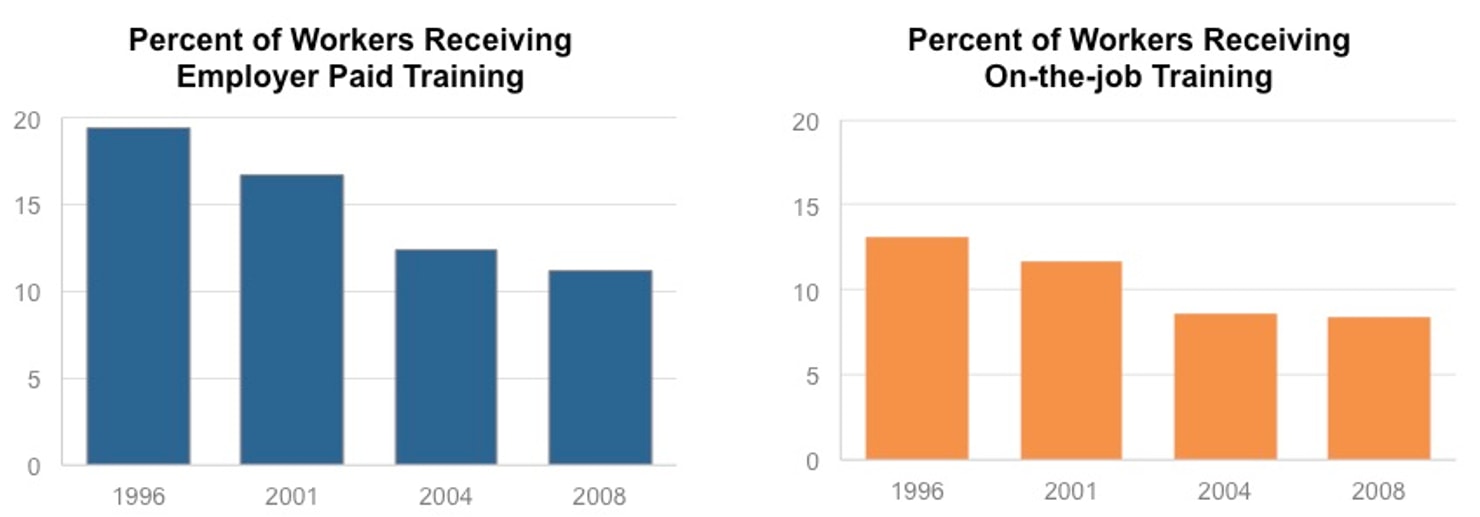
Source: Council of Economic Advisors.
Many adults in the workforce with only a high school diploma, or even some college, find that their skills have atrophied. They are not prepared for the next step in a career where a new job opportunity may require know-how they do not possess. They need a way to keep their skills fresh and sharp while they’re in the workforce.
So where does the Democratic Party go from here?
As a result of these three 21st century realities, we need a skills revolution that transforms the entire pipeline of learning—from the youngest learners through college and adulthood—so that far more Americans possess the skills to get and hold 21st century middle class jobs. Below, we lay out numerous ideas on how to do that, starting from the youngest learners to the oldest. To pay for these ideas, we allocate $130 billion over 10 years through savings in mandatory spending—specifically, as detailed later in the report, by reducing waste and inefficiencies in health care, none of which reduce, harm, or increase the cost of benefits.
1. Make Pre-K matter for those who need it most ($35 billion).
Pre-K doesn’t need to be universal: higher-income children face fewer barriers to mobility and less stress in their daily lives than low- and moderate-income children and, thus, get fewer benefits from pre-K services. Low-income children who attend pre-K, however, are more likely to graduate from high school, be employed as adults, and earn higher wages.82 Thus, we recommend that the federal government provide funding for comprehensive, peak-quality pre-K for every low- and moderate-income three- and four-year-old in the nation—the kids who need it the most and are the least likely to get it.83 Funding should be predicated on the use of evidence-based curricula that builds important non-cognitive skills like grit and a growth mindset—skills that lead to more successful students as well as adult success. Resources should also be made available for wraparound services that help low- and moderate-income families with child care, home visits, parenting skills, and mental and physical health. One great example of high-quality early education for these families is Head Start, which has provided a stepping stone to opportunity for over 50 years. Our proposals to strengthen this crucial federal program include maximizing the number of home visits, expanding emotional well-being services, eliminating the arbitrary funding division between Head Start and Early Head Start, and incentivizing early enrollment. Quality early childhood education—like that provided by Head Start programs nationwide—is crucial to getting low- and moderate-income children ready to learn in school and helping ensure their homes are conducive learning environments.
2. Take the teaching profession out of the suffragette age ($40 billion).
We have an antiquated professional model leftover from a time when ambitious, intelligent, career-oriented women had a paucity of choices where they could employ their highly developed skills. Even today, male teachers “constitute just 2.3% of pre-K and kindergarten teachers, 18.3% of the elementary and middle school teacher population, and 42% of the high school level teaching staff,” according to the Association of American Educators.84 Today, highly ambitious young women have myriad career choices and men still generally eschew the teaching profession. This calls for a re-think of a profession that expects entrants to stay for a 30-year career and punishes those who don’t. The system should be overhauled to incentivize top students to seek out the profession, provide those who excel in it with continuous opportunities to earn more responsibility and greater pay without making them leave the classroom, and allow qualified teachers to move to the next state or across the country without having to start from scratch. This could be done through the following steps:
- Boost teacher earnings through a total overhaul of student loan forgiveness programs. Federal student loan assistance fails teachers and does nothing to attract young people into the classroom. The TEACH grant program is so poorly designed that the federal government actually makes money off of college students who accept TEACH grants and are later penalized when those grants convert into loans. We call for making teacher loan assistance programs simple and real. Every teacher in a high-needs school or subject should receive a monthly loan payment from the federal government from the moment he or she steps in the classroom. Senator Orrin Hatch (R-UT), along with Senator Mark Warner (D-VA), Representative Derek Kilmer (D-WA), and Representative Richard Hanna (R-NY) have proposed legislation (the Teacher Loan Repayment Act of 2015) that would do just that. For the typical teacher with student loans, this would add $5,148 to their yearly pay.85
- Make teacher certification more rigorous and portable. The entryway into teaching is both unwieldy and undemanding. Each state sets its own (historically very low) bar for licensure, creating a jumbled patchwork of requirements that make it difficult for teachers to transfer their credentials from state to state. But young and modern professionals do not want to be geographically limited by the careers they choose. We call for the creation of a common application for teacher licensure that would allow teachers who demonstrate mastery of rigorous entry standards to move their credentials freely across state lines. Not only would this give states the ability to recruit excellent teachers from all over the country, it would also allow teachers to participate in a profession that better meets the needs of a 21st century mobile economy for the first time.
- Treat teachers like professionals. Today, nearly nine in 10 teachers are paid via step-and-ladder salary scales that only acknowledge their years in the classroom and number of degrees they hold.86 We must modernize the way we pay and promote teachers by expanding career ladder structures that no longer see teachers as interchangeable widgets, but recognize and reward excellence with additional leadership opportunities, increased pay, and more autonomy. One such career ladder model is the Leadership Initiative for Teachers (LIFT) system used in District of Columbia Public Schools, which offers increased compensation to teachers who help their students achieve academic growth and take on additional responsibilities within the school, like mentoring novice teachers or leading trainings for their peers. Delaware’s Committee to Advance Educator Compensation and Careers has also recommended offering base salary supplements for educators taking on leadership responsibilities in addition to their core roles.87 The government can also leverage philanthropic capital by providing one-time, 50% matching funds for school districts that attract private, charitable funding to modernize their career ladders.88
- Instill more teachers with STEM skills. The No Child Left Behind Act required states to ensure that all of their students were proficient in the critical skills of math and reading. Because of this, many districts spent less time focusing on other important subject areas, such as science, technology, and engineering. However, the proposed reauthorization of that bill—the Every Child Achieves Act—alleviates some of this problem through two key initiatives. First, an effort by Senators Orrin Hatch (R-UT) and Tammy Baldwin (D-WI), the Innovative Technology Expands Children’s Horizons (ITECH) program, would increase access to technology and provide teachers with the training needed to best use these new tools. Another effort from Senators Patty Murray (D-WA), Al Franken (D-MN), and Mark Kirk (R-IL) would provide states with the support needed to establish partnerships between schools, businesses, and non-profit organizations—all with the goal of improving student learning through STEM activities, including teacher training in the STEM fields.
- Establish four national teaching service academies. The U.S. military academies are widely respected institutions, which attract and inspire the brightest, hardest-working 18-year olds and provide them a free, top-flight education in exchange for five years of active duty in service of their country. We recommend establishing national teaching academies that would replicate this model with the aim of building the next generation of outstanding teachers. The teaching academies should be located in a diverse range of U.S. cities in need of a K-12 Renaissance. The academies would provide free, rigorous liberal arts education and national board certification. They would use innovative approaches to train graduates as student-teachers and place them in key districts across the country for a minimum of five years of national service. Not only would the academies help fight the achievement gap, but they would also provide an infusion of economic activity and human capital into these cities.
3. Link K-12 and college.
College readiness is a big problem among high school graduates. This stems, in part, from a historic lack of alignment between the K-12 and higher education systems, and from the “honesty gap” that has allowed states to label students as proficient even when they are not.89 The recent implementation of the Common Core State Standards has been an important first step in providing students with the high-level math and reading skills they need to be successful in college; however, we have more to do to ensure that all students can directly transfer that knowledge to a higher education setting. One way to strengthen this connection is to increase high school students’ exposure to college-level material, whether through expanded access to Advanced Placement classes or greater investments in “early college” high schools that allow students to simultaneously earn both an associate degree and high school diploma. In addition, recent efforts by the College Board to mail informational packets to all high-school seniors deemed college-ready, including information on application fee waivers, with follow ups by high school guidance counselors and state officials, should be duplicated in all states as a way to increase understanding of college options at a young age.90
Particular attention should be paid to enticing high-performing, low-income students to dream big and attend college. For example, Pell Grants should be modified to strengthen the link to college. Currently, Pell Grants are only offered to college students who have already obtained a high school diploma—not to high school students enrolled in early college courses. Making Pell Grants available to these students would encourage earlier college degree attainment. Senators Rob Portman (R-OH) and Mark Warner (D-VA) recently introduced legislation that would do just this. The “Go to High School, Go to College Act,” would incentivize high schools to offer college courses to students by allowing them to be funded by Pell Grants.
4. Establish a “Consumer’s Report” for online learning.
In 2009, 1.8 million K-12 students were enrolled in an online or distance learning course.91 That doesn’t include the millions of students who use online learning programs at home to supplement in-class teaching, or the 6.7 million college students who took at least one online course in 2011.92 But as Peggy Clements of the Education Development Center notes, educators not only don’t know “whether online courses work or do not work, but under what circumstances they work, for what purposes they work, and what types of support—from online teachers, school staff, and even other students—benefit students when they’re participating in an online course.”93 We need a “Consumer’s Report” for online learning that “harnesses technology to improve K-12 education,” as called for by economists Aaron Chatterji and Benjamin Jones in a 2012 Hamilton Project paper.94 They propose the creation of a non-profit entity to evaluate education technologies using rigorous randomized methods, to rate education technology products, and to disseminate that information to the nation’s 13,754 school districts.95 We would expand this idea to include evaluation of college-level courses to help students throughout their learning career. This “Consumer’s Report” for online learning can be established within a government agency, for example the Department of Education or the Federal Trade Commission (which has broad authority to prevent false advertising to consumers).
5. Construct a new College Compact ($35 billion).
We need a new compact with America’s colleges that will restore the promise of higher education—a top notch education at an affordable price:
- Make teaching and student learning the top priority for colleges. By 2020, every college in America that receives federal loans or grants should be required to have a transparent system in place to measure student learning, as well as an actionable plan to improve teaching quality. The goal of this would be to ensure that students are actually increasing their skills and knowledge and, therefore, getting a good value for their money. To help colleges with this, the federal government can provide funding to help colleges design the best ways to evaluate student learning outcomes. Congress should also ensure that a minimum of 1% of total federal funding on research and instruction is spent every year on improving teaching quality, either by helping to raise the prestige of highly-effective professors, incentivizing institutions to focus on the pedagogical development of its educators, or providing students with greater protections around the quality of instruction they receive.
- A Right-to-Know Law for college consumers. Earlier this year, we called for increasing transparency so parents and students can have far more expansive quality information to make better-informed choices about where to make their college investment. Since then, the Obama Administration has begun to take steps to allow parents and students to link institution-level college prices, debt levels, and graduate employment earnings through their College Scorecard—but families deserve the ability to access more customized data broken down by demographics, college majors, and employment levels so that they can make sure college is truly worth the cost.96 Using the leverage of the federal government to ensure that valuable student-unit level consumer data is made public (data can easily be anonymized to protect individual privacy) would allow the media, researchers, and consumers themselves to see how schools are performing for all types of students in order to make more educated choices about where to make their college investment.
- Ensure colleges have “skin in the game” for student non-payment of loans. Colleges largely get a free pass if their students earn too little to meet their monthly loan payments. A new system of accountability should be designed—based not on defaults, but on the percentage of students who are unable to make at least a one-dollar reduction in their principal balance over the course of a year. This new system should also be coupled with a monetary bonus for schools that enroll a high percentage of Pell Grant recipients, so institutions aren’t given the incentive to raise admissions standards to weed out individuals who they fear may be less likely to succeed. If crafted correctly, this new system would force schools to bear some of the risk that now entirely rests with students. Senators Jeanne Shaheen (D-NH) and Orrin Hatch (R-UT) have introduced legislation, “The Student Protection and Success Act,” which would take this important step toward increased accountability.
- Penalize colleges for credit inflation. According to the Department of Education, the average college student accumulates 138 credits upon graduation—though most schools only require 120. These additional 18 credits tack on an extra semester, and cost around $6,500 per student.97 Schools that accept federal aid should be required to pay a penalty up to half of the cost of additional credits if a high percentage of their students earn more credits than it takes to graduate.
6. Mid-career Prep for Success academies ($19 billion).
Millions of adults need to upgrade their skills or earn a new credential, but their academic foundation has diminished since high school. From parents wanting to re-enter the workforce after raising a child to someone looking to make a career jump, this lack of readiness affects an individual’s potential to qualify for or succeed in a training program, community college, or 4-year school. We propose free, high-quality Prep for Success courses for adults to hone basic skills so they can then succeed in community colleges or worker training programs, preferably before they lose their jobs and need re-training. This would be offered free-of-charge to all adults whether or not they are currently employed. The federal government would work with private employers and unions to disseminate information about these courses to their workers. Classes would be delivered via blended learning—meaning that students could learn from home, through their union, or even while on a break from work. Ultimately, this program would provide crucial worker training in the most convenient, efficient, and effective way possible.
7. Connect military service to middle class jobs ($2 billion).
According to the Department of Labor, eight in 10 veterans leave military service without a job lined up, one in four veterans were underemployed and earning below-poverty wages, and the spouses of service members report 90% unemployment or underemployment.98 To link service members, their spouses, reservists, and members of the National Guard to middle class jobs, we call for training centers to be established at each military base to guide individuals through state licensing procedures and certification processes as well as to connect them with necessary training and relevant employers. Additionally, these centers could be used to help active duty members find and participate in externships with private sector companies in fields related to their expertise. This would allow these individuals to remain connected to the civilian labor force and maintain the competitive skills necessary for non-military employment while also enhancing the knowledge and skills that they bring to their military occupations
8. Link job training to employment.
Vice President Joe Biden noted that “We have to be prepared for a 21st century world…It’s not just preparing for the jobs that exist, it’s preparing for the jobs you know are going to be coming.”99 To meet this goal, we call on Washington to commit resources—from federal grant programs to other support—will incent and reward workforce training programs that effectively give Americans the skills necessary to prosper in the future. As we have previously written, effective workforce programs exhibit an identifiable series of characteristics.100 They must actively engage local business so that training is designed to meet the specific needs of employers. They use labor market data and job projections to tailor training to growing industries and eliminate irrelevant programs. They bring transparency to the job market and build career tracks—all while providing “wrap-around” services to help job seekers facing difficult circumstances.
Efforts should start by modernizing the Perkins Career and Technical Education Program, which is a federal program for career and technical education (CTE). A large and diverse coalition of industry leaders, community colleges, state agencies, and nonprofits have called for an overhaul of the program so that CTE programs align with local labor markets, increase collaboration between schools and employers, and increase industry partnerships and credentials. The sheer number of competing workforce programs also needs to be overhauled—there are currently 20 workforce programs housed in five separate federal departments. The Center for American Progress has proposed the creation of a national Workforce Investment Bank, which would streamline the various programs, align their goals, and house them under one roof.101 A simplified, more targeted workforce development system would allow the federal government to use its resources more efficiently to better reach those with the greatest needs.
9. Become a global skills magnet.
Immigrants were central to the first 240 years of America’s economic success, and they will be central to the next 240 years. Our immigration system must explicitly attract the world’s best talent to increase the productivity of our overall workforce. Comprehensive immigration reform should prioritize skills-based immigration, eliminate arbitrary immigration caps that keep skilled workers out of the country, retain the talented foreign students we educate, create a path for the temporary workers our economy relies on, and—of course—bring the 11 million undocumented immigrants already here out of the shadows and into the legal economy. This is exactly what the bipartisan “Gang of Eight” bill that passed the Senate last Congress would do.
Change the Jobs Equation
When Fortune Magazine first unveiled its list of the 500 largest global companies in 1990, 167 were headquartered in the United States.102 By 2014, that number had dropped to 128, with another 98 of the “Fortune Global 500” now headquartered in China.103 Of the top 10 global companies last year, just two (WalMart and Exxon) were American while three were Chinese.104 According to Fortune, these 500 companies were spread out among 36 countries, generated $31.2 trillion of revenue (roughly twice the size of the U.S. economy), made $1.7 trillion in profit, and employed 65 million people.105
Looking ahead, a McKinsey Global Institute report predicts that the share of Fortune Global 500 companies from “emerging economies” will probably jump to more than 45% by 2025, up from just 5% in 2000.”106 McKinsey estimates that of the next 7,000 firms to clear the threshold of one billion dollars in annual revenue, 5,000 will be located in emerging market countries.107
While corporate giants are getting more global, what about the new kids on the block? Harvard Business School’s 2015 Survey on U.S. Competitiveness found that the startup rate of new businesses has been dropping since the 1980s. They found that firms in their first year of operations accounted for about 13% of all companies in 1980, but only 8% in recent years—a trend that has spread across multiple industries.108 This is particularly concerning as new job growth is generated mostly from younger firms, not older ones.109 Moreover, as the number of new business starts has crested, the average number of people they employ per firm is down by nearly half. According to the Bureau of Labor Statistics, an average new business hired 4.4 people in 2011, compared to 7.3 in the 1990s.110
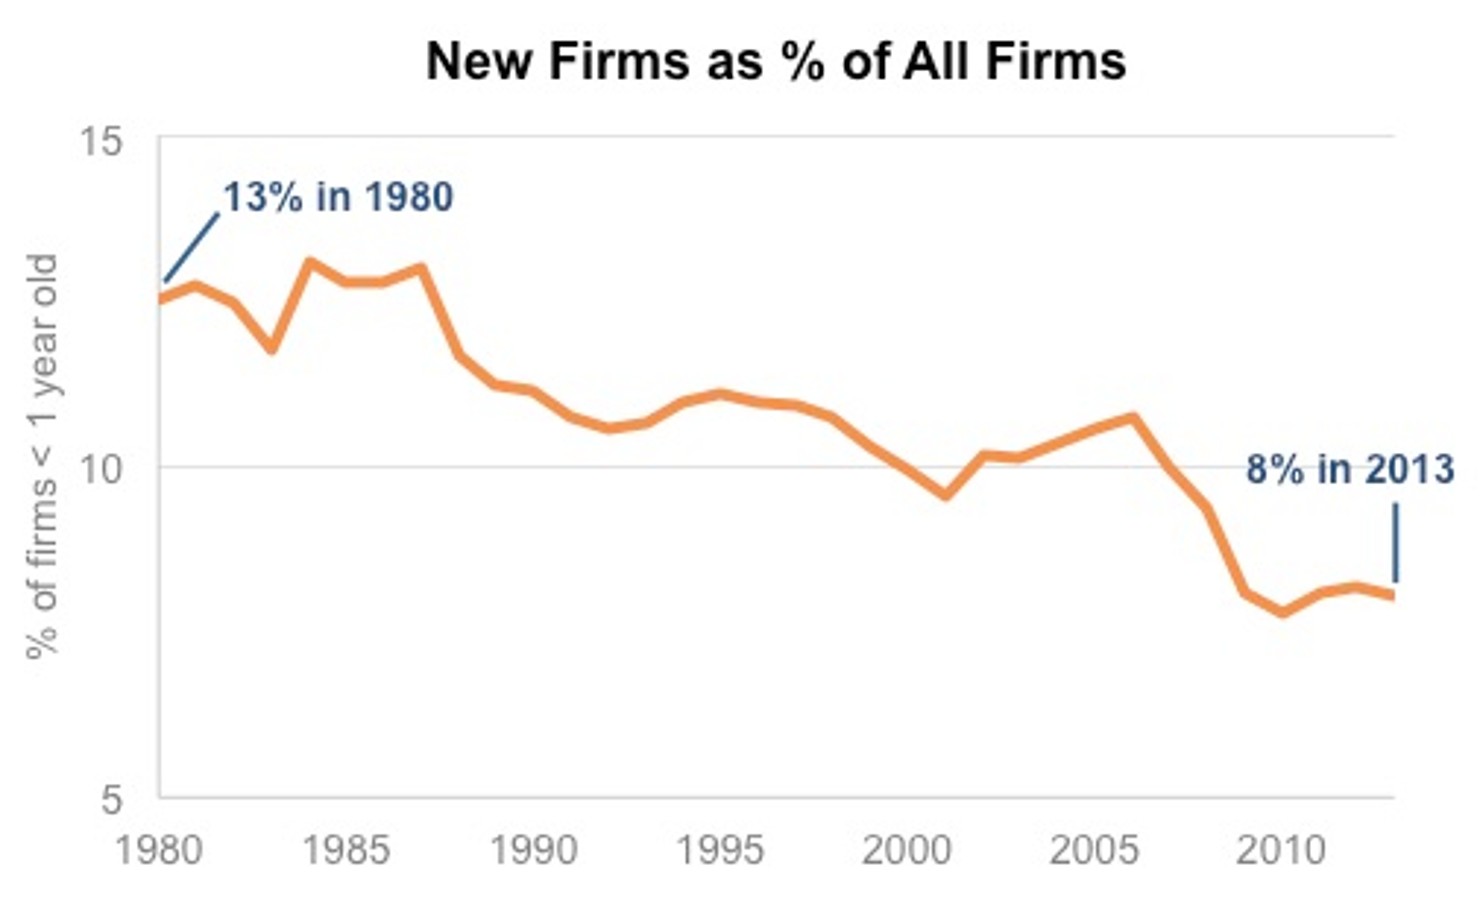
Source: U.S. Census Business Dynamic Statistics.
If policymakers are to effectively address the second pillar of middle class prosperity—increasing private sector jobs—they need to fully embrace the reality that businesses no longer need to locate, expand, and hire in the U.S. Globalization and digitization have transformed where and how private sector jobs are created. Foreign markets are creating vast and unprecedented opportunities abroad. Other countries are racing to reform their tax policies to better attract business investment, location and hiring. And the emerging market governments are increasing their investments in innovation, physical infrastructure, and human capital as the U.S. pulls back on investments. The old success formula for America is no longer working.
Below, we describe three major trends that are reshaping where and how jobs are created: the Upside-Down Economy, the Anywhere Economy, and the Malnourished Economy. We then show how government and our public policies need to be modernized in order to take these new 21st century realities into account.
The Upside-Down Economy
It might be time to retire the term “emerging markets.” In 1992, advanced economies produced 64% of the world’s GDP, essentially two dollars in output for every one dollar produced by the emerging economies. In 2013, for the first time in history, the emerging economies produced more than the sum of the advanced economies.111*
* We use purchasing power parity adjusted data and use the IMF’s definition of advanced economies, which includes the following 34 nations: Australia, Austria, Belgium, Canada, Cyprus, the Czech Republic, Denmark, Estonia, Finland, France, Germany, Greece, Hong Kong, Iceland, Ireland, Israel, Italy, Japan, Korea, Luxembourg, Malta, Netherlands, New Zealand, Norway, Portugal, Singapore, Slovak Republic, Slovenia, Spain, Sweden, Switzerland, Taiwan, the United Kingdom, and the United States.
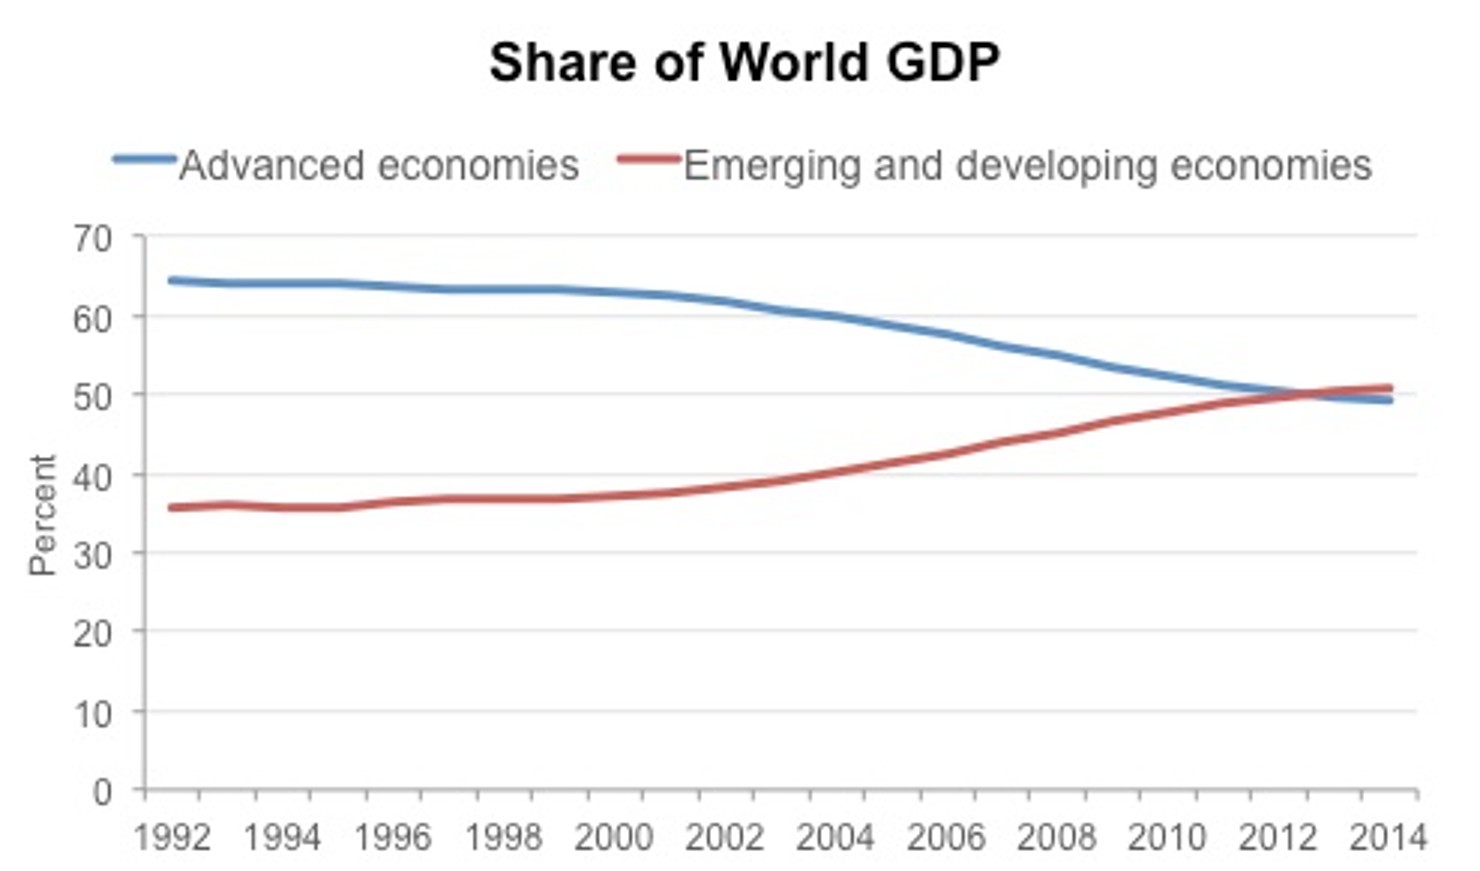
Source: International Monetary Fund.
This surge in foreign markets is best exemplified in Asia. The market size of the 15 leading East Asian economies* has grown by 261% since the turn of the century, from $1.5 trillion in 2000 to $5.4 trillion in 2014 (nominal dollars).112 Their growth rate soared to over 10% in the pre-global financial crisis era, and since then has maintained strong growth at around 7.5% in 2014. This growth has been shared among nearly all of the 15 Asian economies, save Japan—the largest advanced economy in Asia.
* The 15 East Asian economies we analyzed include: Brunei, Cambodia, China, Hong Kong, Indonesia, Japan, Laos, Malaysia, Myanmar, Philippines, Singapore, South Korea, Taiwan, Thailand, and Vietnam.
Over the same time period, the U.S. economy grew at an average annual rate of 1.9%. That is the slowest rate of growth over the longest period of time for the U.S. economy for at least a century. Future growth is expected to improve to slightly above 2%, and according to forecasters, it is estimated that the U.S. economy will grow from $17.4 trillion to $25.4 trillion over the coming 15 years, in real dollars. However, the rest of the world will expand by $53.4 trillion, from $65.6 trillion to $119 trillion, according to these same estimates.113 Thus, nearly 90% of the world’s economic growth over the next 15 years will occur outside of the United States. By 2050, the emerging economies are projected to produce twice as much as the advanced economies produce, highlighting the explosive growth that is expected from emerging economies.114
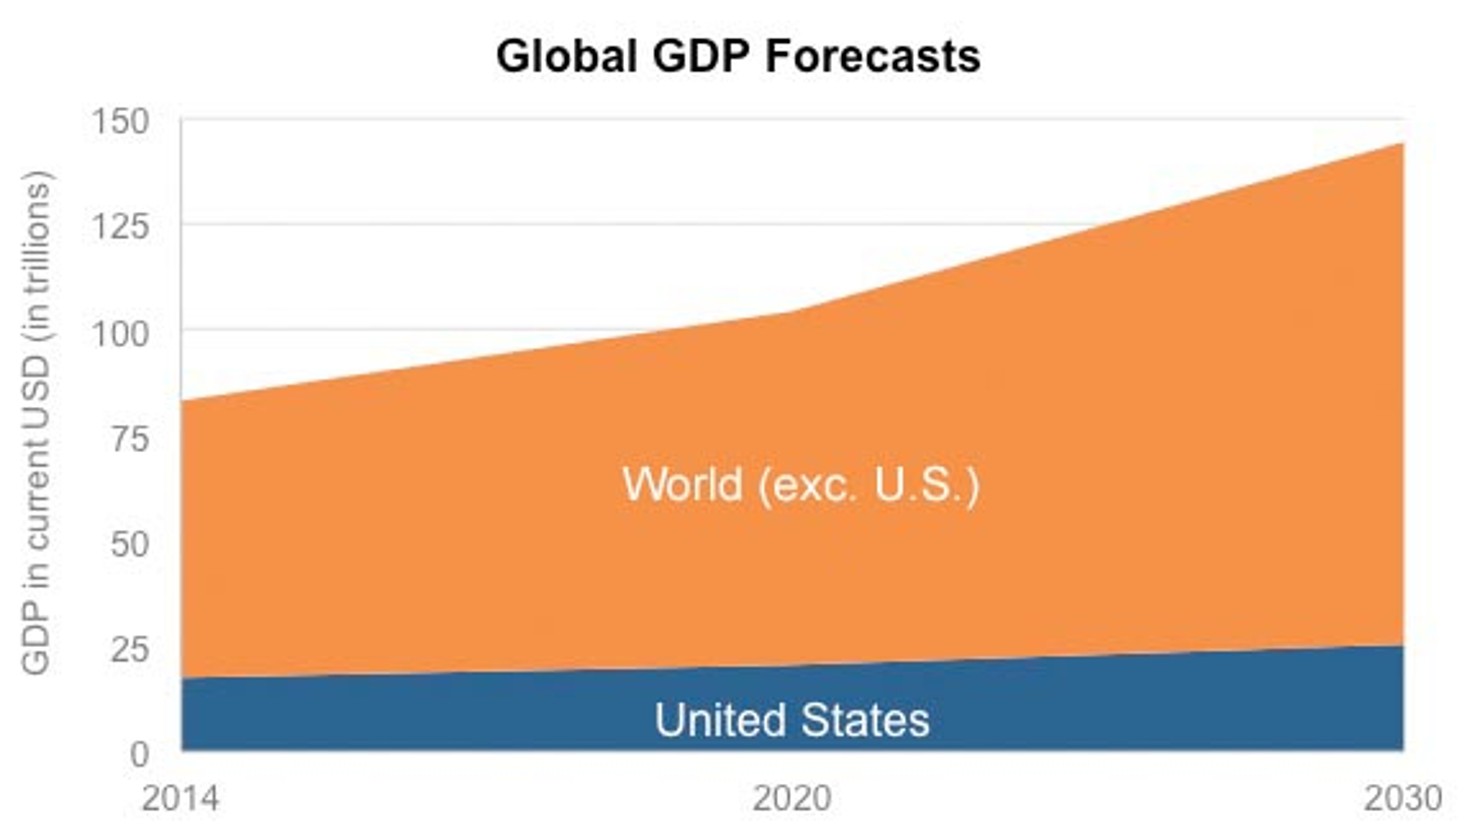
Source: 2014 data comes from the IMF World Economic Outlook database; Projections come from PwC.
It follows that the future success of America and its middle class will depend in large part on how much of what we produce here is sold and consumed outside of this country. However, our record is surprisingly poor when it comes to exports. While we export a large dollar amount because of our sheer size, relative to the weight of our economy the U.S. underperforms. Of the 40 largest economies in the world, the United States derives less of its GDP from exports than any country except Brazil.115
One result of foreign markets exploding is the creation of a burgeoning overseas middle class. President Obama has spoken of a pivot to Asia. By 2020, half of the world’s middle class consumers will be there. By 2030, the Asian middle class will include 3.2 billion—2/3 of the world’s total middle class and ten times the current population of the United States.116
Our export performance in Asia has been trending in the wrong direction. In 2000, U.S. exports accounted for over 12.3% of the Asian import market, but 14 years later, U.S. exports account for just 6.6%. That 46% American decline in market share is worse than any of the other major 24 competitors to the region, except Japan. And while the U.S. is losing ground, China’s share of exports to Asia has increased by 125%. In 2014, its exports comprised nearly 20% of the total Asian import market.117
The Anywhere Economy
Expanding global markets, combined with advances in technology, means capital is much more mobile. Gone are the days when businesses had no alternative but to locate and expand in the United States. In this new anywhere economy, businesses, their employees, and their customers can often be anywhere in the world. “And if one business seizes global opportunities and another in the same sector does not, the slow business goes the way of Radio Shack,” Jack Markell, Governor of Delaware wrote recently.118
Inversion—the corporate practice of merging with a smaller foreign company in order to change its domicile and pay lower taxes—may be vilified, but with our current tax system, it’s nonetheless rational. The practice has justifiably drawn significant attention in Washington which has been unable to reach agreement on corporate tax reform and is left decrying the exodus of American businesses to friendlier tax havens. But there is as much evidence that no one else gives a whit.
Case in point: Burger King. In 2014, they undertook the most public inversion of a known consumer product sensitive to the vagaries of public opinion with their marriage to Canada’s Tim Hortons. The merger was the subject of withering criticism and intense press scrutiny. The burger giant was even subjected to a national boycott.119 Yet in the first quarter of 2015, Burger King reported “one of its best” quarters ever, according to the company.120 Burger King sales recorded a “sharp increase” of 9.6% over the previous year. Some store sales jumped 4.6%, double what analysts had predicted.121 If inversions didn’t hurt Burger King’s sales, they probably won’t hurt other companies’ sales.
Other countries have recognized this trend and adopted reforms to attract corporate investment and business formation. Nineteen OECD countries have moved to a territorial tax system since the U.S. last reformed its code, so that 28 of the 33 non-U.S. OECD countries do not significantly tax active foreign earnings when this capital is moved back to headquarters.122
Meanwhile, the United States has not had a significant overhaul of our tax structure in 30 years. The top U.S. statutory corporate tax rate (including state corporate income tax) is 39.1%—more than 14 percentage points higher than the 2014 average (24.8%) for other OECD countries, and 10 percentage points higher than the average (29%) for the other G7 countries.123 In addition, the current U.S. system, which taxes foreign earnings on a deferred basis after they have been subject to tax overseas, all but begs companies to keep earnings abroad. It’s no surprise that, according to Bloomberg, there is $2.1 trillion in overseas profits of American corporations stored abroad.124
Ireland is now home to 700 American companies and a corporate tax rate roughly 1/3 of ours at 12.5%.125
As former Chairwoman of President Clinton’s Council of Economic Advisors Laura Tyson testified in 2015, “Our corporate tax system was designed for an economy in which U.S. multinational companies earned most of their revenues at home, international competition was relatively unimportant, and most corporate profits were produced by tangible assets, such as machinery and buildings. This is not today’s world.”126
Looking to the recent past, Economists Michael Spense and Sandile Hlatshwaya found that of the 27 million jobs the U.S. economy created between 1990 and 2007, all but a handful were jobs that could only be done in the United States because of proximity—jobs like nursing, teaching, construction, and food service. America has been losing out on what they termed “tradeable” jobs—jobs than can be completed anywhere, like manufacturing, software design, call centers, and back office functions.127
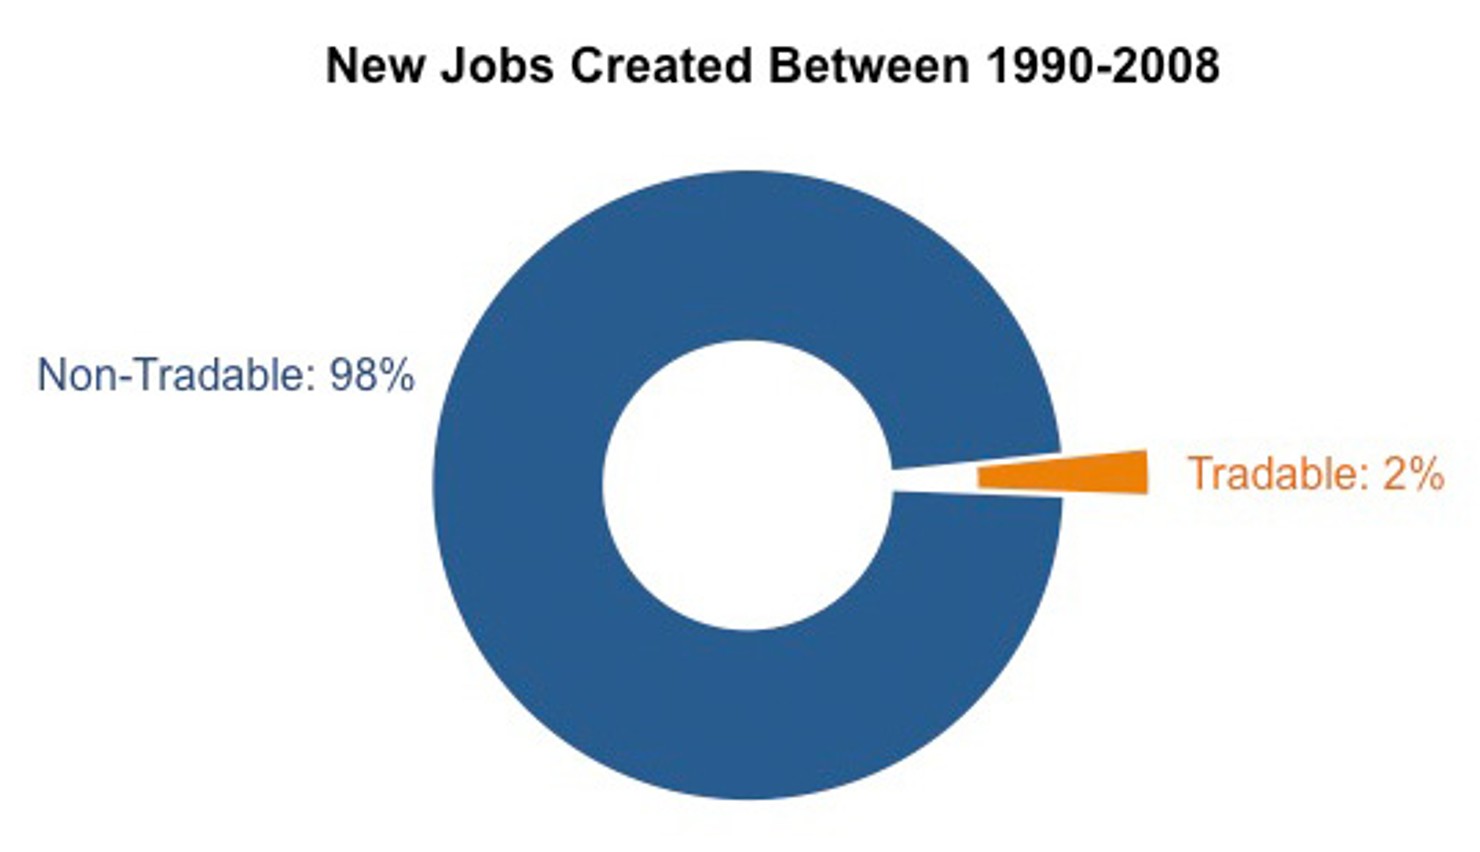
Source: Michael Spence and Sandile Hlatshwayo, “The Evolving Structure of the American Economy and the Employment Challenge,” Council on Foreign Relations, 2011.
The Malnourished Economy
For decades, two progressive priorities have been elbowing each other at the dinner table: safety net spending and public investments. The safety net has gotten the extra helpings.
In the early 1960s, the federal government spent $3 on what the Office of Management and Budget calls “public investments” for every $1 it spent on the major retirement and health care entitlement programs.128 At the time, the safety net was threadbare and needed new strands to protect vulnerable populations. Many were enacted in the 1960s and they made America a better place. But these two impulses—one to protect people, the other to grow the economy—were destined to compete for finite dollars.
Thus, by the early 1970s, the ratio was one-to-one as Medicare and Medicaid expanded the safety net. But, by 2013, the ratio reversed to $1 in investments for every $3 spent on the three major entitlement programs. In ten years, the ratio is projected to be one-to-six. This collision course of progressive priorities—due mainly to the aging of the population and continual increase in per capita health care costs—has put public investments that are crucial to helping spur private sector job creation on a starvation diet.
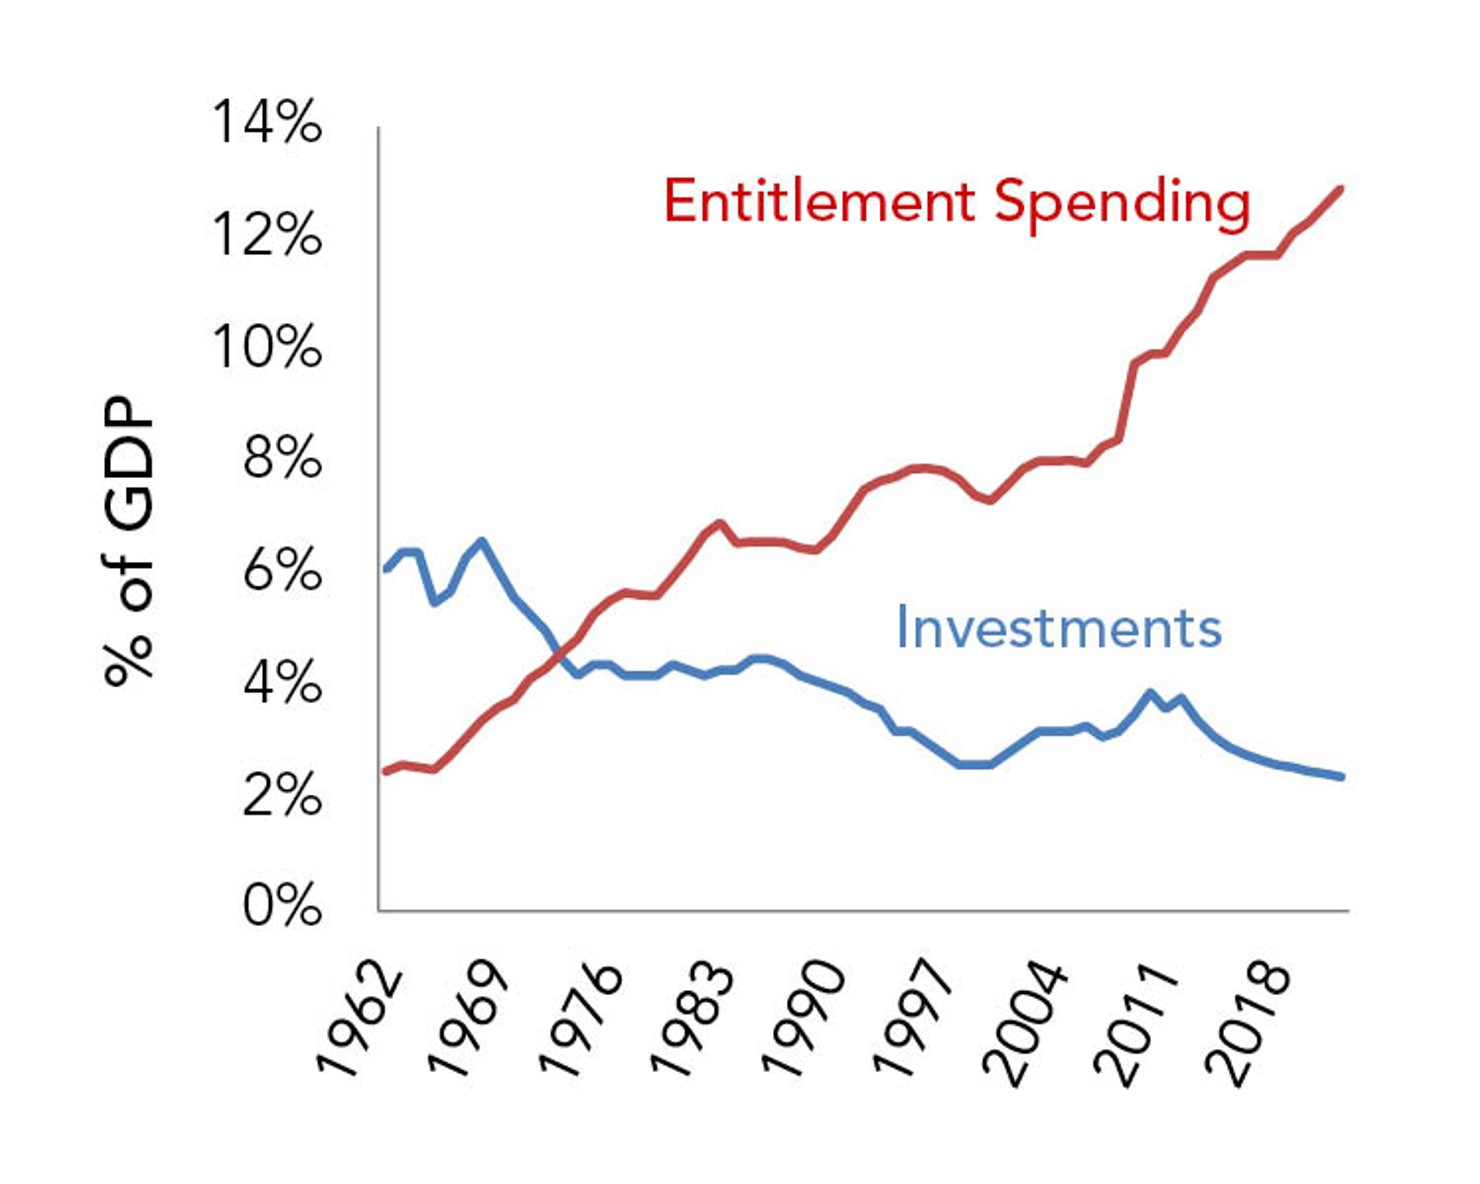
Source: Author's calculations based on U.S. Office of Management and Budget and U.S. Congressional Budget Office. For more information, read our Collision Course report.
Could we replenish investments while leaving entitlements be? It seems unlikely. First, we haven’t been able to do that in the past. For example, prior to 1980 the U.S. devoted 3% of U.S. GDP annually to spending on public infrastructure—moving people, ideas, and products faster, cheaper, and safer. But since 1980, we have spent less than 2% of GDP on infrastructure annually, resulting in a huge shortfall of needed investment. One percent might not seem like a lot, but over the last 20 years this has accumulated into a $1.7 trillion deficit in infrastructure investment.129
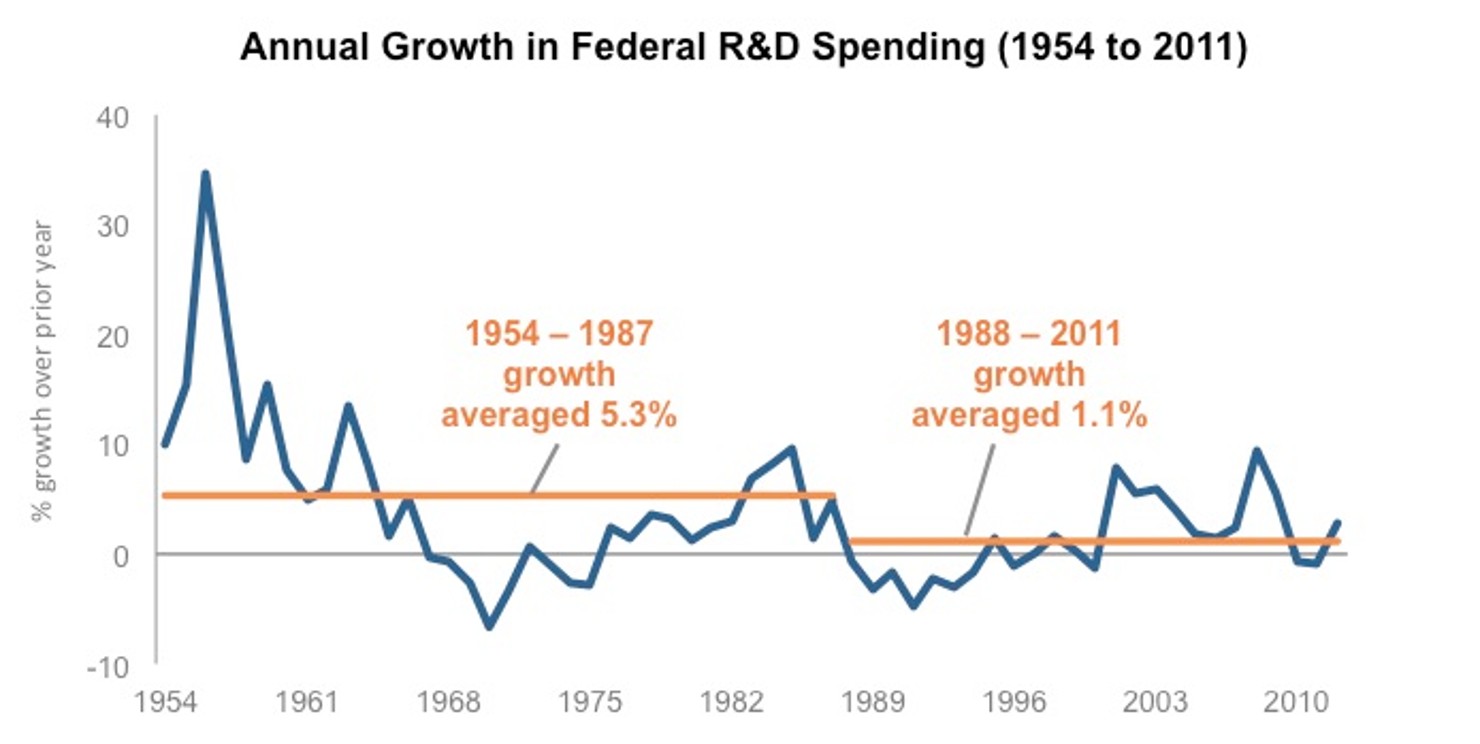
From 1953-1987, growth in federal research and development (R&D) investment was 5.3% on an average annual basis in real dollars, but from 1988-2012, growth was 1.1% per year.130 As a share of GDP, U.S. R&D basically flat-lined, inching up just 3% from 1987 to 2008, while China’s grew 110% and Korea’s 91%. Today, the United States accounts for 30% of the world’s total R&D efforts, down from 2001 where the U.S. performed 37% of total R&D. Asian R&D represents 34% of global R&D, up from 25% in 2001.131
Source: Association for the Advancement of Science.
Reason number two comes down to the tax burden voters are willing to accept. Federal spending currently makes up 20.5% of the entire economy. But, by 2040, it is projected to comprise 25.3% of the economy—almost entirely due to entitlements and health care spending.132 State and local spending take up another 17%133 and, because of public pensions and health care, these are also expected to grow. The public appetite for the massive additional taxation needed to support growth-inducing public investments would likely be low at future levels of government spending.
The National Institutes of Health (NIH) is the largest source of funding for medical research in the world and supports research personnel at over 2,500 centers across the United States.134 NIH’s investment and extensive collaboration with the private sector in R&D has led to world-renown innovations (from creation of the MRI scan to new cancer treatments), brought life-saving products to market, and fueled extensive economic activity. For example, Wisconsin-based TomoTherapy emerged from NIH-funded cancer research and created machines that changed the way doctors treat cancer tumors. Based on that NIH research, the company grew to 1,100 people, has over $400 million in yearly revenue, and manufactures every device in Wisconsin.135 But future NIH research is under attack. According to the American Association for the Advancement of Science, NIH’s R&D budget has steadily declined since Fiscal Year 2004.136
Private sector investments are also down. The corporate sector all too often grapples with what Hillary Clinton and others have termed “short termism”—the drive for immediate shareholder profits and the fear of activist investor takeovers. A survey of 1,000 corporate executives and board members by McKinsey and the Canada Pension Plan Investment Board found that 79% felt the pressure to demonstrate strong financial performance over two years or less, and 86% said longer time horizons would help corporate performance with stronger financial returns and increasing innovation.137 According to Brookings’ scholars Elaine Kamarck and Bill Galston, “A survey of CEOs and chief financial officers found that to avoid missing their own quarterly earnings estimates, 80% were willing to forgo R&D spending and 55% to delay promising long-term projects.”138 Simply put, an excessive focus on short-term results prevents investments from building competitiveness and creating long-term value.
This shift has realigned business incentives away from, notably, R&D. Private industry’s annual investment growth in R&D has averaged 1.6% since 2000, after averaging 6.2% annual investment growth through the two decades prior.139 And in the credit markets, the oxygen supply for small businesses has also decreased. Banks that in 1995 dedicated 50% of their loans to small businesses only provided 30% to them in 2012.140
Dated regulations and government bureaucracy can drastically impede innovation and entrepreneurship. Take applying for a patent. Innovators who seek patents on new products and inventions face a waiting period of more than a year and a half from the time they apply for a patent to its first review by an examiner at the U.S. Patent and Trademark Office. There is a backlog of 600,000 unexamined patent applications. The agency also has not been equipped to handle the threat posed by patent trolls that are holding innovators hostage and stripping them of critical capital. Patent trolls have surged in recent years, accounting for almost two-thirds of all patents cases in 2014.141
So where does the Democratic Party go from here?
To make the three trends work for Americans and not against them, we need to modernize our government and re-imagine regulations, the tax code, R&D investment, small business promotion, and export policy to best enable private sector job creation. Here are a series of ideas on how to do that:
1. Establish a $400 billion Strategic Investment Initiative.
We recommend a $400 billion infusion of new, and fully offset, money over ten years for federal investments—from increased R&D, to modern roads, bridges, and ports, to manufacturing and the space program—that directly creates long-term growth and private sector jobs. This new money would be over existing investment levels and discretionary spending sequestration caps. We would finance this new investment through savings in mandatory spending—specifically by reducing waste and inefficiencies in health care, none of which reduce, harm, or increase the cost of benefits (see next section for details). Within the $400 billion Strategic Investment Initiative, we recommend the following:
A Rebuild America Fund that supercharges our infrastructure network from Saratoga to San Diego, linking states, leveraging private capital, and supporting 2.1 million jobs over the next 10 years ($172 billion over 10 years).142
- Create a 21st century road and rail network through a National Infrastructure Bank ($75 billion). Just as we committed to a national network of highways in the 1950s, we need a new commitment to a modern road and rail network to move people and products faster, cheaper, and safer. Sixty-five percent of America’s major roads need work, one in four bridges require significant repair, and 45% of Americans lack access to transit.143 Upgrading our roads, bridges, and rail systems to a 21st century system would create vast amounts of short term, well-paying union jobs and long-term growth. A National Infrastructure Bank would be initially capitalized with $75 billion which, when leveraged, would provide over $1 trillion in competitive project financing.
- Transform our gateways to the skies ($40 billion). America’s 30 largest airports handled 540 million passengers in 2014.144 And, nationally, more than one-quarter of the nation’s 3.5 million flights were delayed or cancelled last year.145 We provide $40 billion to upgrade outdated facilities, increase passenger capacity, and promote aircraft innovations.146 An infusion of capital will modernize the nation’s most prominent international hubs, create new jobs, and revolutionize the way we transport people and American goods throughout the globe.
- Supersize our strategic seaports ($30 billion). The expanded Panama Canal can now handle new cargo ships that are the length of an aircraft carrier, twice the height of the Lincoln Memorial, and that carry as many as 12,000 containers—or about a million flat-screen TVs.147 But U.S. ports often aren’t deep enough to accommodate these new ships. Funding to deepen our port channels and prepare the ports with larger cranes and other improvements will allow us to tap into global supply chains and ensure more Made in the USA goods get on foreign shelves.
- i-Connect all Americans ($15 billion). Today, too many Americans are not connected to the Internet, cutting them off from educational opportunities, the online consumer marketplace, and 21st century careers. In some, mostly rural, areas, households lack access to a fixed broadband network. In other communities, often those most economically hard-pressed, many who have access to a broadband connection do not adopt the technology despite its many benefits. Our $15 billion i-Connect grant program would address both problems, serving as a separate but complementary effort to the Universal Service Fund to deploy a wide variety of broadband technologies to areas that are not currently being served, while also confronting barriers to adoption in order to connect individuals and drive local economic growth.
- Invest in a Grid of the Future ($5 billion). New types of power generation, more customers, physical and cyber threats ranging from climate change to terrorism, and new technologies—from distributed generation to smart meters—require a vastly modernized grid system. We call for $3.5 billion to help states and utilities develop technology to upgrade the grid and enhance security as well as $1.5 billion in competitive funding for states to coordinate around energy reliability, affordability, energy efficiency, lower carbon generation, and environmental protection.
- Modernize natural gas transmission and distribution pipelines ($7 billion). We add $7 billion to assist utilities with pipeline replacement costs and technology deployment to enhance grid reliability, safety, and regulatory compliance. These modernization efforts not only generate environmental benefits by reducing fugitive emissions, they also help industry capture more product and create more jobs.
Inspire Grants to return to America’s innovation glory days ($84 billion over 10 years).
- Restore NSF funding to historic levels ($10 billion). The National Science Foundation provides a fifth of all federal research spending148 and is a key investment America makes towards the future. But over the past two years, sequestration has taken a devastating $500 million bite out of NSF’s already modest budget. We call for $10 billion in new NSF funding to restore mindless sequestration cuts, bring funding to historical highs, account for inflation, and fund the breakthrough research that will lead to a cornucopia of yet imagined ideas.
- Strengthen entrepreneurship with the construction of Maker Spaces in 1,000 community colleges ($2 billion). “Maker Spaces” are shared spaces equipped with D.I.Y. manufacturing equipment—such as 3-D printing presses and computer-aided design software—and staffed by experts, where people can go to transform ideas into reality. Grants of $2 million would be made available for up to 1,000 community colleges to refurbish spaces, purchase equipment, and train staff in operating the equipment. The spaces would be open to students and entrepreneurs in the community, providing them an opportunity to learn advanced manufacturing skills and expand their innovation productivity.
- Inject new funds into NASA ($20 billion). We are living off the past with one of America’s greatest jewels: NASA. We landed on the moon in 1969. We explored Pluto just months ago—but the launch was decades past. NASA doesn’t just enhance our knowledge of the universe, it inspires generations of future scientists and inventors and contributes to technologies that create entirely new markets.149 When we landed on the moon, NASA’s budget was $27.5 billion in today’s dollars. Today, it stands at $18 billion.150 We add $20 billion to bring NASA closer to its heyday and to inspire science and exploration. As in the past, NASA funding will create new economic growth that benefits everyone.
- Jumpstart affordable, reliable, emissions-free energy ($12 billion). The world needs more affordable, reliable, and clean electricity to tackle the twin challenges of climate change and growing demand for energy. We add $12 billion for the government to work with the private sector to develop and deploy carbon capture and sequestration and advanced nuclear. These funds may save the planet and will certainly create jobs and new research that leads to new businesses.
- Lead on cures ($40 billion). One of the drivers of America’s economy is medical, pharmacological, and bio-medical research. The National Institutes of Health’s budget has steadily declined since 2004.151 We restore funding to past historic levels and recommit to the eradication of life-threatening diseases and driving medical innovation. This funding would be on top of any additional resources provided to the NIH budget through the 21st Century Cures Act.
A Make It in America Manufacturing Agenda ($20 billion over 10 years).
- Race to the Shop grants ($10 billion). Every new manufacturing job adds another 1.6 jobs to the local service economy; for every dollar in manufacturing sales, another $1.34 is added to the economy. We call for the enactment and funding of a series of initiatives led by Rep. Steny Hoyer (D-MD) and Senators Chris Coons (D-DE) and Tammy Baldwin (D-WI) to usher in a manufacturing renaissance. These manufacturing initiatives include increased funds for training between community colleges and businesses, reforms in workforce education and skill training for advanced manufacturing, and new resources (such as low-interest loans) to build new facilities, upgrade equipment, and connect innovative small suppliers with larger companies.152
- Create 1 million new apprentices ($5 billion). The German economy boasts as one of its most successful features an apprenticeship system that trains 1.5 million workers each year.153 As the Center for American Progress and others have written, apprenticeship programs are vastly underutilized in the United States but have begun to show promise in select states that have prioritized their expansion, including Delaware and South Carolina. Robert Lerman of the Urban Institute proposes a marginal tax credit, which would give employers a tax credit—we propose $5,000—for each new apprenticeship a business offers over the previous year’s level.154
- Boost patent resources ($5 billion). The U.S. Patent Office has a backlog of over half a million new patent applications.155 This backlog stems from overloaded patent examiners. From the time of application to the first action, patent holders are waiting a year and half to hear back on their applications.156 Every 1,000 new examiners reduces the backlog by 23%, so we call for 4,000 new examiners to ensure that ideas don’t gather dust in a federal bureaucracy.157
2. Increase U.S. annual exports by $1 trillion by 2025.
We need to tap into the exploding growth of foreign markets to ensure they buy more Made in the USA goods and services. Here’s how:
- Pass trade deals so we make it here and sell it there. There is no path to seizing exports without aggressive, high-standard trade agreements that level the playing field. Our last 17 trade deals (all post-NAFTA) cleared that bar and improved the U.S. balance of trade in the goods sector alone by more than $30 billion on an average annual basis. Exports of goods to those countries jumped 52%, double the rate of goods imports.158 And these figures do not include the lucrative service sector economy where the U.S. is already king. This success is because modern trade deals are better and of higher standards than the past. The U.S. Congress is about to consider the Trans-Pacific Partnership (TPP) trade deal with 11 other economies in a region that represents nearly 40% of global GDP. We are also negotiating the Transatlantic Trade and Investment Partnership (TTIP) which has the opportunity to strengthen our already strong trading relationship with the countries of the European Union. We need to conclude and pass these deals in order to ensure that more Made in the USA products can land on foreign shelves and that we are setting modern, high-standard rules for the globe to ensure that American companies can fairly compete.
- Add 200,000 new exporting businesses by 2025. According to the Census Bureau, 302,000 known businesses* accounted for nearly all U.S. exports in 2011.159 This is out of a total of more than 20 million American businesses.160 200,000 new exporting businesses would add more than $300 billion in new exports for the U.S. each year, even if every one of the businesses was of small or medium size (fewer than 500 employees).161 While there are some promising initiatives, such as the Small Business Administration’s (SBA) State Trade and Export Promotion (STEP) Pilot Program—which makes matching fund awards to states to assist small businesses with exports—more needs to be done. We recommend establishing a full-scale dedicated small and medium exporter (SME) service within the Commerce Department’s U.S. Commercial Service to help SMEs find new markets, understand and navigate foreign customs regulations and standards, and comply with foreign tax systems. This office would have the explicit goal of increasing the number of U.S. small and medium businesses that export. Smaller exporters say that a large challenge to reaching foreign markets is customs regulations and restrictions that are difficult and expensive to navigate.162 A dedicated SME team can assist smaller businesses in understanding what expansion potential exists in growing international markets and provide further assistance through Gold Key Matching Services,163 through which they can have access to personalized client services such as product/service launch assistance, regulatory and technical assistance, and reduction of market access barriers.
*These businesses accounted for $1.3 trillion in exports in 2011, representing 89.2% of total U.S. exports for that year. The businesses that encompass the remaining 10.8% of exports were not known to the Census Bureau at the time of the report.
- Clear-cut the bureaucratic export jungle. U.S. exporters face a confusing tangle of overlapping export support services among the Commerce Department, Small Business Administration, Export-Import Bank, the Department of Agriculture, and the Overseas Private Investment Corporation. In addition to preserving the Export-Import Bank, these services need to be brought under the oversight and management of a single agency that would serve as a one-stop shop for businesses looking for export support. The Obama Administration has included a proposal to reorganize and streamline federal services for exporters in their 2016 budget request.164 Bringing the scattered services of the various agencies under a single umbrella will maximize the efficient deployment of resources and provide businesses with clear points of contact to help meet their export promotion goals.
3. Unleash the full potential of women in our economy.
To reduce the wage gap and increase job opportunities and earnings for women (as discussed more in the next section), we recommend:
- Give new parents a 12-month “phased leave” work option. The Family and Medical Leave Act entitles many employees to take job-protected leave for the birth of a child. But after that time is up, some new parents may not want to jump right back into full-time work, even though they do want to continue earning and keep their career going. We suggest using the federal workforce to pilot a new “phased leave” option. Under this policy, new parents would be eligible for half-time work for 12 months after exhausting their FMLA leave and following their return to work from the birth or adoption of a child.
- Ease the financial burden of raising young children. In 2013, the average cost of full-time care for an infant at a child care center was about $10,000 per year.165 Senator Kirsten Gillibrand (D-NY) has introduced a comprehensive plan to make child care more available and more affordable, including doubling the Dependent and Child Care Tax Credit from $3,000 to $6,000, providing employers with a tax deduction worth 35% of the cost of creating on-site child care facilities (up from 25%), allowing employers to deduct 20% of child care resources (up from 10%), and bringing new trained professionals into the child care workforce with a new tax credit of $2,000 a year for any college graduate who specializes in child care and works at least 1,200 hours a year in a child care facility.166
- Provide women-owned businesses a lifeline to capital. Male entrepreneurs are more than three times as likely as female entrepreneurs to access equity financing through angel investors or venture capital firms (14.4% versus 3.6%).167 Men start firms with nearly twice the capital that women do.168 We expand the Small Business Administration’s Intermediary Lending Pilot Program with a mission to seek out new women business owners. This program complements traditional bank loans by partnering with local economic development agencies to provide supplemental low-cost loans up to $200,000.169 Senator Maria Cantwell (D-WA) has called for expanding and making the program permanent to help direct much-needed seed funding to women and others in her Women’s Small Business Ownership Act of 2014. We also increase the budget for Small Business Administration loans under $10,000 and allow the organizations receiving these to increase spending on technical assistance, as recommended in the Microloan Modernization Act of 2015, introduced by Rep. Seth Moulton (D-MA) and Sen. Deb Fischer (R-NE).
4. Modernize the tax code for the Anywhere Economy.
Comprehensive tax reform that lowers tax rates, broadens the base, eliminates loopholes, and makes the United States more attractive for businesses to locate and expand within our borders is desperately needed. For multinationals, the U.S. should adopt reforms that are more in line with the international tax system of other developed countries and reduce the considerable incentive that currently exists to keep earnings offshore. There are myriad proposals to bring the statutory rate down to a range of 25% to 28% in a revenue neutral fashion, but the goal of tax reform should be far more than just hitting a pre-determined rate—we need to ensure that our code makes us more competitive and allows us to have broad-based growth going forward.
5. Create a Mobility Fund to bring jobs to low-income areas.
We leverage $80 billion in public money to attract over $700 billion in private capital to remake low-income areas with sustainable jobs, businesses, housing, and opportunities. To pay for this public investment, we trade capital gains for capital investment by increasing the top capital gains rate from 20% to 25% for those with higher incomes, which would cover the full cost of new federal investments in economically distressed communities.170 There is substantial economic mobility within the middle three income quintiles but stickiness at the bottom; those born poor have a 70% likelihood of being poor or near-poor as adults.171 There are also regions of the country where economic progress is non-existent to backwards. In order to bring significant capital into these regions, we establish a Mobility Fund which would:
- Leverage $60 billion in a Race to the Job initiative. A Race to the Job initiative would link an ambitious public funding commitment to a competition among low-income areas across the United States. The Mobility Fund would commit to investing $6 billion a year over the next decade in areas of the country that developed the most ambitious and innovative partnerships to bring jobs and growth to their region. This would be a huge inducement for mayors, governors, unions, community organizations, and private industry to come together with bold strategies and plans to attract industry and jobs as well as prepare these cities for growth.
Once the most ambitious and innovative plans are selected, funding would be delivered through Community Development Financial Institutions (CDFI) which are privately-run banks that leverage private sector capital to invest in the development of community facilities, commercial facilities, business loans, and affordable housing in low-income areas. CDFIs also provide banking services—such as checking accounts, mortgages, small business loans, microloans, financial literacy coaching, and entrepreneurial training—to low-income people. CDFIs leverage money from the U.S. Treasury to attract private capital from pension funds, foundations, and individuals at a leverage ratio of better than ten-to-one.172 - Renew and expand the New Markets Tax Credit ($20 billion). We also renew and triple the funding for the New Markets Tax Credit (NMTC)—a bipartisan and successful anti-poverty initiative that began in 2000 and expired in 2014. Under the program, investors receive a credit valued at 39% of money they invest in projects in low-income communities. This money is then leveraged dollar-for-dollar by community development entities in order to make improvements in communities, ranging from a small business loan to start-up funding for a new charter school.
Between 2003 and 2013, the New Markets Tax Credit was responsible for $70 billion in total investments.173 According to the Office of the Comptroller of the Currency, demand for the credits outstripped supply by seven to one.174 Over the next 10 years, we would allocate $100 billion for NMTC investments which, when leveraged dollar-for-dollar, will drive $200 billion in capital towards communities that need it the most. The budgetary cost of this would be $20 billion.175 Senators Roy Blunt (R-MO), Charles Schumer (D-NY), Steve Daines (R-MT), and Ben Cardin (D-MD) along with Reps. Pat Tiberi (R-OH) and Richard Neal (D-MA) have introduced legislation that would permanently authorize the New Market Tax Credit.176
6. Provide a springboard for new businesses.
Entrepreneurship is a part of the American DNA. But, as noted above, the number of new businesses has been declining steadily for over three decades. More than one out of three small businesses in 2013 said that they could not get the financing they needed,177 and while large business loans have returned to pre-recession levels, small business loans have yet to fully rebound and have been declining since 2008.178 To help entrepreneurs start new businesses and make investments in employees, R&D, and products, we recommend:
- Toss out the bureaucratic maze. Just as U.S. exporters face overlapping export support services (as mentioned above), entrepreneurs face a similar maze when it comes to help starting a new business. The Government Accountability Office (GAO) found that federal efforts to support entrepreneurs are fragmented. There are 52 different programs spread across four different agencies totaling $2 billion.179 Every single program has some overlap with another, and entrepreneurs struggle to navigate the thicket. These programs need to be brought under one roof, and the head of that agency should be given the authority to move money from low-performing entrepreneurship programs to those that are getting the job done well.
- Refresh R&D resources for new businesses. The R&D tax credit must be made permanent and reformed to allow new, pre-revenue businesses to take advantage of this incentive. The Innovators Job Creation Act offered by Senators Pat Roberts (R-KS), Chris Coons (D-DE), and Chuck Schumer (D-NY) allows the credit to be taken against payroll tax obligations for small businesses to spur more R&D from small innovators and pre-revenue firms. Another solution would be to make the research credit tradable to allow startups and pre-revenue firms to sell their tax credit to a company that is able to use the credit. Finally, we suggest a "bonus" R&D credit for firms that that both conduct research and manufacture in the U.S.
- Simplify tax compliance for small businesses. Small businesses are required to estimate their revenue every quarter and send a tax payment to the IRS. If estimates are significantly understated, the IRS can penalize the company upwards of $1,000. Breaking down tax payments into smaller, quarterly installments makes sense when revenue flows are predictable, which is usually the case for large or mature businesses. But small businesses have unpredictable cash flows. We support a proposal by Anne Kim, of Republic 3.0, to exempt businesses with less than $1 million in total revenue from having to pay quarterly taxes based off of estimates; instead allow them to file their taxes once yearly.180
7. Double SEC enforcement.
The capital markets have grown exponentially in size and complexity, while enforcement resources have remained static. Similar to proposals put forth by Senator Charles Schumer (D-NY) and former Governor Martin O’Malley (D-MD), we double the enforcement personnel at the Securities and Exchange Commission (SEC), double the pay of investigators to attract top talent,181 and move the SEC from Washington to New York City to improve the agency’s ability to hire top professionals as well as be closer to the action.182
8. Clean out the regulatory closet.
We can dramatically streamline regulations while still protecting Americans. Congress should enable agencies to undertake wide-scale, transparent regulatory reviews with the input of private sector experts and with an initial focus on boosting innovative areas of our economy. The Information Technology & Innovation Foundation (ITIF) has suggested a number of ways to do this, including inter-agency regulatory review councils that guide reform of particular traded sector industries.183 The Progressive Policy Institute (PPI) has suggested a commission based on the effective military base closure process. Under this proposal, the commission would review outdated regulations submitted by the public and stakeholders, and then submit a package for consolidation or repeal to Congress for an up-or-down vote.184
9. Bring the Copyright Office into the Digital Age.
The core copyright industries—those primarily engaged in creating, producing, distributing, and exhibiting copyrighted works—now contribute more than $1 trillion to the country’s GDP.185 But the Copyright Office, the government agency responsible for serving the cultural marketplace, resides within the Library of Congress and competes with many other important Library priorities, often to its detriment. The GAO has identified numerous technical and organizational challenges within the Library and the Copyright Office, from antiquated registration and record systems to the integrity of the files stored on government servers.186 In response to these challenges, Reps. Tom Marino (R-PA) and Judy Chu (D-CA) have introduced a discussion draft, the Copyright Office for the Digital Economy Act, that would modernize the office by moving it out of the Library of Congress.187 This would grant the Office the autonomy it needs to encourage creativity, innovation, investment, and jobs.
Boost savings and wages in the unstable career era
When Pepsi Co. started giving gold watches to retirees in the 1940s, it was to honor those who had dedicated their career to the company.188 It was a two-way bargain. The company got a stable and loyal workforce; the employee acquired the skills on the job to rise up within its ranks. Along with this long-term employment came the other half of the economic bargain—non-wage benefits that helped provide security throughout one’s life.
In the stable career era, many workers received not only health care coverage but a generous retirement benefit and regular raises from their employer. These non-wage benefits were so cheap that they were almost an afterthought in terms of the price of compensation. The cost of health insurance made up only 1% of typical worker compensation and 14% of total benefits in 1960 and 2% of total compensation and 22% of total benefits in 1970.189 The workforce was much younger (with a virtuous ratio of new workers entering the prime age of working life as small numbers retired), so it took only a modest investment to fund a decent private pension that could supplement Social Security. And, of course, wages were on a solid trajectory as the U.S. economy averaged annual growth rates in excess of 3.5% from 1950 to 2000.
If policymakers are to effectively address the third pillar of long-term shared prosperity—increasing savings—they need to fully embrace the reality that we are no longer in a stable career era. In the past, an entry level job in the mailroom could lead to a gradual climb to management. Today, there is no mailroom. Instead, people hopscotch from job to job because the ladder up often means moving out of one job and into a new one. Instead of health care and retirement being managed by the employer, these two benefits (as well as worker training) are increasingly self-managed by the employee. And non-wage benefits are very expensive to the point that they eat directly into take-home pay.
Below, we describe four major trends that are reshaping the workplace and compensation: the Hopscotch Workforce, the Nickel-and-Dimed Workforce, the Asset-Starved Workforce, and the D.I.Y Workforce. We then show how government and our public policies need to be modernized in order to take these new 21st century realities into account.
The Hopscotch Workforce
In 1973, one in three male private sector workers aged between 45 and 64 had spent at least 20 years with the same company. By 2006, it was just one in five.190 Even with the recession enticing people to stay in their current job, the average worker now spends just 4.4 years with the same firm, and will work at 11 companies throughout the course of his or her career.191 Short tenures cry out for fully portable benefits, minimal vesting requirements, and continuous and easy access to skills training.
Rare is it to find someone who has a career with the same company for a lifetime, much less the same career for a lifetime.
— 47 year old female focus group participant, July 2015192
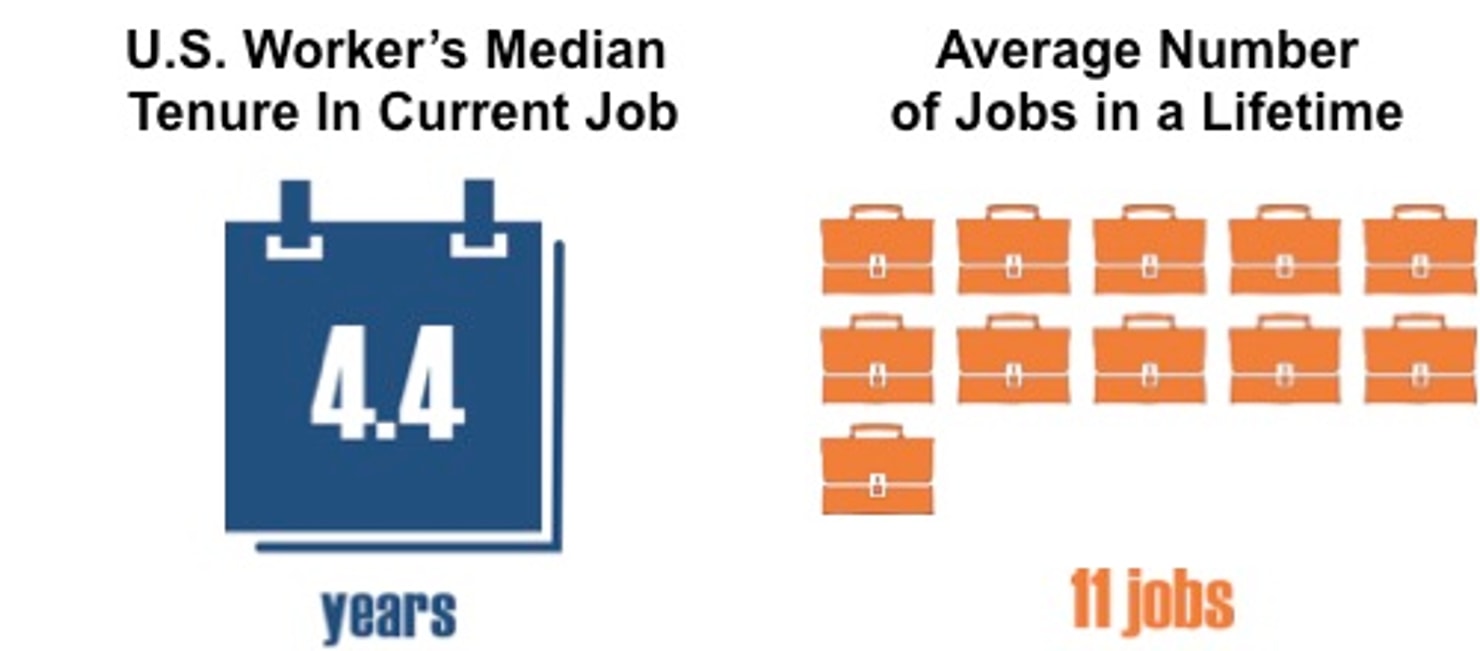
Source: Fast Company: http://www.fastcompany.com/1802731/four-year-career.
Within this transience, more employees are also striking out on their own in order to cobble together a career. The self-employed workforce jumped by 1.3 million to 10.6 million between 2001 and 2012, according to Economic Modeling Specialists International.193 Other estimates put the number of full-time self-employed people at 17.9 million in 2014, with an additional 12.1 million who take on independent side work to augment their income.194 The GAO pegged the contingent workforce (which in its definition encompasses everything from on-call workers, day laborers, and temp workers to part-time and contract workers) at 42.6 million workers in 2006.195 And by 2020 it is projected to reach 60 million workers, according to a study by the high tech company Intuit.196 The independent workforce strives for basic worker protections, like unemployment insurance that covers dry spells, a retirement savings vehicle that accrues regularly and stays with the worker, and reliable and affordable health care coverage through different jobs and periods of non-work.
The Nickel-and-Dimed Workforce
The flattening of median wages is oft discussed, but from the employer perspective, the cost of employee compensation has risen appreciably. In 1986, the average total cost to employ a worker in the private sector averaged $28.81 per hour (in 2015 dollars).197 Today, the average total cost is $31.39 per hour—an increase of 9%.198 Over the course of a year, this is an increase from $60,126 to $65,510, in constant dollars. This would seem to be good news and an example of rising wages and productivity. But very little of this increase has gone into take home pay.
In 1986, benefits averaged $7.81/hour199—that’s $16,258 per year, per employee in non-wage compensation. Today, benefits have jumped to $9.56/hour per year, per employee,200 which comes to $19,952 per year—or $3,652 more than in 1986. Of the $5,384 increase in the cost of employing a typical person between 1986 and today, 68% appears invisible to workers as it goes towards non-wage benefits that, from the employee perspective, are stingier than benefits in the past. Their pensions aren’t better today, and their health care now comes with higher premiums and deductibles.
Health care costs are the main culprit of the rise in non-wage compensation, increasing from 5.9% of compensation to 8.4% in just the last 15 years alone.201 The Affordable Care Act (ACA) appears to have made some modest reductions in health care costs, but not nearly enough. Estimates show that spending on health care grew 5.5% in 2014.202 That is over twice the rate of national wage increases and over three times the rate of inflation in 2014, which stood at 1.6%. And health spending growth is projected to average 5.8% over the next decade—peaking at 6.3% in 2020.203 That is 24% faster than projected economic growth.
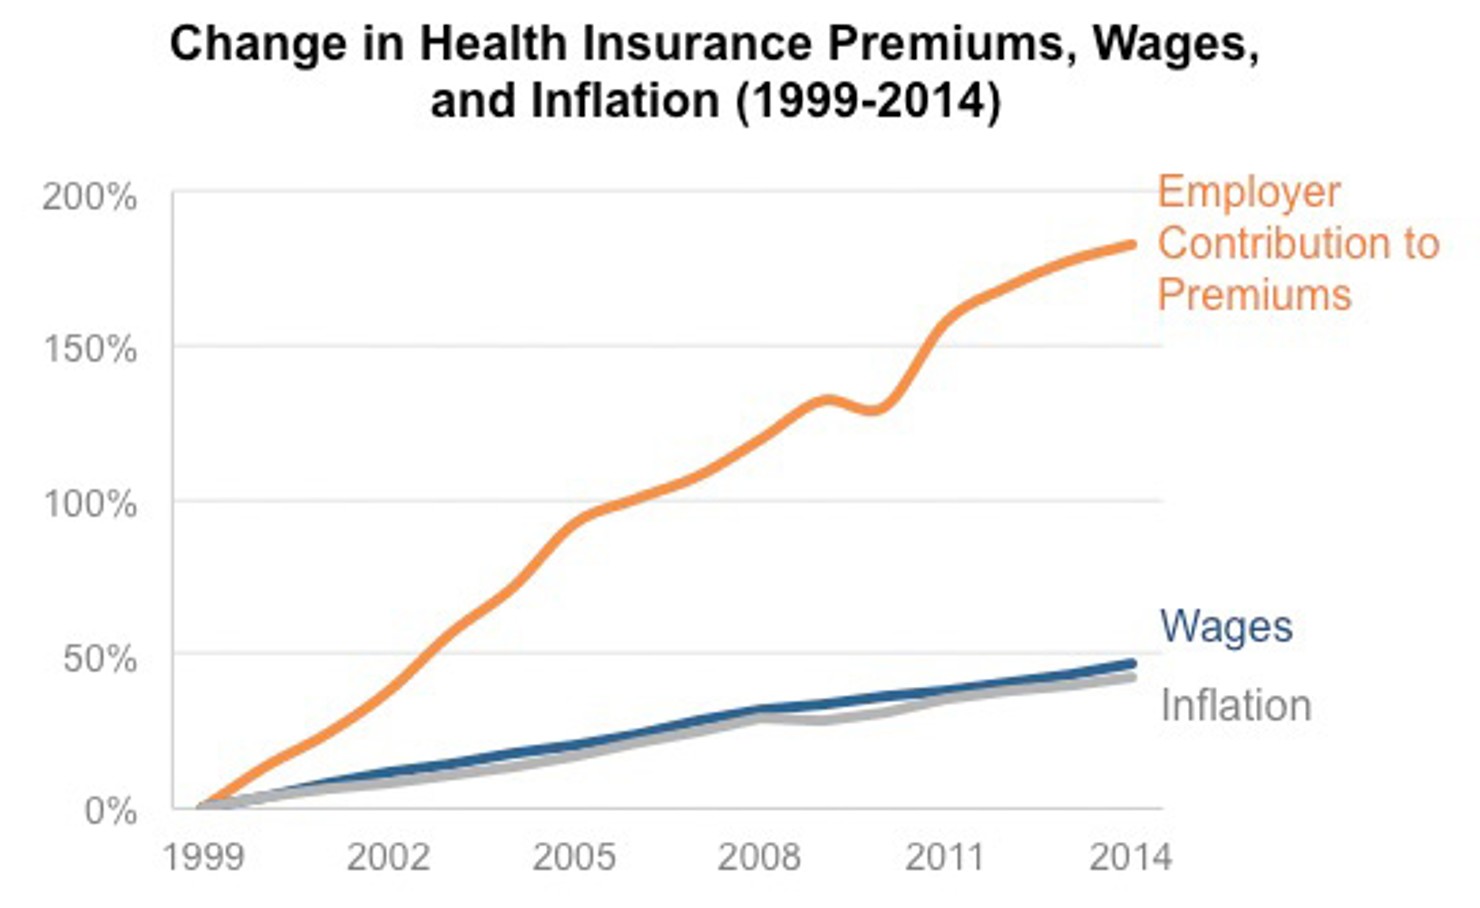
Source: Kauffman Family Foundation, Bureau of Labor Statistics.
As a teacher, I don't make a fantastic salary, but bringing home less due to health care is a real killer.
— 46 year old female focus group participant, July 2015204
Low-income workers are disproportionately squeezed by these growing costs, which depress wages and exacerbate income inequality. The Kaiser Family Foundation found that since 1999, employer contributions to health insurance premiums have increased by 166% (nominal dollars).205 And according to Mark Warshawsky and Andrew Biggs of the American Enterprise Institute, workers earning $30,000 today have given up a 26% pay increase since 1999 due to rising employer health care costs.206 The squeezed workforce needs more compensation that they can see and feel.
For each of the past 25 years, more young women have completed college or grad school than young men.207 Today, for every four women who earn a BA or better, only three men do so.208 Since education is the key to earnings, women should be dominating the economy. But they aren’t, and Dr. Michelle J. Budig of University of Massachusetts-Amherst found that the wage gap for women begins at birth—the birth of a child for a working woman. According to Budig’s analysis, young single women earn 96-cents compared to every dollar similarly situated young single men earn.209 But, according to Budig, the gap widens to 83-cents for single moms and 78-cents for married moms.210 Budig even found that the mere fact of having a child results in a fatherhood “bonus” from employers, while mothers often see a wage “penalty.” This penalty was particularly steep at lower wage jobs.211 There is a valley of economic distress that women—the most educated, and therefore most talented people in the workforce—go through upon having a child and needs to be addressed in the new economy.
The Asset-Starved Workforce
Since 1975, the returns on capital have out-stripped the returns on labor, not just here in the U.S. but globally.212 What is striking is how, in the aggregate, the makeup of Americans’ incomes have changed over the years. In 1991, 92% of national income was derived from wages and just 5% from capital gains. Fifteen years later, wages made up 77% of income with the share coming from capital gains tripling to 15%.213 By 2012, according to the Internal Revenue Service, wages equaled just 68% of total income.214 This is what happens when gains in the global economy translates into rising asset prices that dwarf very modest increases in wages.
This change is most advantageous for the wealthy. In 2012, capital gains and dividends made up 12% of national income.215 But among those earning more than $1 million in 2012, 48% of their income was derived from capital gains and dividends and only 28% from salary.216 Among those earning between $50,000 and $75,000 in 2012, just 2% of their income was derived from capital gains and dividends and 76% from salary and wages.217 In a separate section of this paper we address capital gains rates, but the asset-starved middle-class workforce deserves to claim a piece of global economic growth, to share in the gains of capital, and to not have to rely solely on their labor for wealth.
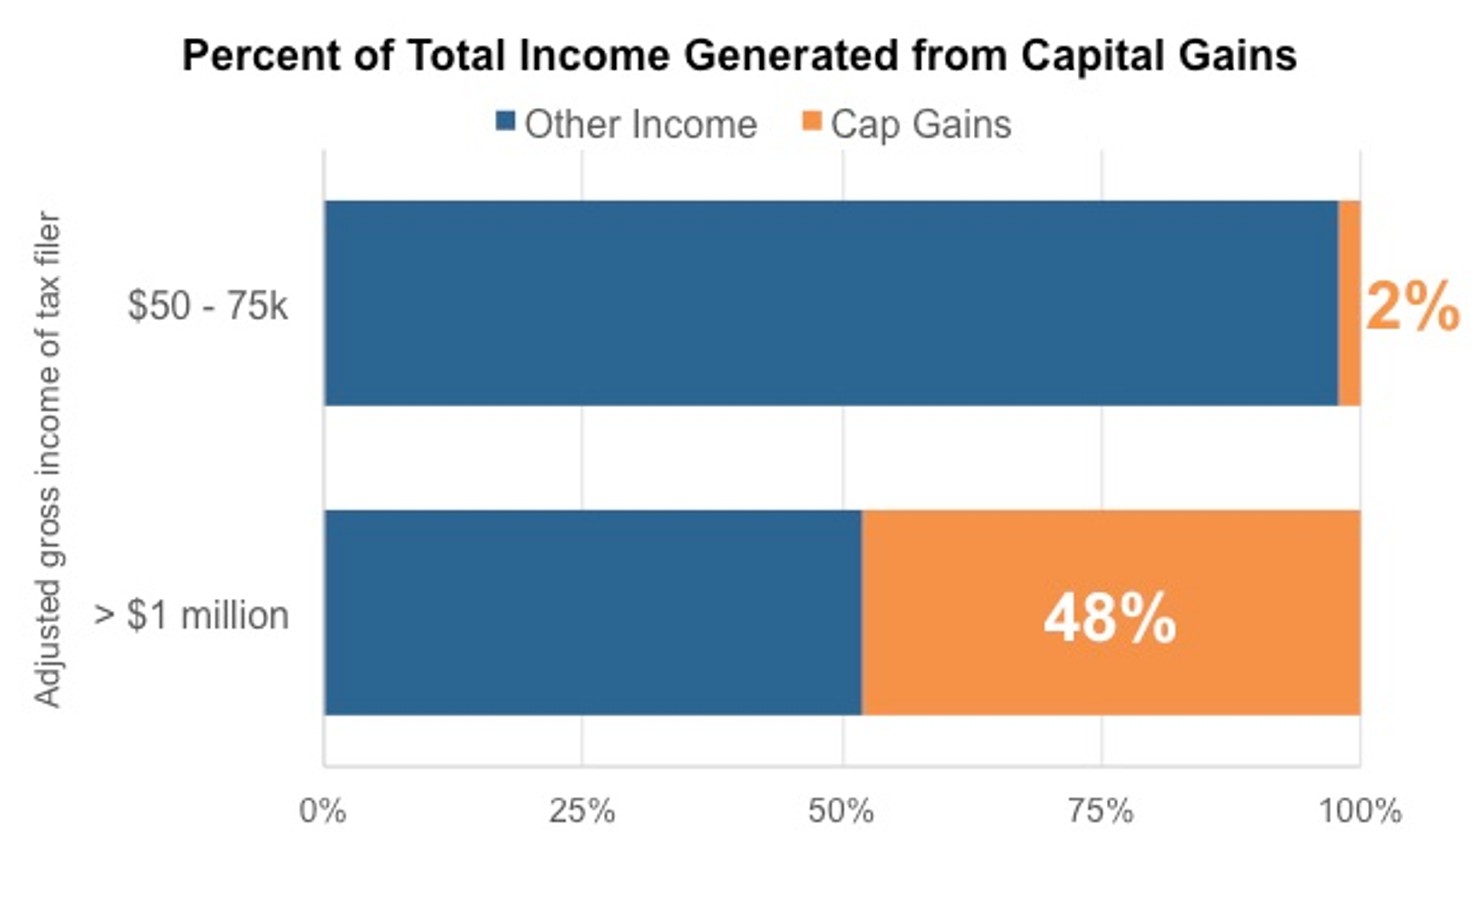
Source: U.S. Treasury Department.
The D.I.Y. Workforce
This is the era of the self-directed workforce. Employers are responding to increased globalization, competition, and the changing nature of the workforce by off-loading the management of non-wage benefits to employees. The ACA is certain to lead to more self-managing of health care among the employed. Even before its effects were fully felt, the number of individuals with employer-based health insurance fell from 69.3% in 2000 to 58.5% in 2012.218
Beyond health care, the defined benefit pension plan is becoming extinct in the private sector. In the early 1990s, 35% of private sector workers still participated in a defined benefit plan. In 2011, it was 18%.219 The defined contribution plan can be very beneficial, but it is self-directed and self-selected. Proposals to change enrollment from opt-in to opt-out have helped increase participation, but they haven’t come close to bridging the savings gap and completely preparing workers for retirement. Last year, the Federal Reserve found that 31% of non-retired adults had no private retirement savings or pensions whatsoever—including 19% of those between ages 55 and 64.220 A recent Georgetown study found that, even among those at the top third of the earnings distribution, only 61% had an employer-provided retirement plan, while less than half (46%) of those in the middle third of earnings were offered retirement plans, and only a quarter of those in the bottom third of earnings.221
It is difficult enough to make a living today, let alone think about a retirement savings.
— 57 year old female focus group participant, July 2015222
Likewise, acquiring skills to earn a promotion or leave for a better job has become increasingly self-directed, as employers are investing less in training than in the past. Between the years 1996 and 2008, the percentage of workers receiving training paid for by their employer decreased from 19.4% to 11.2%.223 While there have been some notable exceptions—from UTC’s Employer Scholar program which pays for tuition and books so employees can get degrees in any field, to the Starbucks College Achievement Plan’s scholarships to Arizona State University—the impacts of an overall drop in employer provided training has critical implications for future professional viability. As discussed earlier in this report, during the recession, Michigan launched No Worker Left Behind, an initiative to train 100,000 workers between 2007 and 2010—Michiganders flocked to the program, but one in three working-age adults were deficient in basic skills, and a stunning 44% of all Michigan adults read below a sixth-grade level.224 With workplace training on the wane and an adult workforce with atrophied academic skills, the middle-aged and older worker increasingly struggles in this economy.
The D.I.Y. workforce seeks affordable health care coverage, a pension system that guarantees that a lifetime of work leads to a comfortable retirement, and an adult education sector that gives them the power and convenience to upgrade their skills while they are employed.
So where does the Democratic Party go from here?
To make these trends work for Americans and not against them, we need to boost savings, giving job-hopping, sharing-economy Americans a better shot at financial security. Here are a series of ideas on how to do that:
1. A minimum pension that closes the wealth gap.
We have a minimum wage; we recommend a minimum pension employer contribution of 50¢ an hour on top of wages into an individually-owned, private-sector managed, fully portable, low-fee IRA. Employers who already provide sufficient defined benefit plans, IRAs, or 401K’s would be exempt. Contributions would automatically be placed in a life-cycle fund, though individuals could redirect their investments. Virtually all workers at all ages would benefit from the minimum pension plan. Using the power of the capital markets to decrease wealth disparity rather than increase it is especially critical for women who already face a 26% gap in retirement savings compared to men.225 A minimum contribution of just 50¢ an hour over a lifetime would yield $160,000 in private individual wealth (2013 dollars) based on the returns of the last 45 years.226 It would change the economic fortunes of every working and middle class family. It would supplement Social Security and guarantee that a lifetime of work would mean a comfortable and dignified retirement. And, it would allow families to build a nest egg to pass on to children. We need to make sure everyone who works is able to build an asset base.
2. Home Equity Vouchers for 12 million middle class families.
Our Home Equity Vouchers would help middle class families to more quickly pay down their mortgages, build up equity, and relieve the burden of debt. The mortgage crisis was fueled, in part, because homeowners did not have enough equity in their homes to guard against a downturn in prices. In addition, our longtime subsidy of mortgage interest encouraged the formation of dangerous products like the interest-only loan. During the housing bubble, nearly half of all new homes were bought with $0 down.227 Home Equity Vouchers would match up to $500 a year—or $5,000 per family over a decade—dollar-for-dollar, on additional principal payments above a family’s current monthly mortgage requirements. For 30-year fixed mortgages, grants would be limited to families making under $125,000 and for the first 10 years of a home loan. To pay for this, we scale back the mortgage interest deduction for high-end homes to provide $60 billion. The CBO estimates that reducing the maximum mortgage amount on which interest can be deducted from $1.1 million to $500,000 would yield $41.4 billion over seven years.228 The roughly $60 billion in savings (over 10 years) covers the cost. We estimate up to 12 million middle class households would be eligible to participate.
3. Wealth Builder Contributions for 90 million middle class workers.
All full-time workers with wages less than 200% of the average yearly wage of private sector, non-supervisory workers ($73,662)229 would receive a yearly contribution of $500—or $5,000 per individual over a decade—that each person could direct to retirement, college savings, student loans, or a mortgage. And if an individual is eligible for the EITC, he or she could use the funds for any purpose. This yearly infusion of capital would help Americans generate wealth in ways that make the most sense to their circumstances. We pay for this by capping tax deductions at $50,000 (excluding charitable) for individuals earning more than $200,000 (couples earning $250,000) and dedicate that revenue to finance the $450 billion Wealth Builder Contributions, affecting close to 90 million workers.230*
* Our estimate of $450 billion would be slightly reduced if policymakers also enact our Home Equity Vouchers proposal and pay for it by changing the mortgage interest tax deduction.
4. A middle class wage hike through trimming the cost of non-wage benefits.
In 2000, health insurance was 5.9% of employee compensation;231 in 2015 it was 8.4%.232 If that increase in employer-provided health costs instead went to employees in the form of wages, the average worker would take home $1,675 in additional pay in 2015.233 While analysts point to a host of factors for ever-rising costs, the prime cause is clear—incentives that lead every actor in health care to consume and spend more dollars. Physicians, for example, earn more money when they do more procedures. And it’s easier for patients to get expensive care in the emergency room rather than lower-cost care from their home. We propose 15 policies that reverse the incentives in health care away from quantity and toward value.234 Placing these mechanisms throughout the health care system is the only way to systemically reduce spending. Doing so will lead to patients being more likely to get the health care they want—and businesses having more room to increase take home pay. These ideas achieve $612 billion in federal government savings and $400 billion in savings for employers and employees. For example:
- An Electronic Health Record “Bank”: All Americans should have a complete electronic health record that can sync across all doctors and hospitals to ensure that patients get optimal care whenever they need it and vastly reduce duplicative services.
- Expanding telehealth: We need to break down barriers in order to make personalized “telehealth” sessions widely available to patients so they can seek more efficient care 24 hours a day from the comfort of their home.
- Integrated behavioral health care: Health care professionals should better integrate treatment for physical conditions as well as accompanying behavioral health conditions in order to better help the whole patient.
- Medical discussion guides: Patients should have access to medical discussion guides (also known as decision aids) to help them and their doctor make the best treatment decisions for common but complicated health problems.
- Preventing diabetes: Diabetes screenings and prevention programs should be made widely available to the patients who can benefit from them.
- Rethink Medicare enrollment: Automatic enrollment and comparison shopping for Medicare needs to be drastically simplified, which would lower costs for beneficiaries, give them quality care, and reduce unnecessary Medicare spending.
5. A minimum wage boost that works from Brooklyn to Boise.
We end the fight and drama over periodic minimum wage increases by gradually raising it to between $10 and $12 by 2020 based on average hourly wages and regional cost variations, with automatic readjustments every 3 years. Specifically, we set a “national average” for the minimum wage which would equal 50% of the average hourly wage of private sector, non-supervisory workers. If this were in place today, the average would be $10.54.235 We use the term national average for the minimum wage because we also allow for a federal floor for wages that differs state-by-state depending on costs. For low-cost states (e.g. North Dakota, Idaho, and Kentucky), the initial rate would be $1 less than the national average; for high-cost states (e.g. New York, California, and Virginia), the initial rate would be $1 more than the national average. The remaining states would be set at the national average. By 2020, we estimate that the national average would be over $11, putting the minimum wage over the range of $10 to $12. Each three years thereafter, the minimum wage would be adjusted. Regional adjustments of the minimum wage have been proposed as a way to minimize job losses related to wage hikes in low-cost states, and companies like IKEA have employed cost of living calculators to regionally raise their minimum wage.236 We believe raising the minimum wage is critical, but we also want to make clear that the minimum wage is a waystation at the beginning of a successful work career, not a permanent destination. We also call for renewed federal efforts to encourage higher uptake of the Earned Income Tax Credit.
6. A gig economy safety net that works for employers and contractors.
Independent contractors don’t necessarily have access to the same benefits that typical employees have. And while the minimum pension (described above) could help them with retirement and the ACA allows them access to health care coverage, they still lack worker’s compensation and disability insurance. We recommend establishing an "accumulated benefits package.” Under our proposal, contractors could receive a small contribution per hour worked or per dollar of revenue into a tax-free account that can be used towards purchasing these benefits (e.g. private worker’s compensation insurance). A similar proposal has been raised by Sen. Mark Warner (D-VA) suggesting contributions towards a third-party social insurance fund.237
Conclusion
In 2008, Barack Obama ran on two words: hope and change. It is evident everywhere one looks that “change” is the best word to describe our economy. Yet much of the Democratic Party establishment is resistant to that change and hopes that by railing against it, they can somehow stop it or slow it down. But this economic change is relentless. There is no stopping an iPhone or Snapchat from putting a slumbering Kodak and its 130,000 employees out to pasture. Americans know this intuitively and know that navigating these changes is the central economic challenge of their lives. The question is whether they will be forced to do this on their own or whether they will have help.
If Democrats are to be successful—winning elections and successfully building an economy that supports the overwhelming majority of Americans with secure, well-paying jobs—our entire economic agenda must endeavor to create growth that benefits the middle class by making the global forces of change work for people, not against them. The party that does this—that creates an agenda to fulfill the promise of the new economy, harnesses the forces of change, and speaks honestly of the changes Americans face—will be the party that rides majorities into the White House and Congress. And the way to do that is through more skills, more jobs, and more savings. This is how to get ready for the new economy.
Budget Appendix
In this appendix, we summarize the policies described in Section 2 and provide general estimates of their impacts on the federal budget. All budget figures are either cited in the report or reflect the authors’ calculations. De minimus revenue or outlays under $100 million were not included. All figures are in billions and over a 10-year budget window.