Report Published October 30, 2024 · 16 minute read
Lowering Prices and Six Other Big Challenges for US Hospitals
David Kendall & Darbin Wofford

Takeaways
Hospitals in the United States face multiple challenges, and their success in meeting those challenges varies considerably. Understanding this variation is essential to the policy goal of helping all hospitals succeed. For example:
- Consolidation from mergers and acquisitions has limited competition.
- Hospital markets with less control by hospital chains have lower prices.
- Hospitals that have higher management and administrative costs charge higher prices.
- Hospitals that are inclusive of everyone in their community tend be smaller and charge lower prices.
This report highlights key successes and challenges of hospitals throughout the country.
Our nation has over 6,000 hospitals with almost one million beds to care for patients.1 They provide essential care and economic benefits for regions across America. Many are highly successful delivering high quality, equitable care at reasonable prices. But most have room for improvement. This report looks at seven of the most consequential ways hospitals’ performance varies—all of which better management and public policy can improve. We explore:
- Consolidation
- High prices
- Unnecessary care
- Administration costs
- Care for vulnerable patients
- Fair treatment of all patients
- Patient safety
The hospital industry focuses attention on the challenge of Medicare and Medicaid payment levels, but policymakers need to consider all the challenges that hospitals must overcome to succeed.
This report is part of a series called Fixing America’s Broken Hospitals, which seeks to explore and modernize a foundation of our health care system. A raft of structural issues, including lack of competition, misaligned incentives, and outdated safety net policies, have led to unsustainable practices. The result is too many instances of hospitals charging unchecked prices, using questionable billing and aggressive debt collection practices, abusing public programs, and failing to identify and serve community needs. Our work sheds light on issues facing hospitals and advances proposals so hospitals can have a financially and socially sustainable future.
1. Consolidation
Hospital chains, also known as hospital systems, have been expanding their share of the market over the past two decades. Chains have bought hospitals and merged to the point that virtually all markets are highly concentrated, which simply means competition isn’t working as it should.2 Two-thirds of hospitals are part of a consolidated health system, compared to 10% in 1970.3 Hospitals have also acquired physician practices—59% of all physicians are now hospital employees.4
Two areas of the nation demonstrate the effect of consolidation: Charlotte, NC and Bakersfield, CA. In Charlotte, two hospital systems—Novant Health and Advocate Health—control all seven local hospitals. They charge patients with private coverage an average of 307% of what Medicare pays for the same facility-based services, compared to the national average of 262%.5
Meanwhile, Bakersfield’s hospitals are less consolidated. The seven hospitals in the region are owned by five different systems and charge an average of 244% of what Medicare pays, one-fifth less than in Charlotte.6 While consolidation is not the only contributing factor to higher prices, research clearly shows that, everything else being equal, consolidation raises prices.7
With most hospitals being part of a chain, those chains have started to limit competition to a high degree in some areas. Eleven percent of hospitals are in markets where half or less of the hospitals are uniquely owned.8 (See methodology for another version of this calculation.) That group of hospitals charge an average of 276% of Medicare’s prices, which is 5% more than the national average.9
Hospitals are highly motivated to grow their market share because they can charge higher prices for patients with private coverage. As a hospital’s control of a market grows, patients have no other choice but to accept whatever prices they charge. Unfortunately, current antitrust rules and enforcement are failing to preserve and promote competition.10
2. High Prices
Along with consolidated market power comes high prices. For over half of Americans with private health insurance, payers (employers and insurance companies) negotiate individually with hospitals. Because consolidation increases a hospital system’s market power, they have more leverage over employers and health plans to increase reimbursement rates. As consolidation increases, so do prices. In some cases, hospitals threaten to leave patients’ networks to pressure plans into paying higher prices.11 Because health plans must maintain network adequacy in the local hospitals they cover, plans often have no choice but to accept hospital demands. Because high hospital prices increase the cost plans and employers pay for care, premiums and cost-sharing increase as well. Premium increases for employers result in lower incomes, decreased employment, and worse health throughout the population.12
Most hospitals charge commercial plans more than they need to, even when they lose money on Medicare. One in seven hospitals charge employers and commercial plans three times or more than they need to break even.13 Some hospitals, like the Lewis Gale Medical Center in Salem, VA, deliver high-quality care in exchange for higher prices. Lewis Gale receives an “A” grade for outcomes and value from the Lown Index, which ranks hospitals across a wide range of social responsibility metrics. Outcome measures include patient readmissions and deaths, and value measures include the total health care costs for patients during a fixed period of time following a hospital admission. Other hospitals, like Ochsner Rush Health in Meridian, MS, have poor quality care. Ochsner Rush charges commercial plans four times more than its breakeven but gets a “D” grade for outcomes and a “C” for value.
3. Unnecessary Care
When a patient comes to hospital after fainting, some hospitals give a battery of tests like CT and MRI scans. But research shows that these tests are unnecessary unless the patient has other symptoms like chest pain or repeated fainting spells.14 Hospitals that avoid unnecessary care tend to be more efficient overall.15 They charge lower prices to employers and commercial plans because they are in more competitive markets.16 They also have lower management and administrative costs.17
Homestead Hospital, in Homestead, FL, is part of the Baptist Health South Florida health system. It has one of the highest rates of unnecessary care in the country according to the Lown Institute. It receives a “D” grade (the lowest rank) for value which also includes measures of total costs for patients needing extra care shortly after going to the hospital. It operates in a fairly competitive market, but its management and administrative costs fall in the most expensive quintile of hospitals throughout the country. It charges employers and commercial health plans high prices at 327% of Medicare rates, but it does well on overall patient outcomes and patient satisfaction.
At the other extreme is Cheshire Hospital in rural Keene, NH. Cheshire is top ranked for avoiding unnecessary care, and Lown awarded Cheshire with a “A” for value. It is a part of the Dartmouth Health System whose leadership has championed eliminating unnecessary care.18 Its management and administration costs are relatively low, falling into the second lowest quintile among all hospitals. A well-run hospital can hold down costs by curbing unnecessary care without adding extra management or charging higher prices.
Because hospital payments increase by the number of tests and procedures they perform, they do not have a strong incentive to weed out unnecessary care.
4. Administrative Costs
Hospitals’ management and administrative costs vary considerably when measured against the number of full-time (or equivalent) employees. Looking at hospitals ranked by their management and administration costs, those that fall in the highest quintile (top fifth), have costs that are more than two times the costs of the hospitals in the lowest quintile as shown in the chart below.19
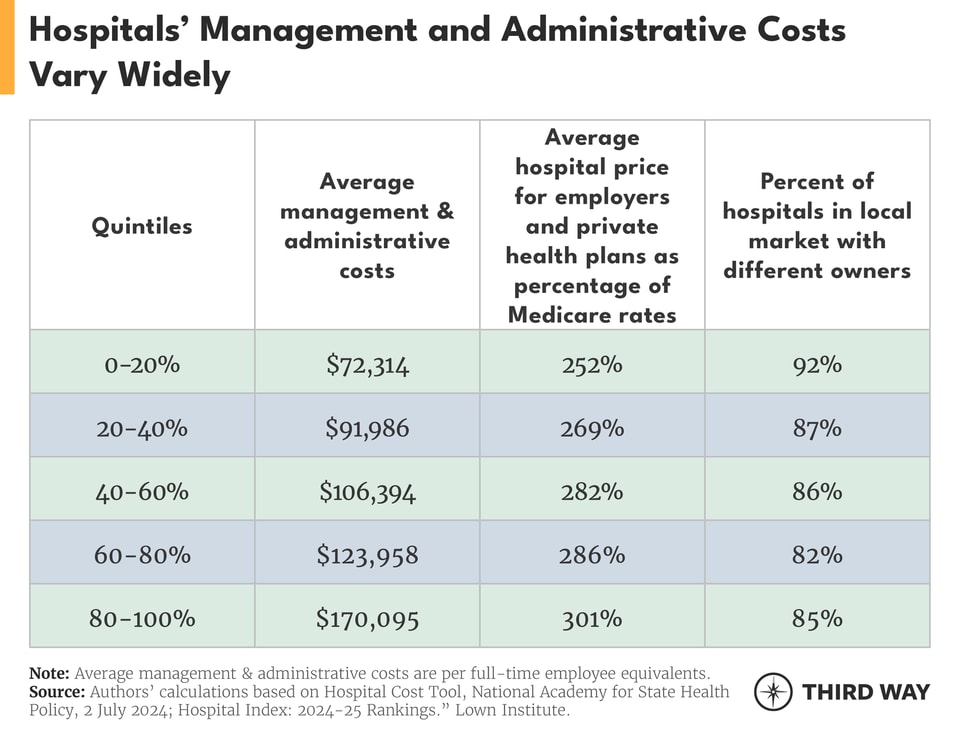
Another factor in the variation of management costs is that a hospital’s costs are higher when they face less competition.20 Hospitals with higher management and administrative costs are more likely to be in markets with less competition as measured by the percentage of local hospitals with different owners.21 That’s because competition gives hospital administrators an incentive to keep costs down.
Executive pay also explains higher costs. Research on nonprofit hospitals has shown that higher executive pay increases are associated with larger hospitals and more profit.22 Those kinds of rewards give hospital executives a strong incentive to seek mergers and acquisitions of other hospitals, leading to higher prices. It also leads to a higher gap between executive pay and hospital workers’ pay.23
Bayhealth Hospital-Kent Campus in Dover, DE is an example of high costs. Its management and administrative cost per full-time employee in 2022 was $304,499 for 281 beds. It faces minimal competition in its immediate area and charges employers and commercial plans 415% of Medicare prices. It received a “B” grade for health care quality from Lown.
At the other end of the cost spectrum is Ouachita County Medical Center in Camden, AR. It is part of the Quorum Health and has 82 beds and $59,936 in management and administration costs in 2022. Its local market is competitive, and it charges 151% of Medicare rates. Despite very different levels of administrative costs and levels of competition, these two hospitals have achieved the same health care quality grade from Lown.
5. Care for Vulnerable Patients
Hospitals receive a number of financial benefits meant to support patients in vulnerable and low-income communities. Some patients may lack insurance while others may have coverage with high deductibles that leave them unable to pay their bills. Moreover, some hospitals may take of a lot of patients with public coverage, which pays hospitals less for each service. The financial benefits hospitals receive can include:
- Half of hospitals are not-for-profit, giving them hefty tax exemptions. In exchange for roughly $38 billion a year in federal, state, and local tax exemptions, nonprofit hospitals are required to provide benefits to the community such as charity care and spending on local health care programs.24
- Medicare and Medicaid provide additional funding to hospitals who care for a disproportionally large number of patients in public programs or who are uninsured, which are known as disproportionate share hospital payments, and to rural hospitals.25
- Most nonprofit hospitals are eligible for the 340B Drug Pricing Program. This program requires drug manufacturers to provide steep discounts for hospitals and other health care entities enrolled in the program. Collectively, these discounts add up to nearly $60 billion a year.26
- Medicare also has a reimbursement program for bad debt. Bad debt is money owed to hospitals for Medicare enrollees’ cost-sharing, which Medicare reimburses 65% to forgive.27
Amid all of this public support, however, the average hospital spends 2% of its expenses on charity care.28 That is based on the amount that hospitals provide directly to patients who cannot afford their care, minus the amount they collect for charity care from grants they raise specifically for charity and the portion of the bills that patients can afford to pay. Shockingly, 1 in 12 hospitals made a profit on charity care by collecting more money for charity care than they paid out in charity care in 2022.29 Further, for-profit hospitals provide nearly double the amount of charity care as nonprofit hospitals.30 It is important to note that hospital chains tend to provide more charity care than independent hospitals.31
On one side, Jackson Memorial, a public hospital in Miami, made a profit of 16% of patient revenue from its charity care program. After an audit by the US Department of Justice, it had to return $122 million to the state of Florida.32 In contrast, a group of public hospitals and clinics, the Harris Health System, which serves the county including Houston, TX, spent all its patient revenue on charity care. Texas has one of the strongest charity care laws in the country, requiring all nonprofit hospitals to provide charity care equal to the amount they receive in tax exemptions.33 While Jackson Memorial’s profits on charity care were reversed, there is still a systematic problem with any hospital making a profit off money raised for charity care.
The community benefits that nonprofit hospitals are supposed to provide are also lacking. Charity care only accounts for about 20% of community benefits.34 The single largest category nonprofits claim as a benefit to the community is paying themselves back by their own claimed “shortfall” in Medicaid at 44%.35 While Medicaid payments are often lacking, about a third of hospitals do make money on Medicaid due to their own ability to be efficient.36 Regulation of hospitals’ charity care programs is weak, which has contributed to widespread medical debt. Several states like Oregon and North Carolina, however, have been stepping up their expectations for hospitals’ charity care.37 In addition, hospitals could do more to improve the health of their community especially for those who face disadvantages in getting healthy.38
6. Fair Treatment for all Patients
Equitable health care is critical to ensure that everyone receives the care they need. Longstanding racial bias and financial obstacles for patients, however, often stand in the way of that goal. A key measure of equitable health care is whether a hospital’s patients are like the residents in the community. The Lown Institute has constructed a measure of inclusivity based on demographic statistics for a hospital and its surrounding area. The demographic measures include race, income, and education levels.39
Hospitals that are more inclusive share several characteristics. They tend to charge lower prices to employers and commercial health plans, face more competition, and have fewer beds.40 They are also more likely to be government-owned hospitals.41 Nonprofit and for-profit hospitals are equally inclusive.
The most exclusive hospital is Providence St. John’s Health Center with 228 beds in Santa Monica, CA. Its parent system, Providence, is a large nonprofit system of 51 hospitals, which has been in the news for aggressive debt collection.42 Both St. John’s and the Providence health system received a “D” grade from the Lown Institute for inclusiveness and a “C” for overall equity, which includes other measures like the amount of charity care. St. John’s is in a somewhat competitive market and charges private plans 198% of Medicare rates. Its administration and management costs are on the higher side, falling in the second highest quintile of all hospitals.
The most inclusive hospital is Metropolitan Hospital Center in East Harlem, New York City, NY. Lown gives it an “A” for equity. Its market is more competitive than most with 8 of the 14 area hospitals having different owners. It delivers high quality care but has low patient satisfaction. It charges private health plans 58% of Medicare rates but has management and administrative costs in the highest quintile.
Encouraging equitable care is a new area of public policy that the Biden-Harris Administration is tackling.43 For example, it is increasing the number of physicians who train in underserved urban and rural areas, which increases the chances those doctors will stay and serve those areas.
7. Patient Safety
A patient’s chance of survival following hospital care is a critical measure of success that Medicare has been assessing since the 1980s. Its data accounts for the fact that some hospitals, like cancer centers, have sicker patients. The good news is that mortality rates have been dropping in hospitals.44 The bad news is that many hospitals have rates that still remain too high. According to a federal report, one of every four Medicare patients suffer an injury while staying at a hospital. Hospitals could have prevented 43% of those injuries through quality improvement systems and other measures; secondarily, such measures would have also saved money.45
Such savings might help offset the higher management and administrative costs associated with lower mortality rates.46 Hospitals with lower mortality rates also charge more to private plans.47
Hospitals at both extremes of the spectrum are not necessarily well-known. One of the highest mortality rates for patients during a hospital stay is found in Coosa Valley Medical Center Southeast of Birmingham in Sylacauga, AL. This city government-based 122-bed hospital faces minimal competition but charges private plans only 129% of Medicare rates. It struggles with cutting back on unnecessary care and keeping costs down generally, but patients are mostly satisfied with their care. They may not be aware of the hospital’s relatively high mortality rate.
The hospital with the lowest mortality rate is East Liverpool City Hospital in Eastern Ohio with 116 beds. It was one the many hospitals in the region that are part of a chain, which has diminished competition. It nonetheless charges private plans less than the average, and its management and administrative costs are in the lowest quintile. It is simply a well-run rural hospital. It received an “A” grade across all categories from the Lown Institute, which are for equity, value, and outcomes.
Conclusion
Hospitals are essential to our nation. That’s why helping all of them succeed is also essential. As lawmakers look to address hospitals’ challenges, they won’t find a silver bullet but a number of proposals to lower costs and increase competition are moving in Congress. In a previous report, we showed that the adequacy of payments by public payers like Medicare and Medicaid depends, in part, on a hospital’s incentives to be efficient. Congress should take action to increase competition in hospital markets and curb their prices to provide relief for patients, employers, and taxpayers.
Methodology
The calculations in this report come from appending data from the Lown Institute’s Hospital Index, which ranks hospitals across a wide range of metrics, to the data from the National Academy for State Health Policy’s (NASHP) Hospital Cost Tool, which aggregates hospitals’ costs reports to Medicare. We combined the two most recent databases using the Centers for Medicare and Medicaid Services Certification number.48 NASHP has data on 4,541 hospital, and Lown has 3,680 hospitals.
We used the Dartmouth Atlas crosswalks to match zip codes from NASHP to the hospital services areas.49 Forty one zip codes did not match to a hospital service area and were assigned to the numerically closest zip code. For the analysis of the hospital prices for employers and commercial health plans, NASHP includes RAND price data for 2,926 hospitals.
To calculate unique ownership by hospital markets, we used hospital service areas, which are based on where patients go for hospital care.50 About half of the hospital service areas have only one hospital. For example, a hospital service area with one hospital would be counted as 100% uniquely owned, while an area with two hospitals and two different owners of those hospitals would be counted as 50% uniquely owned. A common measure of market concentration is the Herfindahl–Hirschman Index, but the data needed for that measure was not accessible for this report.
Using a larger geographic area (called a hospital referral region), which is based on where patients go for specialized care like cardiology, we found the same results and correlations with one difference. Instead of 11% of hospitals being in markets where half or less of the hospitals are uniquely owned, that number is 34%.
Timothy Kusuma, Third Way’s Economic Fellow, provided research assistance with this report.