Report Published April 1, 2020 · 16 minute read
Price-to-Earnings Premium: A New Way of Measuring Return on Investment in Higher Ed
Michael Itzkowitz


Since passing the last iteration of the Higher Education Act in 2008, policymakers have become increasingly interested in looking at ways to measure the “value” provided by different federally-funded institutions of higher education—to get a better sense of which ones are giving students and taxpayers a good return on their investment, and which ones may not be delivering. Just last year, Senators from both sides of the aisle introduced plans to evaluate institutions and college programs based on whether their former students could pay back their federal loans—one possible way to measure return on investment.1 And outside of government, there are numerous papers and high-profile commissions that have attempted to define value in higher education.2 Even so, there’s still minimal consensus on how to accurately gauge the value that students get from attending a specific higher education institution or program, and many of the proposals on the table have significant political hurdles, implementation problems, or unintended consequences.
The largest federal effort to measure the economic value of higher education programs, known as “Gainful Employment,” was enacted into law in 2014. These regulations aimed to ensure that most students who attended for-profit and certificate-granting programs were able to earn enough to pay down their educational debt after attending.3 If the majority of graduates were obligated to spend too much of their discretionary income on educational debt payments, that program was deemed “failing” and risked losing access to federal student aid dollars to fund its operations. Yet, before this rule was ever enforced, it was rescinded by the subsequent administration, allowing thousands of low-performing higher education programs to continue receiving taxpayer funding while leaving students with debt balances they are unlikely to be able to ever repay.4
While Gainful Employment has developed a stigma as being an Obama-era initiative that only covers a subset of college programs, some in Congress have expressed interest in alternative policies that would protect students from poor-performing colleges and programs, while more efficiently targeting the massive federal investment in higher education subsidized by taxpayers every year.5 If lawmakers wish to meet the primary expectation of today’s higher ed students—getting a good job that allows them to live a stable and financially secure life—they will have to agree on a way (or ways) to determine whether students are getting a premium on their taxpayer-funded investment.6
An Alternative Way to Measure Economic Value
The number one reason why students attend an institution of higher education is to increase their employability and gain financial security.7 In practical terms, this means they are investing in higher education expecting to earn more than they would have if they hadn’t attended an institution or program in the first place. And with students and taxpayers pumping tens of billions of dollars into institutions of higher education every single year, both sets of interested parties should be able to make at least an educated guess about how long it will take to recoup their investment.
Just as Wall Street investors use a price-to-earnings ratio to evaluate the value of individual stocks, consumers and lawmakers should similarly be able to assess the value that an individual institution provides to its students before they decide to write huge checks. To capture this sentiment, this paper models a new approach for measuring economic value—a Price-to-Earnings Premium (PEP)—that can be used to get a sense of the amount of time it usually takes to recoup the cost of obtaining a credential at a particular school.
Calculating a Price-to-Earnings Premium
Here’s the idea. If students who pursue a certificate or degree subsequently earn more than their non-college going peers because of that postsecondary training, their additional income can be used to recoup the amount they paid to obtain their certificate, associate’s, or bachelor’s degree. And once they have recouped those expenses, that additional income quite literally becomes a “return on investment (ROI)” for those students.
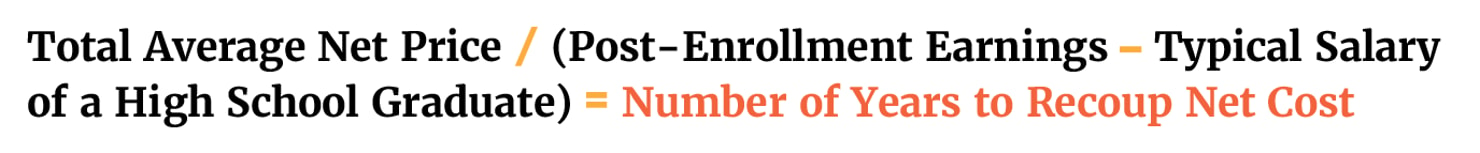
To measure this concept, we simply look at the price that the average student pays out-of-pocket relative to the additional amount that they earn annually beyond the typical high school graduate. To calculate a PEP for each institution of higher education, we use federally available data from the US Department of Education (Department) and make certain assumptions based on that data. To determine how much students pay out of pocket, we look at how much it typically costs them to attend an institution after all scholarships and grants are taken into account, or their total annual net cost. Rather than only assessing whether students are earning enough to pay down their educational debt—as the Gainful Employment regulations did—a net price assesses how much students actually paid to finance their postsecondary endeavors, whether that’s through federal loans, self-financing, or both.8 We assume in our calculations that it takes students four years to earn a bachelor’s degree, two years to earn an associate’s degree, and one year to earn a certificate—the rosiest possible scenario. Therefore, we multiply the annual net price by the number of years it would take a student to earn the predominate credential awarded at each school, if they finished as fast as possible.9
To determine how much of an economic boost an institution provides to its students, we then look at the median salaries of students who attended an institution.10 If most students who attended an institution earn more than the typical high school graduate (with no postsecondary experience) earns within their state, we assume that the institution has provided a wage premium that can then be used to pay down its net cost over time, and we can measure how long it might take using the calculation above. Baked into a PEP is the notion that most certificate- or degree-seeking students should be earning more than the typical high school graduate in the state which their institution is located ten years after they enrolled. If the majority of students earn less than this baseline, their institution is considered to have provided no ROI—as most students haven’t received an income bump sufficient to recoup what they paid to attend.
More detailed information on the methodology and assumptions used in this paper can be found in the appendix.
Examples of How a PEP Measures Economic Value
The benefit of a PEP is that it can be used to measure the amount of time it would take the typical student to recoup the cost of obtaining a credential at a certain school. We offer three examples below: a four-year institution, a two-year institution, and a certificate-granting institution.
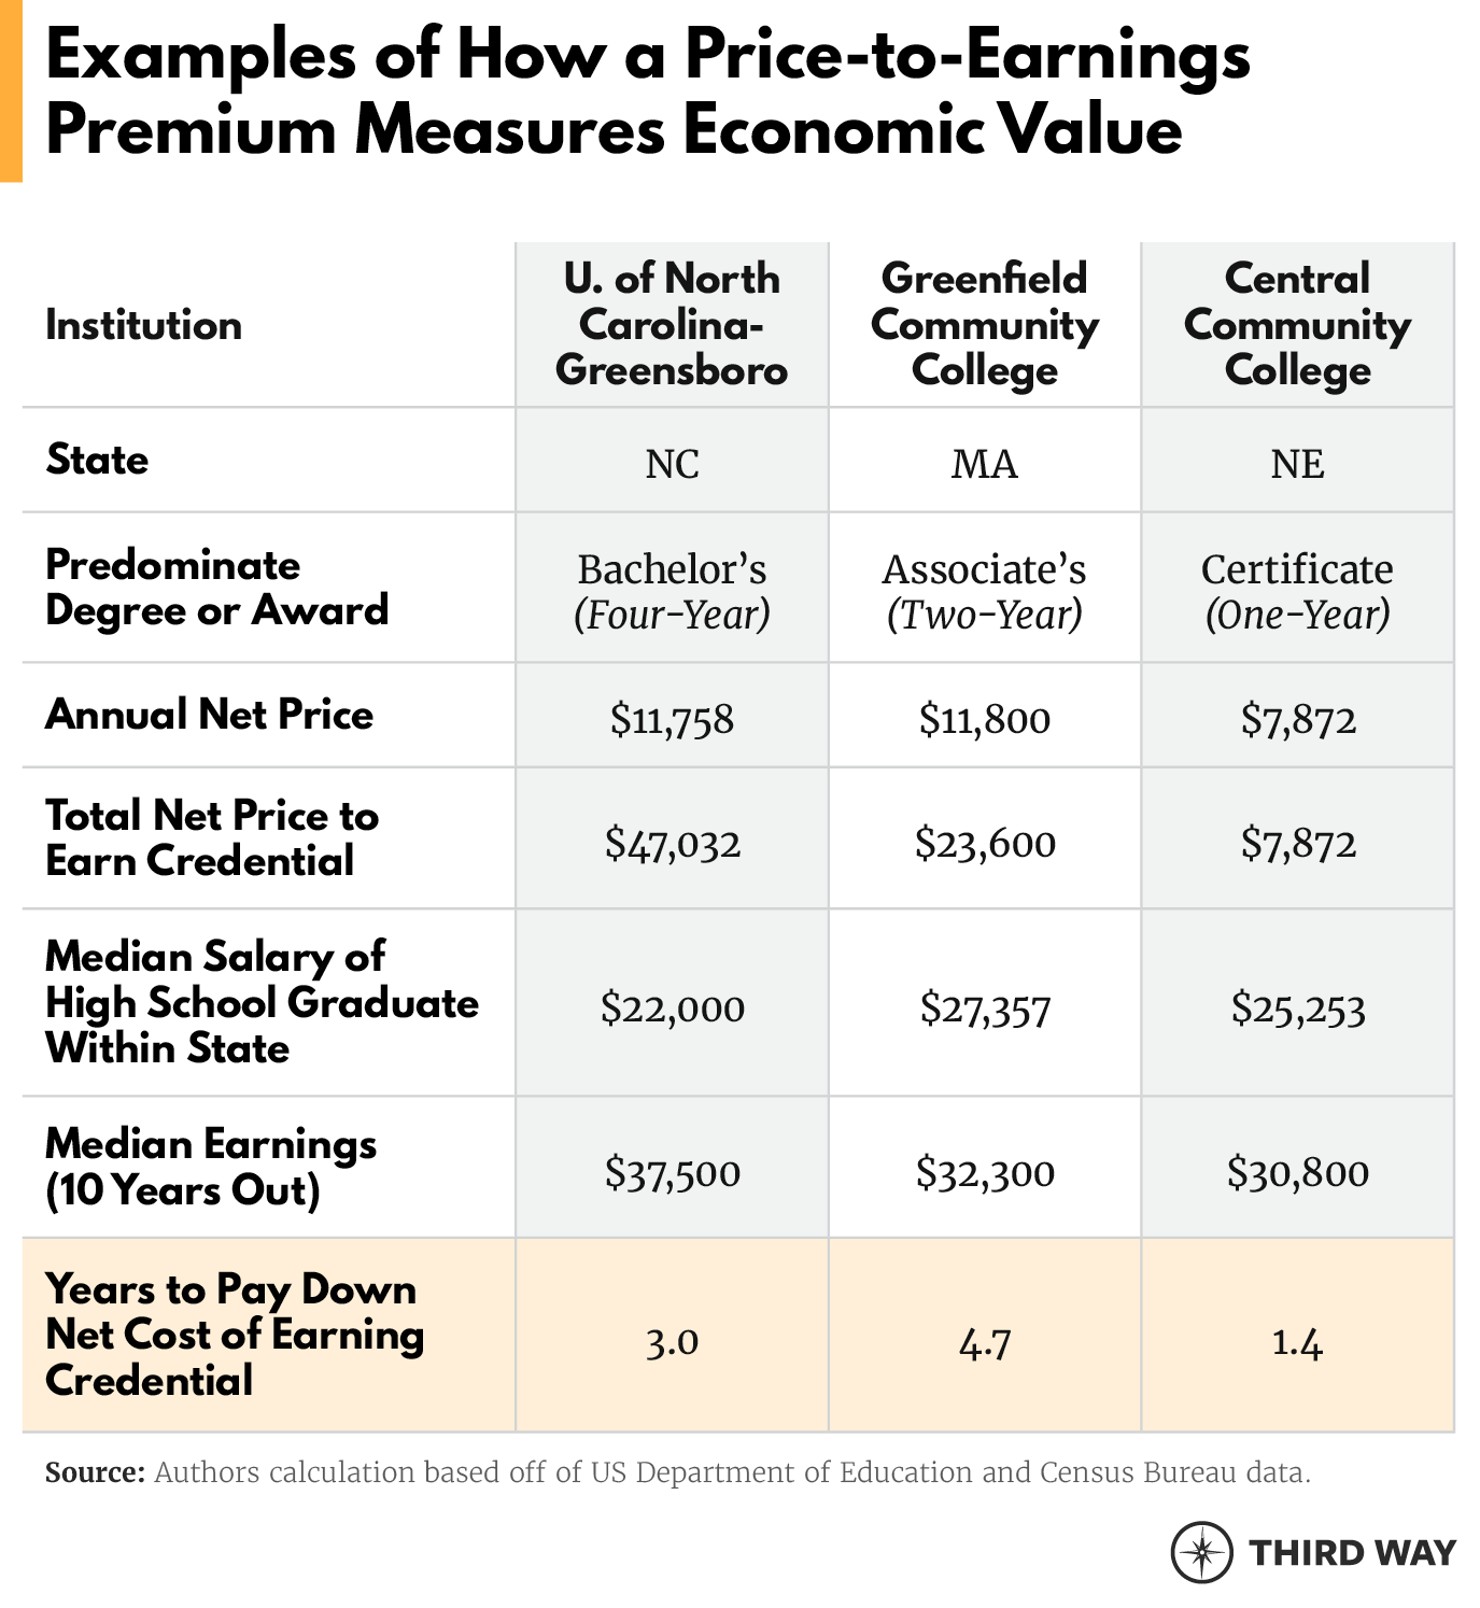
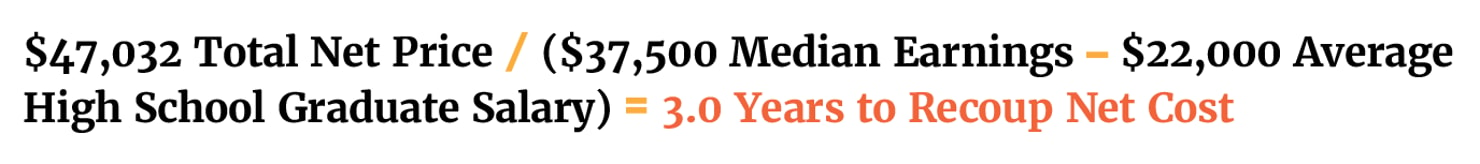
The annual net price to attend the University of North Carolina–Greensboro is $11,758. Therefore, if a student earns a degree in four years, it will—on average—cost them $47,032 to do so.11 The typical student who attends UNC-Greensboro earns $37,500 within 10 years after initial enrollment. And the typical high school graduate in North Carolina who never attended an institution of higher education earns $22,000 annually.
Two-Year Institution: Price-to-Earnings Premium for Greenfield Community College
Since Greenfield Community College primarily awards two-year degrees, it would cost the average full-time student $23,600 to earn a credential if they finished their associate’s degree in two years (annual net price $11,800 x two years).
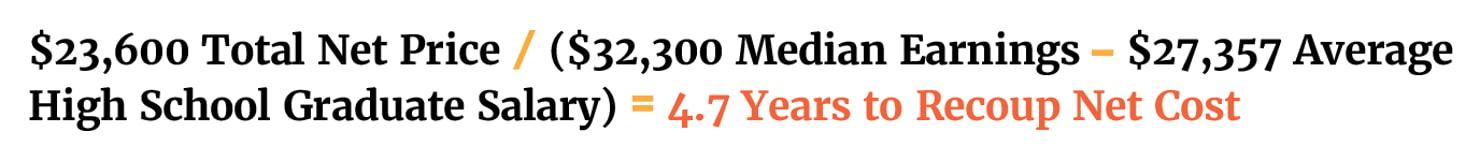
Former students who attended Greenfield earn a median salary of $32,300 ten years after they enrolled. The typical high school graduate in Massachusetts, where Greenfield is located, earns a salary of $27,357. Since the annual earnings premium of attending Greenfield is roughly $5,000 beyond a high school graduate, it would take them a little less than five years to recoup the $23,600 cost to earn an associate’s degree from the school.
Certificate-Granting Institution: Price-to-Earnings Premium for Central Community College
Central Community College primarily awards certificates, rather than two- or four-year degrees. Assuming that most students complete these credentials within one year of entering, they would incur a total net price of $7,872.
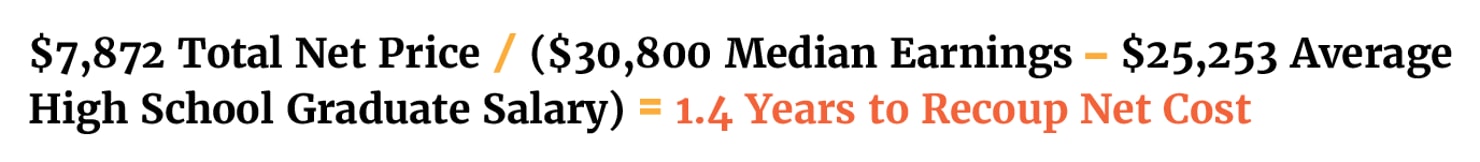
Former Central Community College students earn a median salary of $30,800 10 years after enrollment. The typical salary of a high school graduate in Nebraska, where Central is located, is $25,253. Since students at Central Community College earn around $5,600 more than the average high school graduate within their state on an annual basis, it would take those students about a year and a half to recoup the $7,872 net cost of earning a credential.
How PEPs Look at Institutions Across the United States
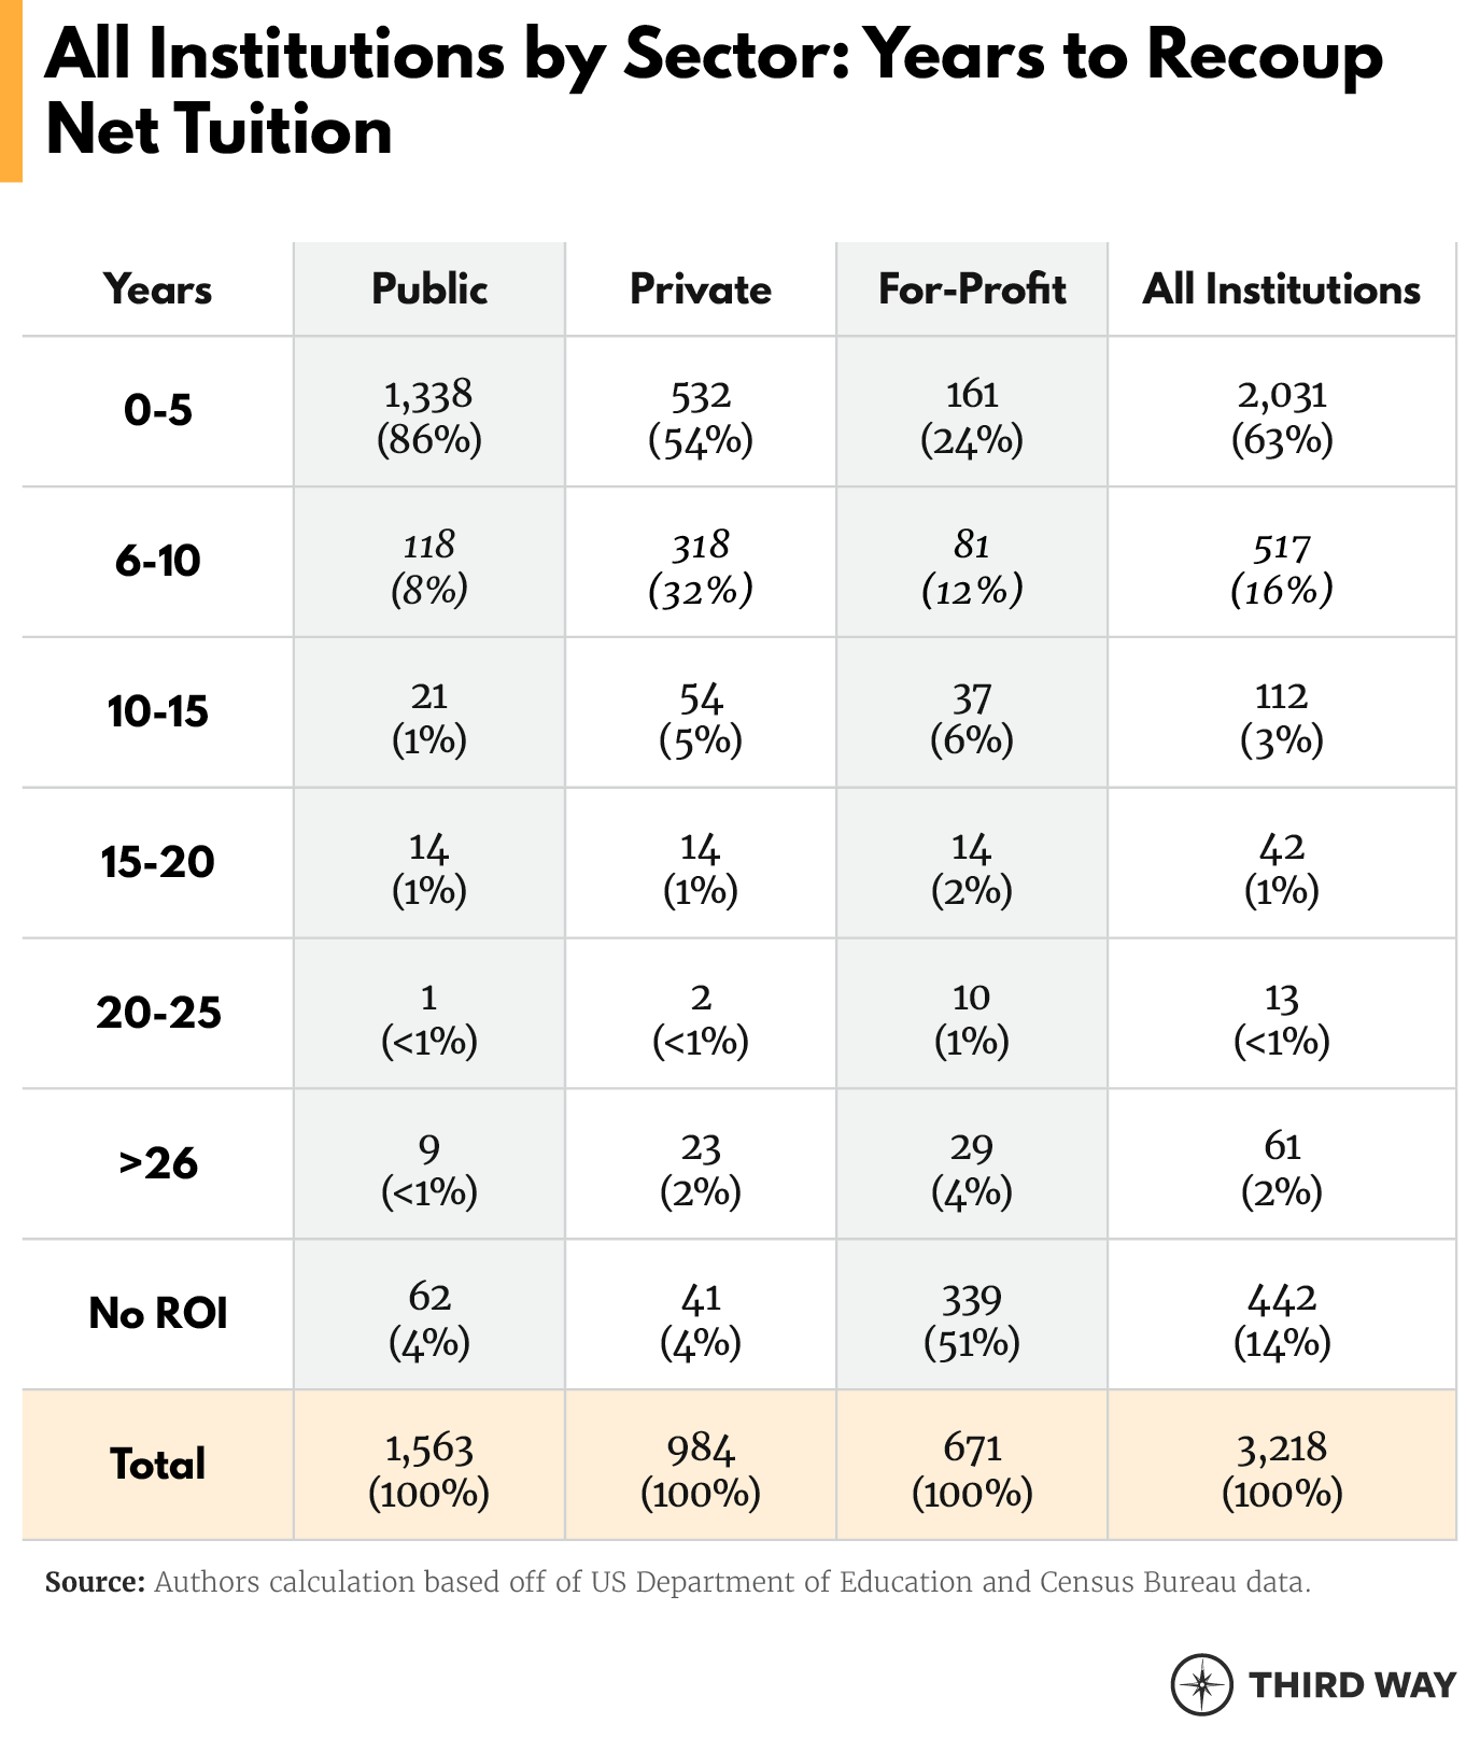
In order to gain a better understanding of what kind of ROI institutions are currently providing to their students, we take a broader look at PEPs for schools across the United States. Below, we model the amount of time that it would take students to recoup their out-of-pocket costs, based on the postsecondary wage premium they have obtained, at all federally-funded schools where data is available.
The good news is that students who attend nearly two-thirds of institutions in the United States can recoup the cost of earning their credential after just five years of benefiting from the wage premium they have obtained through their postsecondary training. Still, there are 228 institutions where it takes students more than 10 years to earn enough to pay down their cost of earning a credential. Most shockingly, however, 442 institutions show no ROI by these calculations at all, meaning that students will likely never be able to recoup their educational investment.
PEP Outcomes Across Type of Institution
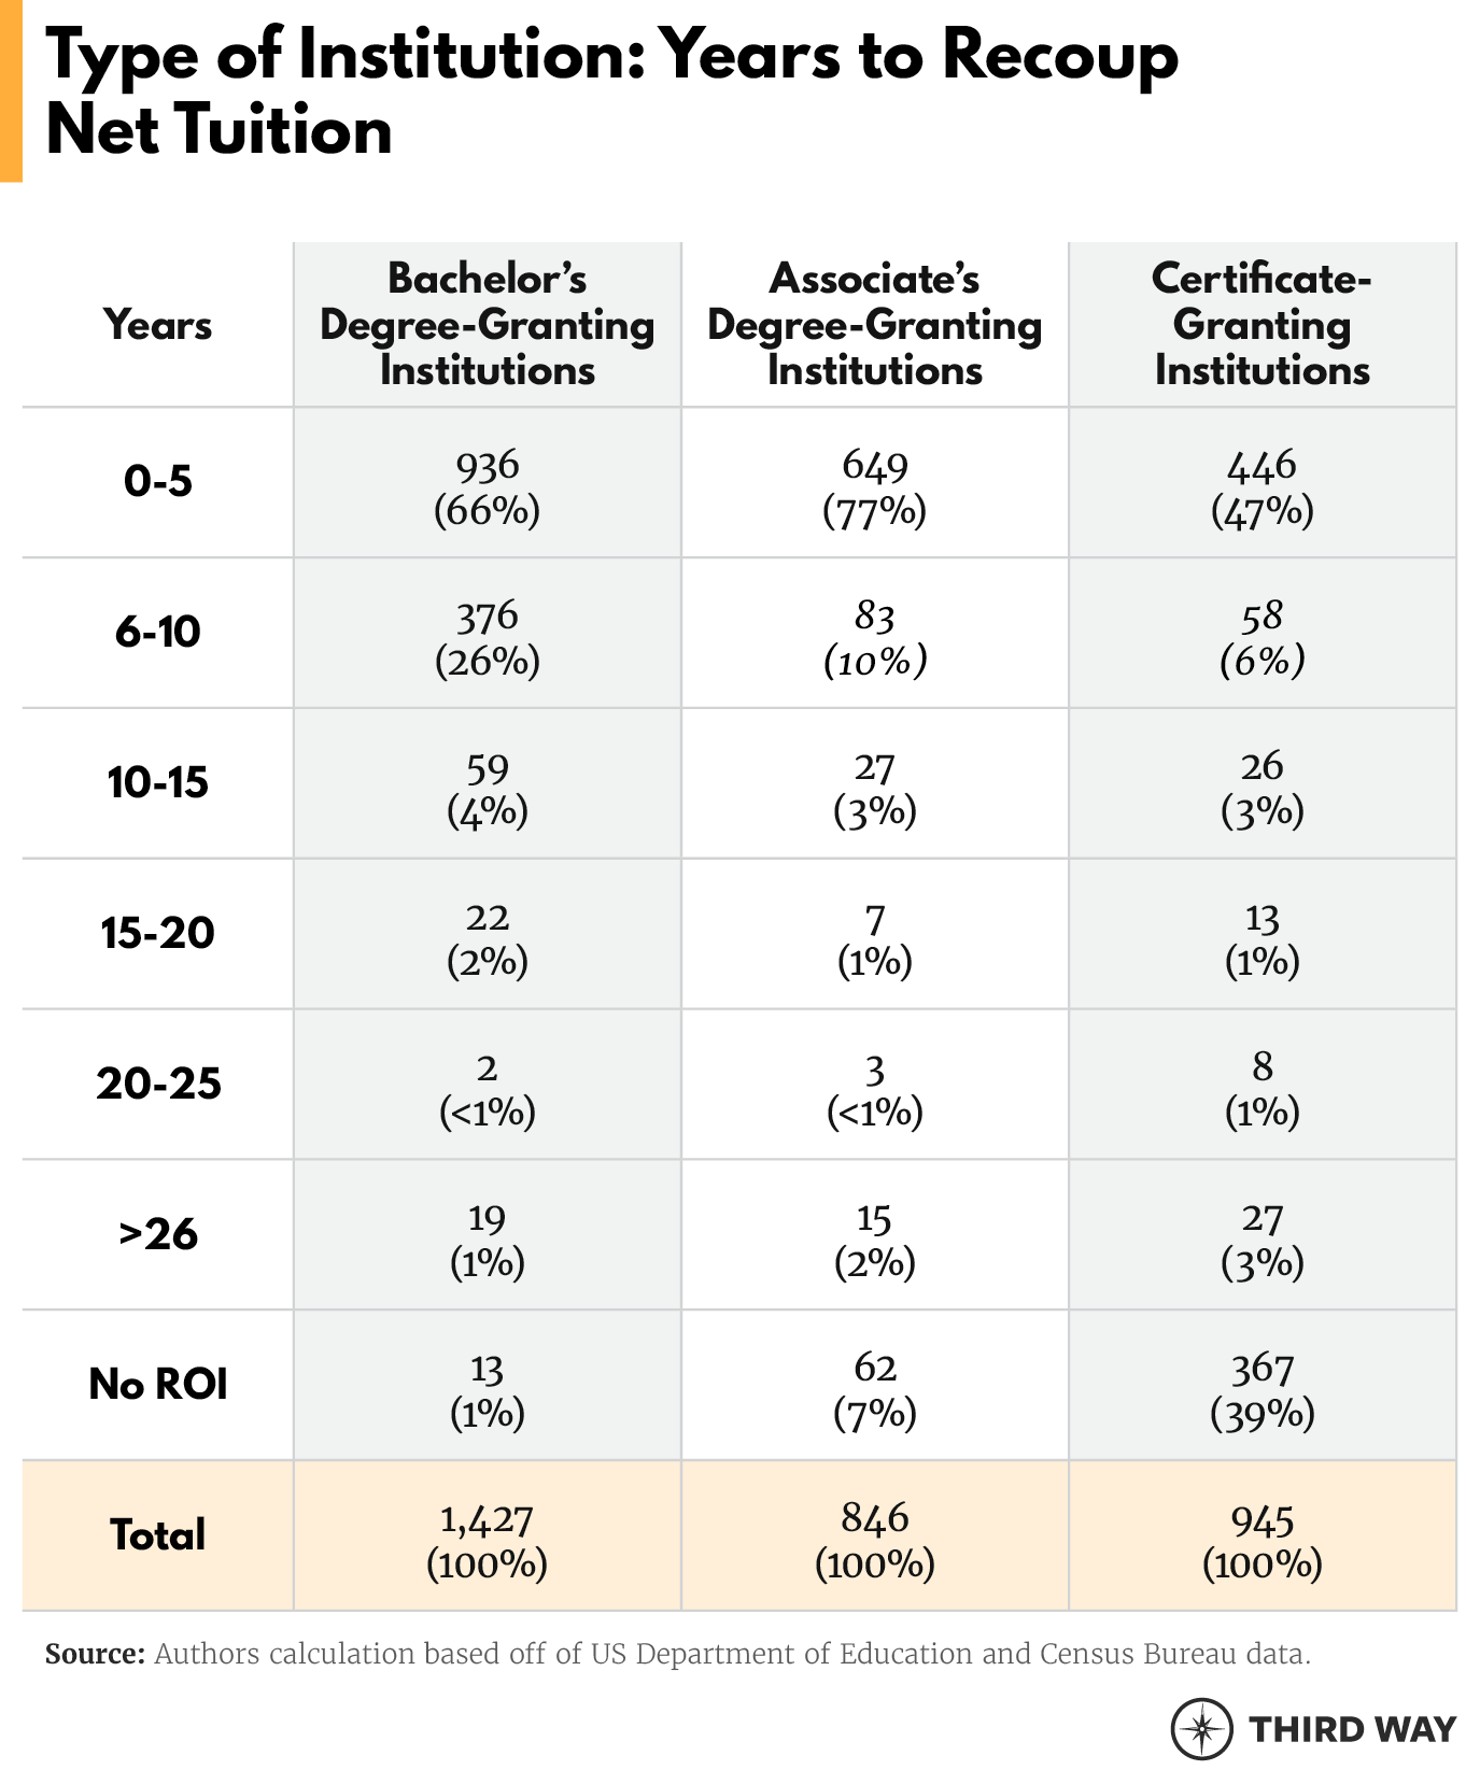
There are also differences across various types of institutions. Below, we show the PEPs for different schools based on the type of credential they award most often, whether that be a bachelor’s degree, an associate’s degree, or a certificate.
Bachelor’s Degree-Granting Institutions
While the total net price of earning a credential at a four-year institution may be more than a two-year or certificate-granting institution, the overwhelming majority of institutions that primarily award bachelor’s degrees leave their students earning a high enough wage premium to justify the out-of-pocket cost to attend within just a few years. In fact, two-thirds of four-year institutions (66%) show the majority of their students earning enough additional income beyond the typical high school graduate to recoup their total net cost within just one to five years. And more than nine out of 10 show their students able to do so within 10 years or less.
Associate’s Degree-Granting Institutions
The cost to complete a two-year degree is typically less than a four-year degree, particularly in this calculation, as we assume students are only responsible for two years of out-of-pocket costs. And while a higher proportion of two-year institutions show no ROI in comparison to four-year institutions, they are also more likely to leave their students earning a high enough wage premium to recoup their educational investment within just a few years of obtaining a credential. While 62 two-year schools show the majority of their students earning less than the typical high school graduate, three-fourths (77%) show their typical student earning enough—beyond what they would have made if they had never attended the institution in the first place—to recoup their educational investment after just five years. And nearly nine out of ten (87%) two-year schools show a similar result for their students within 10 years.
Certificate-Granting Institutions
While certificates are shorter in length and, in turn, typically cost less than an associate’s or bachelor’s degree to obtain start to finish, they are also more likely to leave their former students earning even less than those who had never attended college whatsoever. And for certificate-granting institutions that do display a wage premium for their former students, the time it takes them to recoup their educational investment is typically longer. This indicates that many of these institutions probably ask students to pay too much for their credential, leave them earning too little, or both. In total, nearly 40% of certificate-granting institutions show the majority of their former students earning less than the typical high school graduate, even 10 years after they’ve enrolled. And while nearly half (47%) show their students earning a high enough wage premium to recoup their cost of earning a certificate within five years, 35 certificate-granting institutions (4%) leave their typical student needing 20 years or longer to pay down their cost of obtaining a credential.
Conclusion
Right now, the federal government has minimal safeguards in place to ensure that students are getting a return on investment from the institutions in which they enroll.12 And while there are many takes on how to assess the “value” of higher education, prospective students have few measures that allow them to easily assess how long it will take to recoup their educational investment—or to compare those timelines across schools or programs. Providing information on the cost students pay out-of-pocket relative to the amount of additional earnings that they could expect can help them and others determine whether the economic outlay—and the taxpayer subsidy in the form of grants and loans that comes along with it—is worth the education they receive. Ultimately, the economic premium an institution provides to its students should allow them to pay down the cost of attendance within a reasonable amount of time. And if it never will, students and taxpayers should know that, too.
Appendix
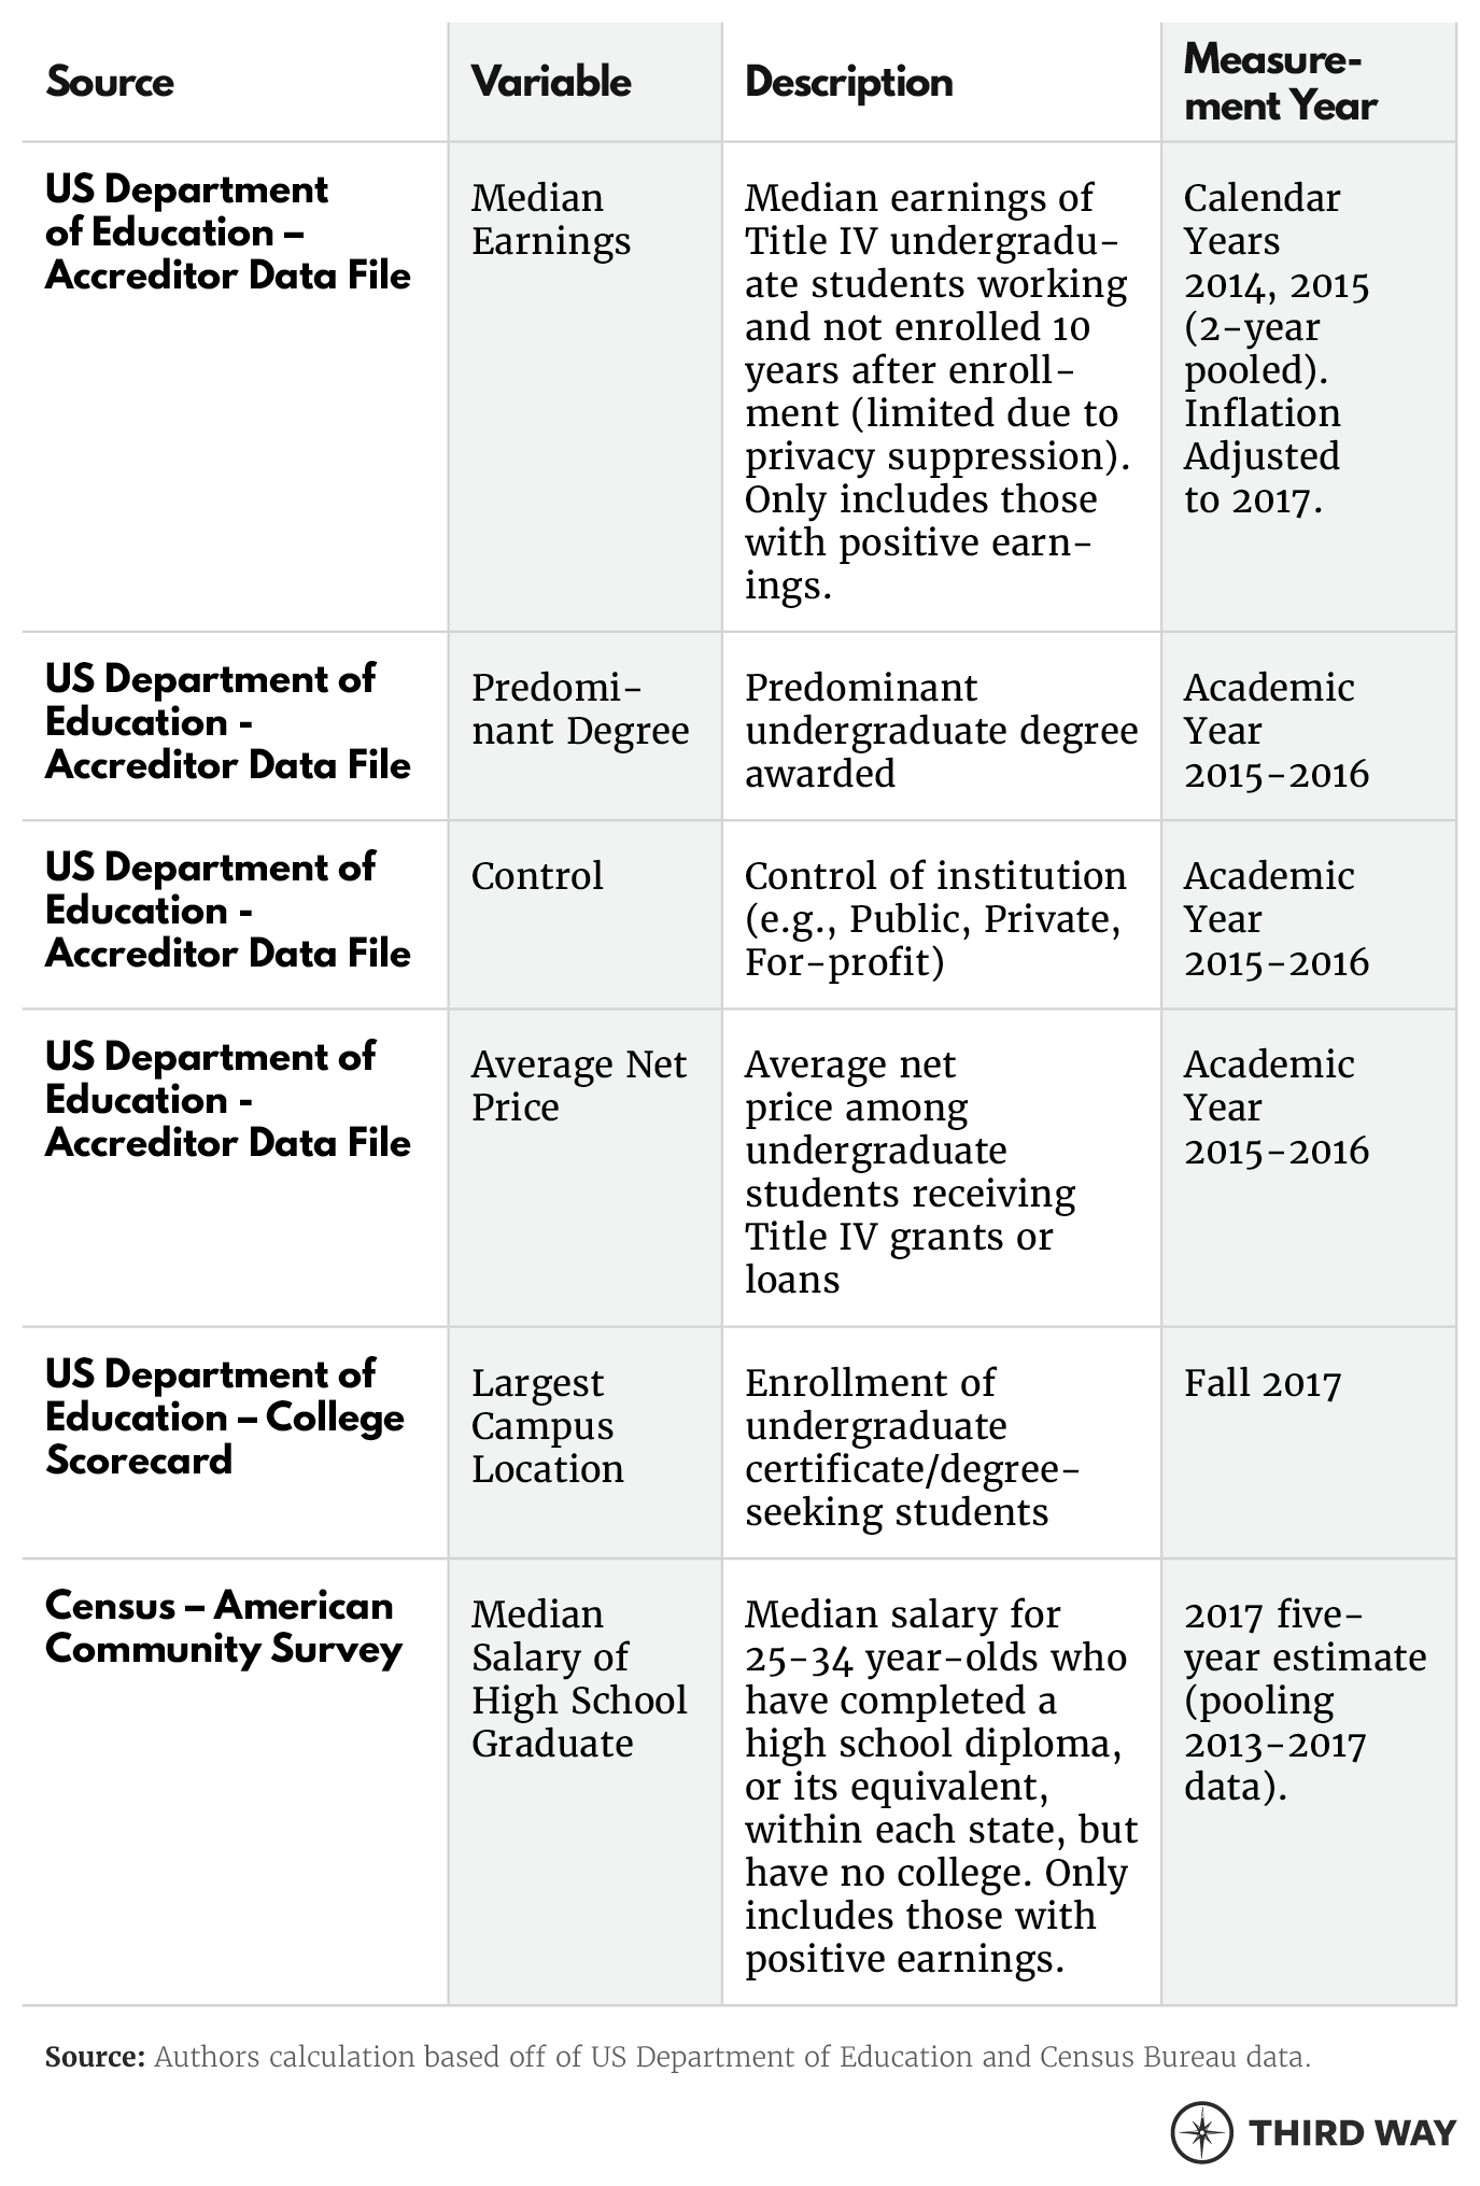
Methodology: In order to construct a PEP metric, we used several federal databases that provide education and state wage data for those who have earned a high school credential, but have attended no college. First, we used the Accreditation Data File from the Department to gather the net price and median earnings for former students.13 Out of the 5,251 institutions available within this database, 3,313 had information on, both, net price and median earnings available. Those without net price or earnings information available were excluded from this analysis.14 Institutions that resided in US territories were then also excluded.15 After these exclusions, in total, 3,218 institutions were included in this analysis.
To calculate the median salary for those who have completed a high school diploma or its equivalent, we used data gathered from the Census Department’s American Community Survey (ACS).16 We used the 2017 five-year estimate (pooling 2013-2017 data) from ACS to calculate a median salary for those who have completed a high school diploma, or its equivalent, within each state. Rather than using a national median for the typical salary of a high school graduate—which was calculated to be $24,727 within this survey—state data can better account for regional differences in earnings, as the salaries of a typical high school graduate may vary substantially between different states across the US.17 Similar to data for median salaries for high school graduates within the Department’s College Scorecard data, our analysis only includes those who have demonstrated positive earnings within the measurement years the survey was conducted. High school graduate salaries were only captured for those who were between 25 and 34 years old, reflecting earned annual income within a few years after they’ve earned their high school degree.
To determine the comparative salary of the typical high school graduate to use for institutions that have campus locations in multiple states (yet share the same six-digit OPEID identifier), we used the Department’s College Scorecard data to determine which location enrolled the most students in 2017.18 The campus location that had the highest student enrollment was used to determine the median salary of the typical high school graduate within that given state, as students were more likely to enroll at that campus than any other location. If an institution had a campus location that exclusively offered online education and that campus location served a larger number of students than any other, the national average of $24,727 was used instead of a state average. In total, nine institutions shared a unique 6-digit OPEID with the schools listed within the accreditation data file and also met these criteria.
Furthermore, within this preliminary analysis, we make several assumptions.
- First, we identify the level of institution by the credential they award most often—whether that be a bachelor’s degree, associate’s degree, or certificate—and assume that each institution only offers the specified credential, rather than a mix of credentials to its enrolled students.
- Second, we assume that it takes students four-years to earn a bachelor’s degree, two-years to earn an associate’s degree, and one-year to earn a certificate. Therefore, we multiply the annual net price by the amount of years it would take to earn a credential at each institution.
- Third, for total net price, we assume that all students who enter an institution complete a credential, even though a subgroup of students may pay less out of pocket if they enter an institution but, ultimately, leave before earning a credential.
- Finally, we assume that current net price is consistent with what students paid when entering the institution 10 years prior, aligning with the earnings measurement period that we use within this illustrative example. However, using the current net price (as we do in this analysis) may be more beneficial to prospective students searching for an institution that provides the best return on their investment.
A detailed list of the variables used can be found below.