Report Published August 15, 2024 · 14 minute read
Tale of Two Hospitals: Why Some Hospitals Succeed and Others Do Not
David Kendall & Darbin Wofford

Takeaways
Hospitals persistently spread the myth that they are losing money on Medicare in order to justify large markups to patients with private coverage. As a result, private health plans end up paying 250% over what Medicare pays for the same services, causing premiums and out-of-pocket costs to skyrocket for patients, employers, and employees.
The facts tell a different story:
- More than half of hospitals make money on Medicare.
- One-third make money on Medicaid.
- Nine percent of hospitals pad their bottom line by collecting more money for charity care than they pay out.
Hospitals can do more with the resources they have by controlling their costs and investing in their patients’ care. Two large hospitals, Duke Regional in North Carolina and Mercy Hospital Southeast in Missouri, illustrate the extremes. The first is efficient and regularly makes money on Medicare while delivering better patient outcomes and more equitable, charitable care. The second does not control its costs as well and delivers worse care at higher prices while losing money on Medicare.
Hospitals often claim to be the victims of underfunding from government programs. This ignores the fact that many hospitals are successful with government programs while delivering high quality care. Those hospitals succeed by managing their care and taking charge of their financial destiny.
A comparison of the best and worst hospitals in the United States shows how this works. Duke Regional Hospital in Durham, North Carolina ranks first among large hospitals according the Lown Institute, a nonpartisan think tank that studies the health care sector.1 Duke Regional excels at delivering high quality, equitable care at prices that fall right in the middle of all hospitals nationwide. About 700 miles to the west, Mercy Hospital Southeast in Cape Girardeau, Missouri ranks last among large hospitals.2 It gets poor grades for patient safety while charging high prices. Notably, Mercy Southeast loses money on Medicare patients while Duke Regional makes money most of the time.
In this report, we explain how hospitals make money on Medicare while investing in their patients’ care. We illustrate the possibilities through the best and worst hospitals. Finally, we show that incorrect assumptions about hospitals’ circumstances can mislead policymakers as they reform hospital financing.
This report is part of a series called Fixing America’s Broken Hospitals, which seeks to explore and modernize a foundation of our health care system. A raft of structural issues, including lack of competition, misaligned incentives, and outdated safety net policies, have led to unsustainable practices. The result is too many instances of hospitals charging unchecked prices, using questionable billing and aggressive debt collection practices, abusing public programs, and failing to identify and serve community needs. Our work will shed light on issues facing hospitals and advance proposals so they can have a financially and socially sustainable future.
How Hospitals Make Money on Medicare While Investing in Patients
During debates over health care payments, the hospital industry regularly claims government rates don’t cover their costs. Hospitals defend charging high prices to private health plans and employers as the only way to deliver high-quality, equitable care. As a result, consumers pay extra for their care and taxpayers face constant pressure to increase what they fund through government programs like Medicare and Medicaid.
A more thorough analysis tells a different story. Below, we look at hospitals that make money from Medicare payments, the high quality of care that efficient hospitals provide, and the possibilities for equitable charity care even under financial constraints.
Medicare Profitability.
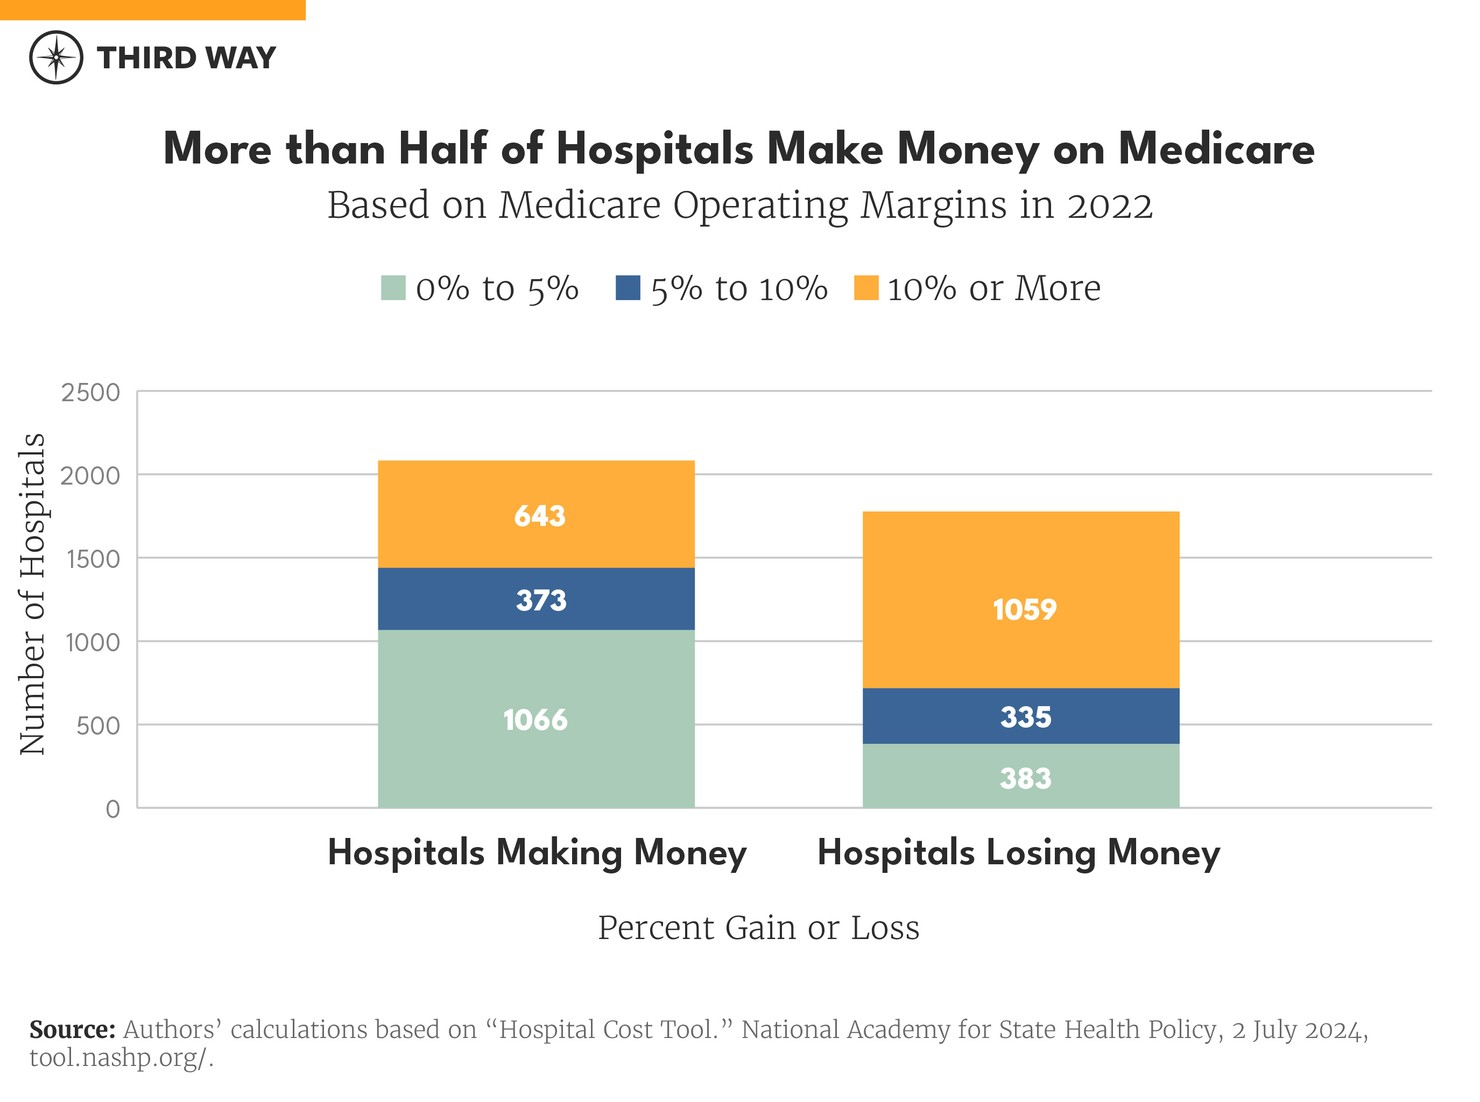
Based on financial reports by individual hospitals, 55% of hospitals made money on Medicare patients in 2022. Of those that made money, most of them made 10% or less on Medicare. In contrast, most hospitals that lost money on Medicare had significant losses of over 10% as shown in the chart below.3 A hospital’s Medicare margins comes from patients in traditional Medicare and Medicare Advantage health plans.

One key success factor for hospitals doing well financially with Medicare patients is keeping costs down. The average operating costs for hospitals that make 10% or more was $11,986 per discharge in 2022 compared to $15,704 for all other hospitals.4
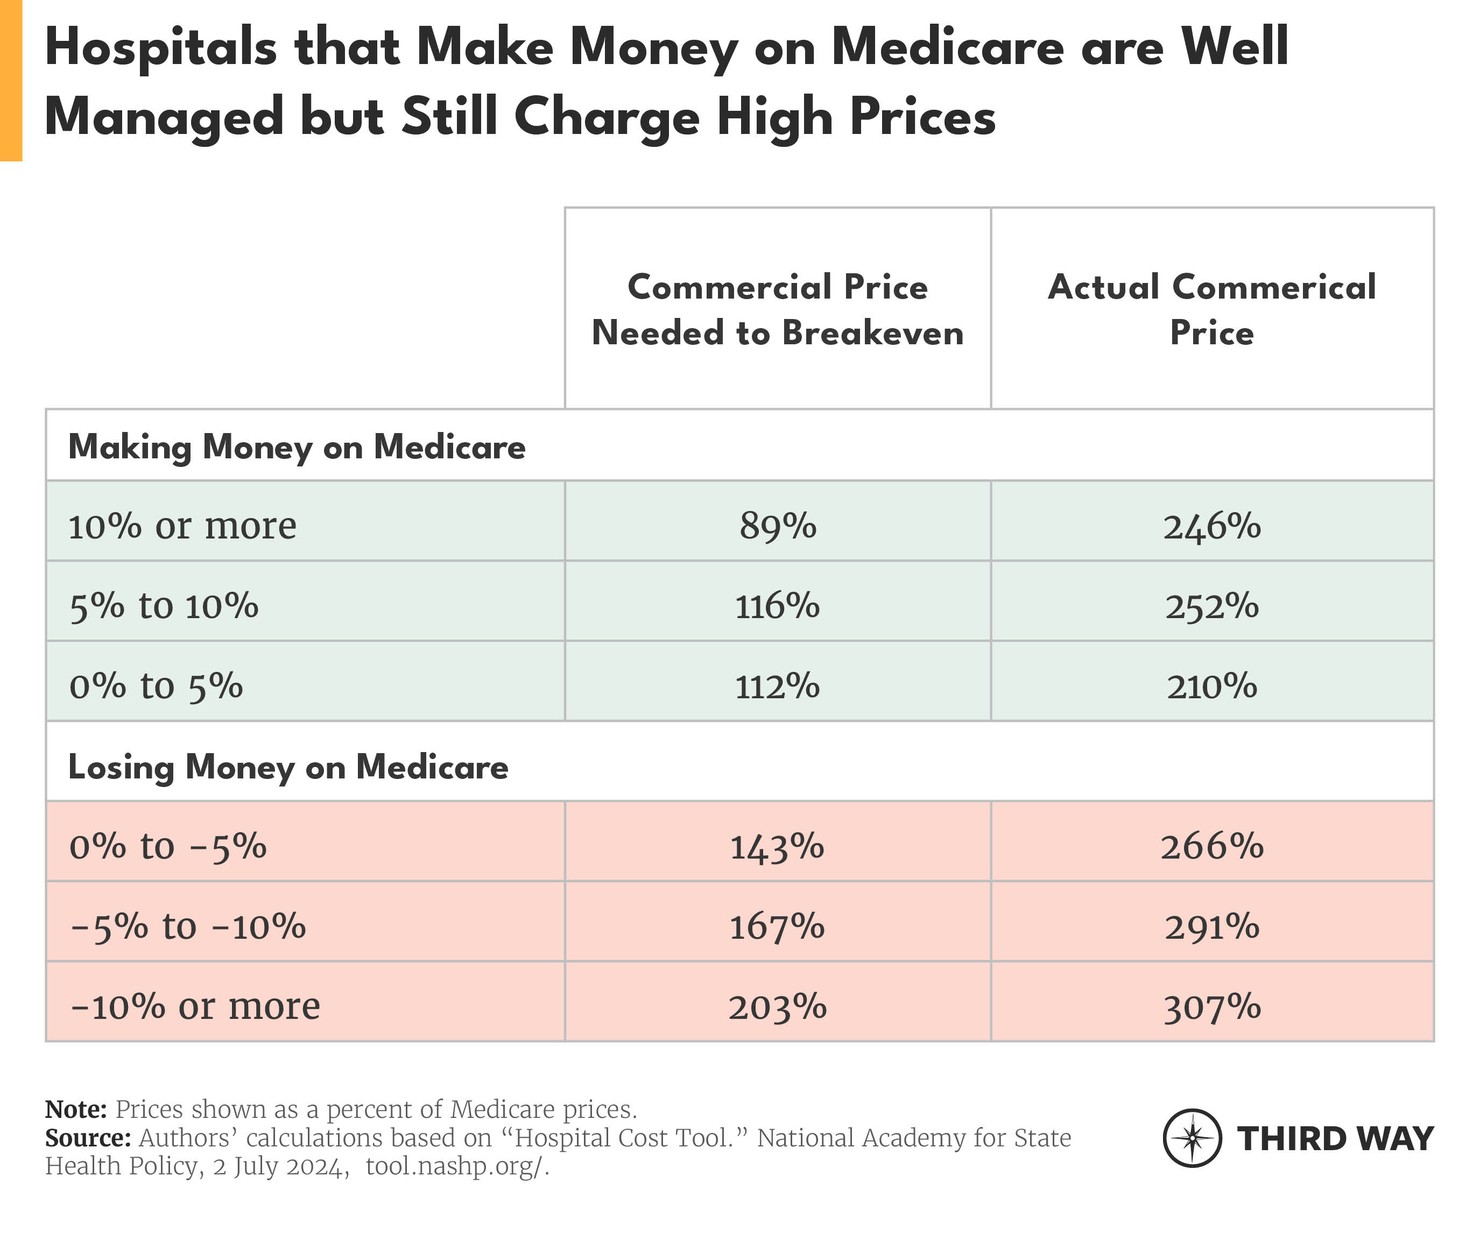
A more comprehensive measure of financial management is called the “commercial breakeven point.” It uses a hospital’s total costs and revenue to calculate the amount that a hospital must charge private health plans and employers to break even financially. For hospitals that make 10% or more on Medicare, their average breakeven point happens when commercial plans are charged 89% of Medicare rates. By contrast, hospitals that lose 10% or more on Medicare must charge commercial plans 203% of Medicare rates, as shown in the chart below. Hospitals that efficiently manage their costs and revenue don’t need to charge high prices—even though many do anyway because of the pricing power they have in their local market (also shown in chart below).

The Medicare Payment Advisory Commission, the independent agency that advises Congress on Medicare policy, explains how some hospitals end up with high costs and high prices:
When providers (particularly nonprofit providers) receive high payment rates from insurers, they face less pressure to keep their costs low, and so, all other things being equal, their Medicare margins are low because their costs are high.5
Fewer hospitals succeed at making money from Medicaid, but many do so anyway because of the efficiency and extra payments. In 2022, 32% of hospitals made money from Medicaid.6 In contrast, 60% of hospitals lost significant amounts (10% or more) from Medicaid patients.
Investing in Patient Outcomes
Hospitals that succeed in controlling costs often deliver the highest quality care for patients. That’s because managing costs and delivering patient care require the same kind of consistent attention from a hospital’s leadership. For example, research has shown that hospitals that improve their safety records also reduce the cost of care.7
One of the early leaders in bringing modern management techniques to hospitals, Dr. Gary Kaplan at Virginia Mason Health System in Seattle, Washington, said:
We feel a moral imperative to strive harder and harder on patient experience and ensure the highest quality, safest care. We think the pathway to higher quality, safer care can be the same pathway to lower cost.8
An example of the connection between high quality and lower costs comes from the Lown Institute hospital rankings. They assembled data about how many patients die within 90 days of leaving a hospital and the cost of caring for patients within that same time period. That 90-day time frame is critical because that’s when a patient is vulnerable to having a bad result from a hospital stay. Of the hospitals who ranked in the top one-third for quality of care, 93% also ranked in the lowest one-third in costs.9 Similarly, of the hospitals that ranked in the bottom one-third for quality, 69% were in the highest one-third for costs.
A final example comes from studies of sepsis, which is a dangerous condition where the patient’s body has an extreme reaction to an infection. Among the worst 10% of hospitals in Lown’s ranking, the death rate was 41%. At the top 10% of hospitals, the death rate was 29%.10 A patient’s chance of surviving sepsis and other conditions depends a lot on how well a hospital cares for them.
Providing Charity Care
Hospitals that make money from Medicare patients provide more in charity care than hospitals that lose money on Medicare. Specifically, those making money provide 2.2% of their net revenue to the uninsured or bed debt compared to 1.8% for those losing money.11
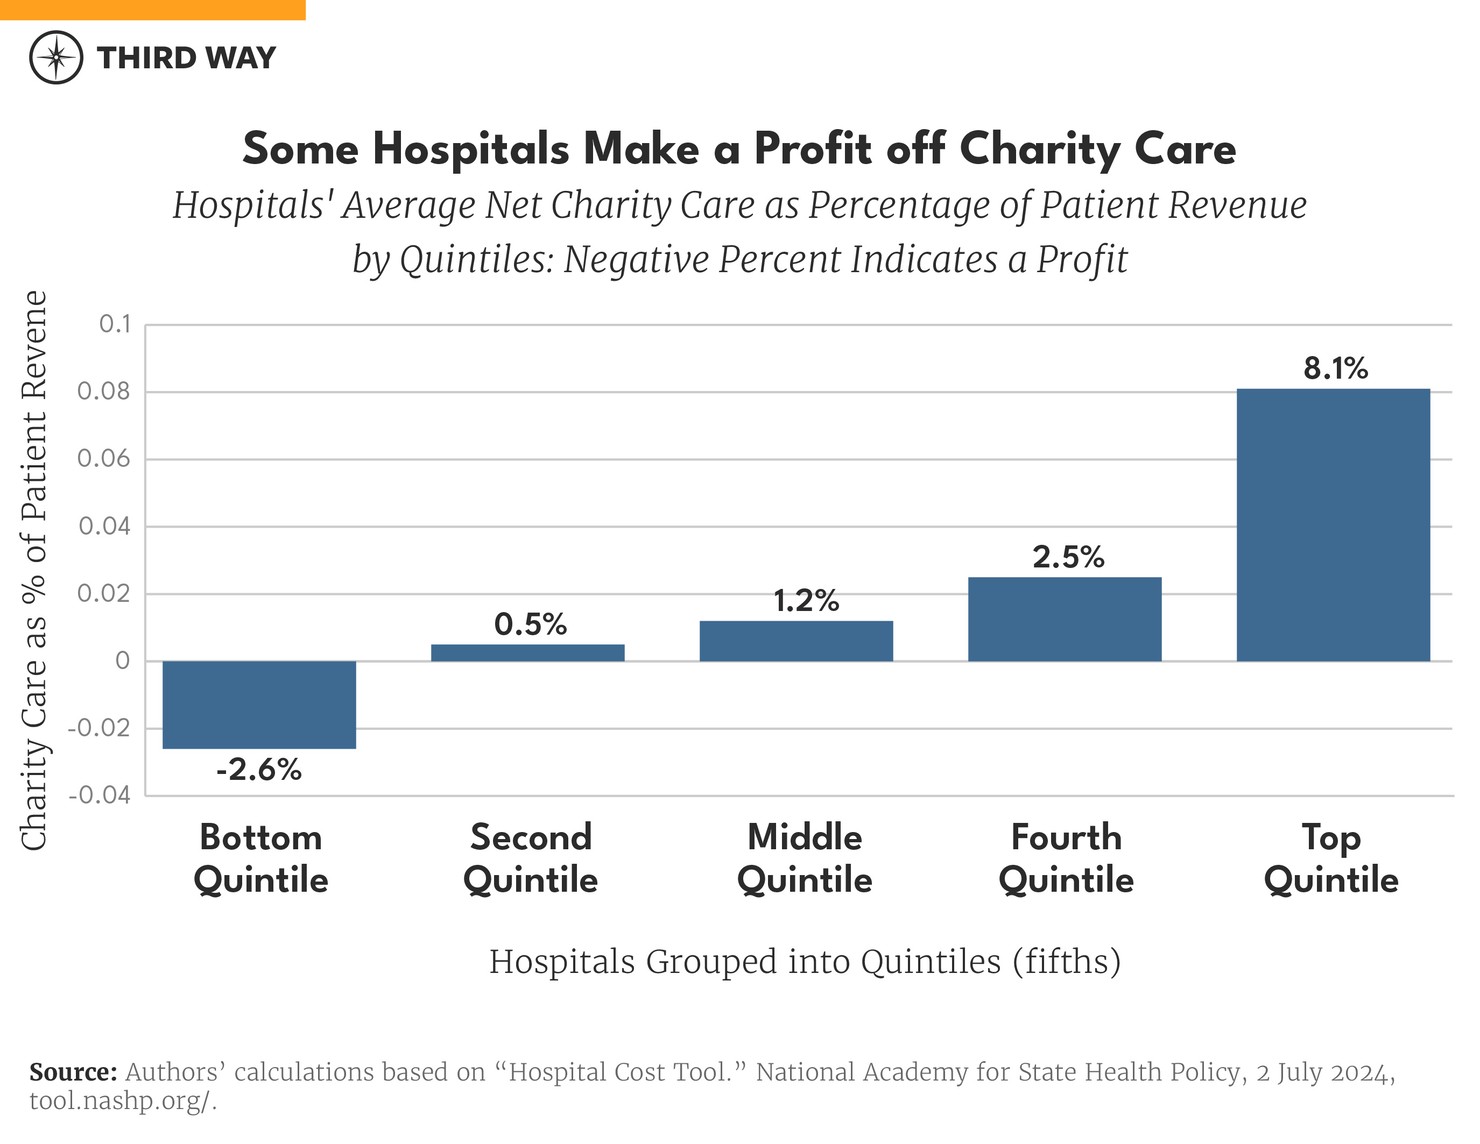
Charity care varies between hospitals. Shockingly, 364 hospitals made a profit on charity care by collecting more money for charity care from grants and patients than they paid out in charity care in 2022.12 That “profit” is a negative amount of charity in the chart below, which shows the average amount of net hospital charity care for each fifth (quintile) of hospitals from low to high amounts of charity care.

The differences between hospitals can be seen clearly in the characteristics of two specific hospitals.
Duke Regional Hospital: Doing More with Less
Duke Regional, a 388-bed hospital, has been serving the Durham region for 45 years. It began as the Durham County General Hospital, built on public land at the center of Durham County.13 The county has since contracted with the non-profit, Duke University Health System, for the hospital’s operation.14 Notably, Duke Regional has succeeded financially while also providing the highest quality care equitably and charitably.
Financial Success
In eight of the last 12 years, Duke Regional has made money or broke even in the traditional Medicare program. Its Medicare Advantage patients, who receive better benefits in exchange for a more limited network of providers, have been consistently profitable and accounts for about half of their Medicare patients. All told, the hospital has averaged a 4% profit on Medicare over the last 12 years.
Duke Regional also made money on Medicaid, CHIP, and other low-income programs in 2022.15 That year was better than most, but it has lost only 3% on low-income programs on average over the last 12 years.
It had a 35% profit on commercial insurance in 2022 because it was able to charge them 258% of Medicare rates.16 That is just below the nationwide average of 254%.17 Its breakeven point, which is the minimum amount it must charge to commercial insurance plans, was 154% of Medicare prices.
Duke Regional has also had operating profit margins ranging from 8% to 23% over the last 12 years (although it recently lost money from its non-health care operations).18 Much of this success is due to keeping its costs down. Duke Regional’s operating costs per discharge averaged $8,241 over 12 years, which is half the average of all hospitals.19
Clinical Success
Duke Regional falls in the Lown Institute’s best category for low patient deaths.20 Its rank is 733 out of 3,685 hospitals. It also gets high marks for the low number of patients that must come back to the hospital because a problem wasn’t fixed or got worse. It has a four out of five-star quality rating from Medicare.21 Duke Regional is also very good at avoiding wasteful care like unnecessary brain scans for patients who faint.22
Equitable, Charitable Care
The Lown Institute gives Duke Regional high marks for inclusion of diverse income, racial, and education demographics.23 Further, Duke Regional’s amount of charity care puts it in the top 300 of hospitals out of 4,233 hospitals in 2022. It provided 7.4% of its patient revenue for charity care in 2022.24 The median amount of charity care is 1.2%.
Mercy Southeast: Struggling Financially and Clinically
Mercy Southeast in Cape Girardeau, Missouri, is a 244-bed hospital with a nursing and health science school.25 It began as a community project built on farmland purchased by a group of business leaders and doctors and opened in 1928, serving patients in Southeast Missouri and Southern Illinois.26 In 2024, the St. Louis-based Mercy, a Catholic hospital group, purchased Southeast along with its $180 million of debt.27 It has struggled, despite being able to charge commercial insurance much more than Medicare.
Weak Financial Management
Mercy Southeast has consistently lost money on Medicare patients. Its operating margin for Medicare in 2022 was -16% in 2022, which was also what it has averaged over 12 years.28 Its costs contributed to its weak financial management. Its operating costs came in at $14,409 in 2022. That amount is about average for all hospitals in 2022 and for the last 12 years. More telling is its high commercial breakeven point at 292% of Medicare prices in 2022, which accounts for its management of costs and income.29 By comparison, the average breakeven point for all hospitals was 142% in 2022.30 It charged an average commercial price of 257% of Medicare prices but still lost 10% in 2022. It has averaged a 3% loss over the last 12 years.31 Overall, it is simply not well-managed financially.
Shaky Clinical Care
Its clinical care is also below par. It has higher numbers of patient deaths—both during and after a stay in the hospital.32 It has particularly poor outcomes with patient safety, specifically keeping patients from getting infections in their urinary tract.33 Its Medicare quality rating is two out of five stars.34
Little equitable, charitable care
The Lown Institute gives Mercy Southeast a grade of “C” for delivering equitable care. It is particularly bad at charitable care with low marks for community investment and financial assistance. It provided only 0.7% of its income for charity care.
Policy Implications
Amid the vast differences between hospitals in this country, policymakers need to look carefully at the choices of hospital leaders when weighing payments from federal programs, regulation in the commercial market, and antitrust policy. Specifically, policymakers should take two central issues into account.
First, Medicare rates can be adequate.
Spending on hospitals is the largest component of Medicare’s provider payments. In 2024, the Congressional Budget Office projected $149 billion in spending on hospital inpatient services and $68 billion on hospital outpatient services.35 Medicare’s reimbursement rates are determined by the Centers for Medicare and Medicaid Services (CMS) and are based on a variety of factors such as geography, intensity of services, patient health, and others.36 Hospitals also benefit from a slew of supplemental payments for uncompensated care, rural hospitals, and hospitals that treat a large mix of Medicare patients. Over the next 10 years, hospital payments will grow more than any other spending type in traditional Medicare.37
How hospitals decide to capitalize on these federal payments is their choice. Duke Regional Hospital chooses to be efficient with Medicare payments, and 51% of hospitals in the country do the same.38 During debates over payments in Congress, the hospital industry will claim Medicare rates are insufficient to cover their costs, but the Medicare Payment Advisory Commission and the Congressional Budget Office show the opposite.
Of the projected spending growth on providers in Medicare, hospital outpatient services are significantly higher. This is despite being much less complex than inpatient services and at a far higher cost compared to physicians providing the same services, such as drug administration, check-ups, telehealth, and labs. Right now, Congress is considering bipartisan legislation to decrease payments to hospital-owned clinics for drug administration, which is much higher than what Medicare pays to independent physicians for the same service.39
Second, commercial prices are too high due to consolidation.
Most Americans receive their health coverage through the private sector, primarily through employer-based coverage. On average, hospitals charge private health plans well over double what Medicare pays for the same services. In some states, these prices exceed three times what Medicare pays.40
Instead of rates for commercial payers being administratively set (as they are in Medicare), prices come from individual negotiations between hospitals and private plans. In order to maximize their negotiating power with health plans, hospitals often consolidate their market power to demand higher prices. This occurs through mergers and acquisitions with other hospitals, but it also occurs when hospitals acquire physician practices to deliver outpatient care. According to Department of Justice Antitrust Division metrics for competition, three-quarters of hospital markets are consolidated.41
As hospital prices rise, patients and employers foot the bill. For the majority of Americans with employer-based coverage, hospitals in consolidated markets charge 8.3% more than hospitals in competitive markets.42 As a result, employers are paying more in premium costs, reducing the amount they can contribute to wage growth and other benefits. For workers, high hospital prices in consolidated areas cause nearly $500 a year in lost wage growth as their premiums skyrocket and eat up their paychecks. Over the next decade, low- and middle-income workers are projected to lose $20,000 in wages due to rising hospital prices.43
Conclusion
Duke Regional and Mercy Southeast are representative of two cohorts of hospitals in this country: one group that chooses to be efficient with the payments Medicare provides, and the other does not. This choice not only impacts their own financial status, but it also punishes a wide swath of the US patient population with high prices and worse quality. When considering policy over Medicare rates or competition in hospital markets, Congress should reject the hospital myth that they must charge high prices because they are losing money on Medicare.


