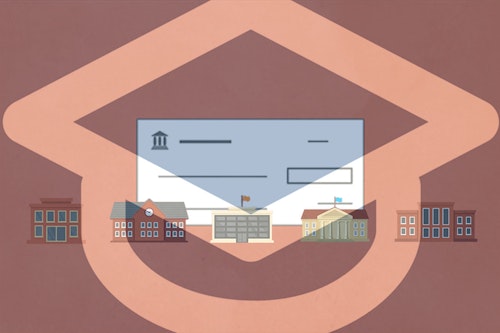
Script and sources behind the "Taxpayers' Blank Check to Higher Ed" video

Taxpayers, I think we have a problem when it comes to making sure our investment in higher ed is being well spent.
Each year, we contribute a huge amount of money to support higher education in this country. I’m talking, close to 150 billion dollars huge.1
This investment comes in the form of grants, loans, and other funds—all so that more students can unlock an important piece of the American dream: a college degree.
But what taxpayers may not realize is that for many students, this dream never pans out. And sometimes, it actually turns into a nightmare.
You see, only a little more than half of students who start college today end up graduating.2
And the rest? Well, many of them end up worse off than when they started since they’ve taken out student loans and have no degree to show for it.3
For example, did you know that there are nearly 140 colleges that get federal funding where less than 10 percent of students graduate? 10 percent.4
That means as taxpayers, we are helping to keep the doors open at colleges where students have a 9 in 10 chance of dropping out.
And without a college degree, it becomes nearly impossible for students to get the jobs they need to actually pay off their student loan debt.5
That’s why students who don’t graduate are three times as likely to default on their student loans.6
Yet last year, taxpayers sent nearly $16 billion alone to schools where three out of four students can’t repay their loans.7
So why are we letting so much money flow to colleges with such terrible track records? Because right now, we have a pretty limited toolbox to make sure our money is being spent wisely.
We need lawmakers to look at how well schools are doing so that taxpayer dollars only go to schools that improve students’ lives.
That means taking graduation rates and repayment rates into account when deciding which colleges get access to federal loans and grants.
We shouldn’t just be sending blank checks without asking for anything in return—especially since everybody benefits when more students attend colleges that help them succeed.
For more details on this effort, go to http://www.thirdway.org/education.
Endnotes
“Federal Aid per Recipient by Program over Time in Current and Constant Dollars,” Table 5, The College Board, Trends in Student Aid. Accessed March 14, 2017. Available at: https://trends.collegeboard.org/student-aid/figures-tables/federal-aid-recipient-program-over-time-current-constant-dollars; See also: “Total Federal and Nonfederal Loans over Time,” Figure 5, The College Board, Trends in Higher Education. Accessed March 14, 2017. Available at: https://trends.collegeboard.org/student-aid/figures-tables/total-federal-and-nonfederal-loans-over-time.
United States, National Center for Education Statistics, “Table 326.10.” Accessed March 20, 2017. Available at: https://nces.ed.gov/programs/digest/d15/tables/dt15_326.10.asp; Put in place through the 1990 Student Right to Know Act, the federal graduation rate only measures first-time, full-time undergraduate certificate and degree-seeking students at 150% of the expected time to graduate. This data does not include transfer or part-time students (a type of student more common today than in years past) due to federal limitations in data collection. Along with other indicators of student success, graduation rates remain useful in painting a broader picture of the value of institutions around the country.
Jason Furman, “The Truth About Higher Education and Student Loans,” The Huffington Post, July 19, 2016. Accessed March 23, 2017. Available at: http://www.huffingtonpost.com/jason-furman/the-truth-about-higher-ed_b_11060192.html.
United States, U.S. Department of Education, “College Scorecard Data,” webpage. Accessed January 25, 2017. Available at: https://collegescorecard.ed.gov/data/. See note on graduation rate collection above.
United States, Department of Labor, Bureau of Labor Statistics, “Employment Projections,” Table. Accessed March 20, 2017. Available at: https://www.bls.gov/emp/ep_chart_001.htm.
“Two-Year Student Loan Default Rates by Degree Completion Status over Time,” Figure 2015_14A, The College Board, Trends in Higher Education. Accessed March 14, 2017. Available at: https://trends.collegeboard.org/student-aid/figures-tables/two-year-student-loan-default-rates-degree-completion-status-over-time.
United States, U.S. Department of Education, “Performance Data by Accreditor,” Database. Accessed March 25, 2017. Available at: https://www.ed.gov/accreditation; To explore this question in more detail, we performed an analysis using the “Accreditor Data File” released by the U.S. Department of Education in February 2017. This database contains information on institutions and student outcomes at over 5,300 institutions that participate in Title IV federal student aid programs. It presents information, such as graduation rates, loan repayment rates, and the percentage of former students earning more than the average high school graduate. You can download a simplified version of this dataset here: http://thrdwy.org/2paCFRs; In this case, repayment rates are measured by the share of former students (both completers and non-completers) with federal loans who are able to pay down at least $1 of the principal balance within three years upon leaving the institution.
Subscribe
Get updates whenever new content is added. We'll never share your email with anyone.


