Executive Summary Published December 15, 2022 · Updated May 10, 2023 · 7 minute read
Sustainable Aviation Fuels: Flight Paths to Decarbonization
Ben Haley, Gabe Kwok, Jamil Farbes, Alexander Laska, & John Hebert

Takeaways
- Third Way has commissioned Evolved Energy Research to conduct first-of-its-kind modeling of the decarbonization pathways for the US aviation sector within the context of economy-wide decarbonization. The analysis focuses particularly on the role sustainable aviation fuels (SAF) will play in getting US aviation to net-zero by mid-century.
- The results show that getting to net-zero will take a range of technologies and fuels, and that the economic choice between biofuels and e-fuels will depend on the availability and cost of input resources (such as renewable electricity and biomass).
- The Inflation Reduction Act includes several incentives for SAF and its inputs (including clean electricity and clean hydrogen), and these incentives will tip the scales towards e-fuel production as those pathways become technically and commercially feasible into the 2030s. Biofuel production will scale up significantly in the 2040s as electrification of ground transportation frees up biomass resources for heavier modes of transportation.
- The scenarios show a large range of $1 trillion to $1.3 trillion spent on SAF production over the next three decades. SAF production will occur in every part of the country but will be led primarily by wind belt states given the overlap of abundant biomass resources and high-quality, affordable renewables.
Overview
Third Way engaged Evolved Energy Research (Evolved) in modeling potential decarbonization pathways for the United States aviation sector with a particular focus on understanding the geographic pattern of sustainable aviation fuel (SAF) production and investment under different decarbonization scenarios. Evolved has an extensive history modeling decarbonization pathways for the United States1 but this is a first-of-its kind effort to focus specifically on the aviation sector within the context of economy-wide net zero pathways in the U.S. This modeling of the aviation sector is also the first to comprehensively analyze key provisions from the Inflation Reduction Act (IRA) that influence SAF competitiveness (principally tax credits for clean electricity, hydrogen, and carbon capture) and affect the economics of aviation decarbonization in the U.S.
Evolved models deep decarbonization strategies with their best-in-class modeling suite of EnergyPATHWAYS and RIO and these aviation scenarios were all contextualized within a broader net-zero pathway for the economy as a whole. Investment and operations of the energy system are optimized with a high degree of spatial and temporal resolution across the U.S. This allows for a better representation of fundamental economics trade-offs such as synthetic electric fuels (e-fuels) vs. biofuels, which are highly dependent on the economics of feedstocks (i.e. renewable costs and availability and biomass costs and availability) as well as the economics of competing uses (e.g., using zero carbon fuels in freight trucks instead of aviation). This is a unique aspect of the modeling of the aviation sector here as compared to other analyses; it is not modeled in isolation but has to compete against other sectors for available decarbonization resources like renewable generation (to produce green hydrogen and e-jet fuel), biomass feedstocks, and captured carbon (to synthesize e-jet fuel). Further descriptions of the modeling approach used here as well as key inputs can be found in the supporting materials for Evolved’s 2022 Annual Decarbonization Perspective, which served as the foundation to this analysis.
We assess aviation decarbonization pathways using the following analytical steps. First, we assess the potential for energy efficiency, electrification, and deployment of hydrogen-fueled aircraft to change the trajectory of energy demand by energy carriers in aviation. We take a scenario approach here, informed by the literature, to develop these assumptions. Second, we optimize across the economy the deployment of resources to decarbonize this energy demand either through clean fuel deployment or offsets.
We model a representative selection of bio-conversion pathways and potential feedstocks, though the modeling does not have the specificity or spatial granularity necessary to determine the competitiveness of all biomass to jet fuel pathways.2 In addition, we model an e-jet fuel pathway that utilizes clean hydrogen and captured CO2.3
Key Findings
The key findings from our analysis indicate that:
- Comprehensive strategies are necessary for reducing emissions from aviation: biofuels, e-fuels, airframe efficiency, electrification, hydrogen, and offsets all serve as sources of reductions
- Though the ultimate economic choice between biofuels and e-fuels is uncertain, our analysis indicates a role for both, with input resource availability and costs (i.e., renewables and biomass) determining their competitiveness. In general, e-fuels are the predominant source of SAF in the 2030s due to IRA incentives for clean electricity and green hydrogen, while biofuel production largely occurs in the 2040s
- Scenarios result in a large range of $1 trillion to $1.3 trillion spent on SAF production over the next three decades. The most important determinant of the level of SAF investment required is whether aviation pursues offset strategies and the level of airframe efficiency that can be introduced into the fleet
Scenarios and Results
All modeled scenarios include base assumptions about increased aircraft efficiency and electrification that result in a reduction of overall fuel demand. With a focus on the geographic patterns of SAF and clean hydrogen deployment, we use the three scenarios described below to bound potential futures.
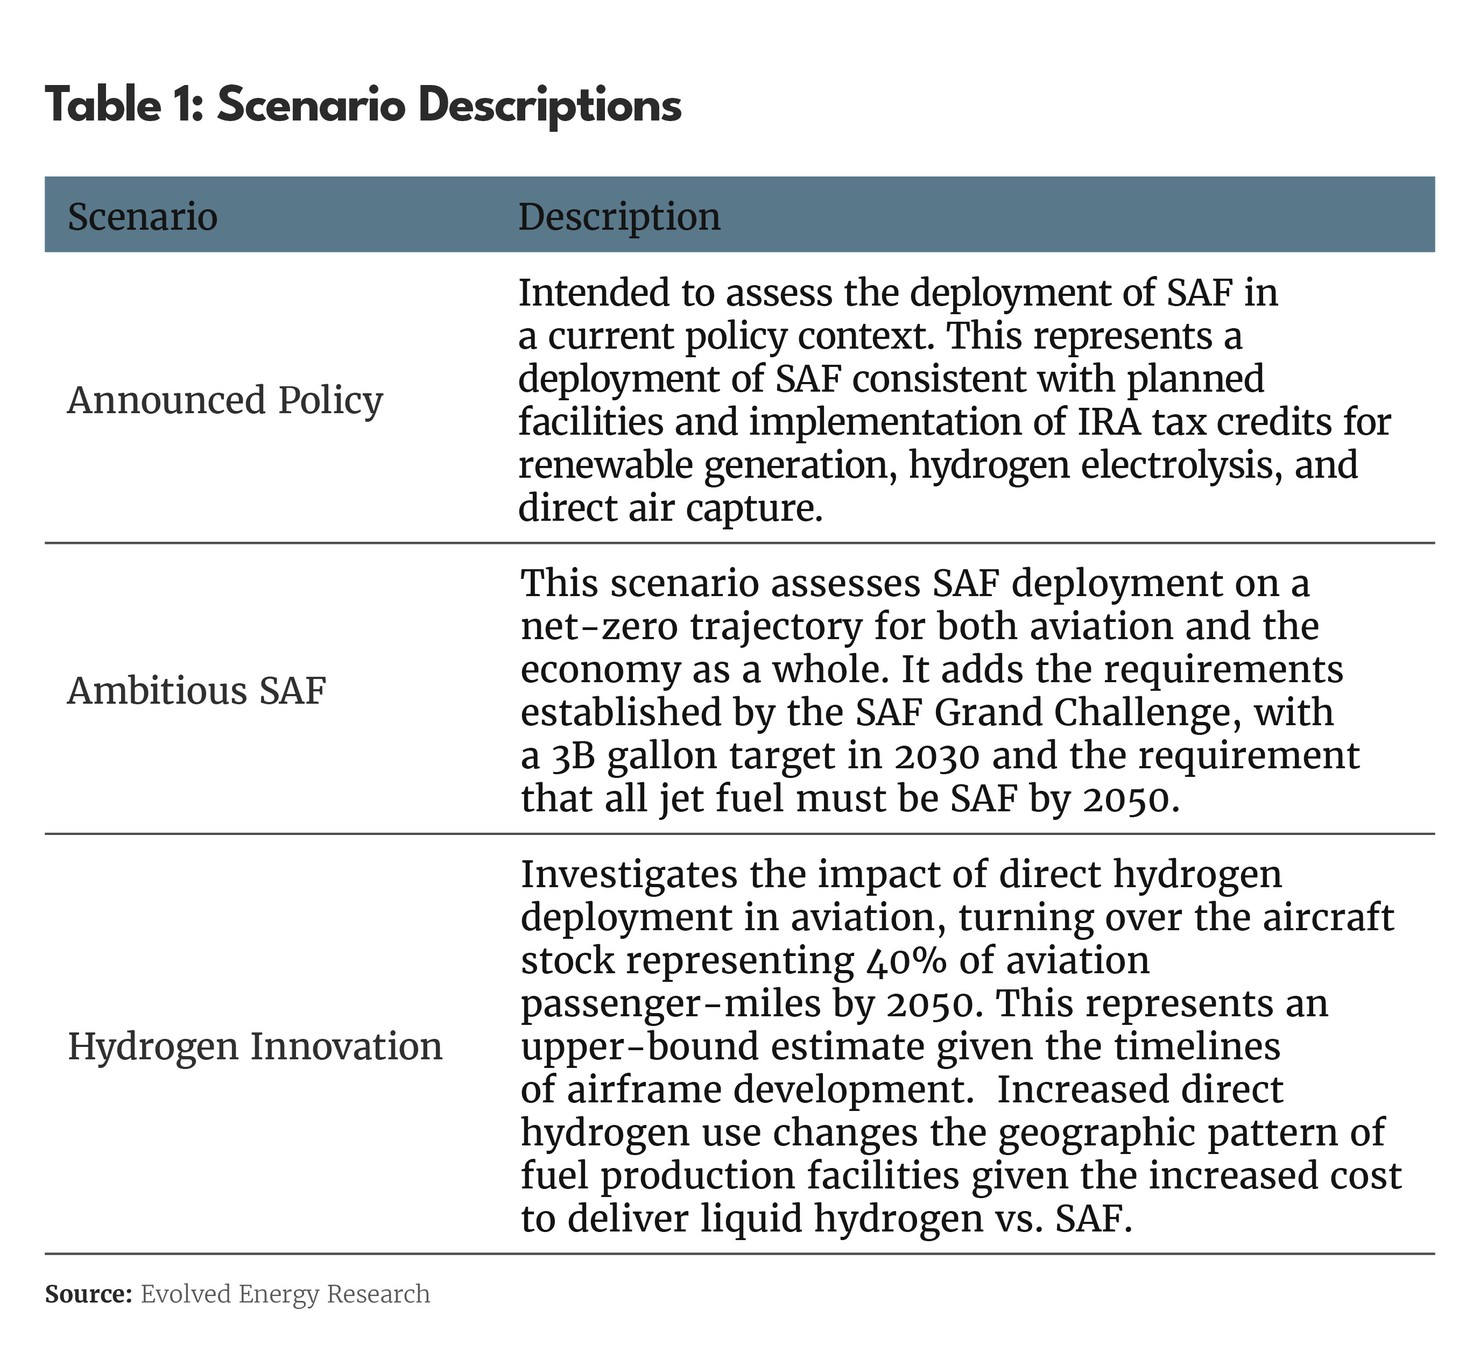
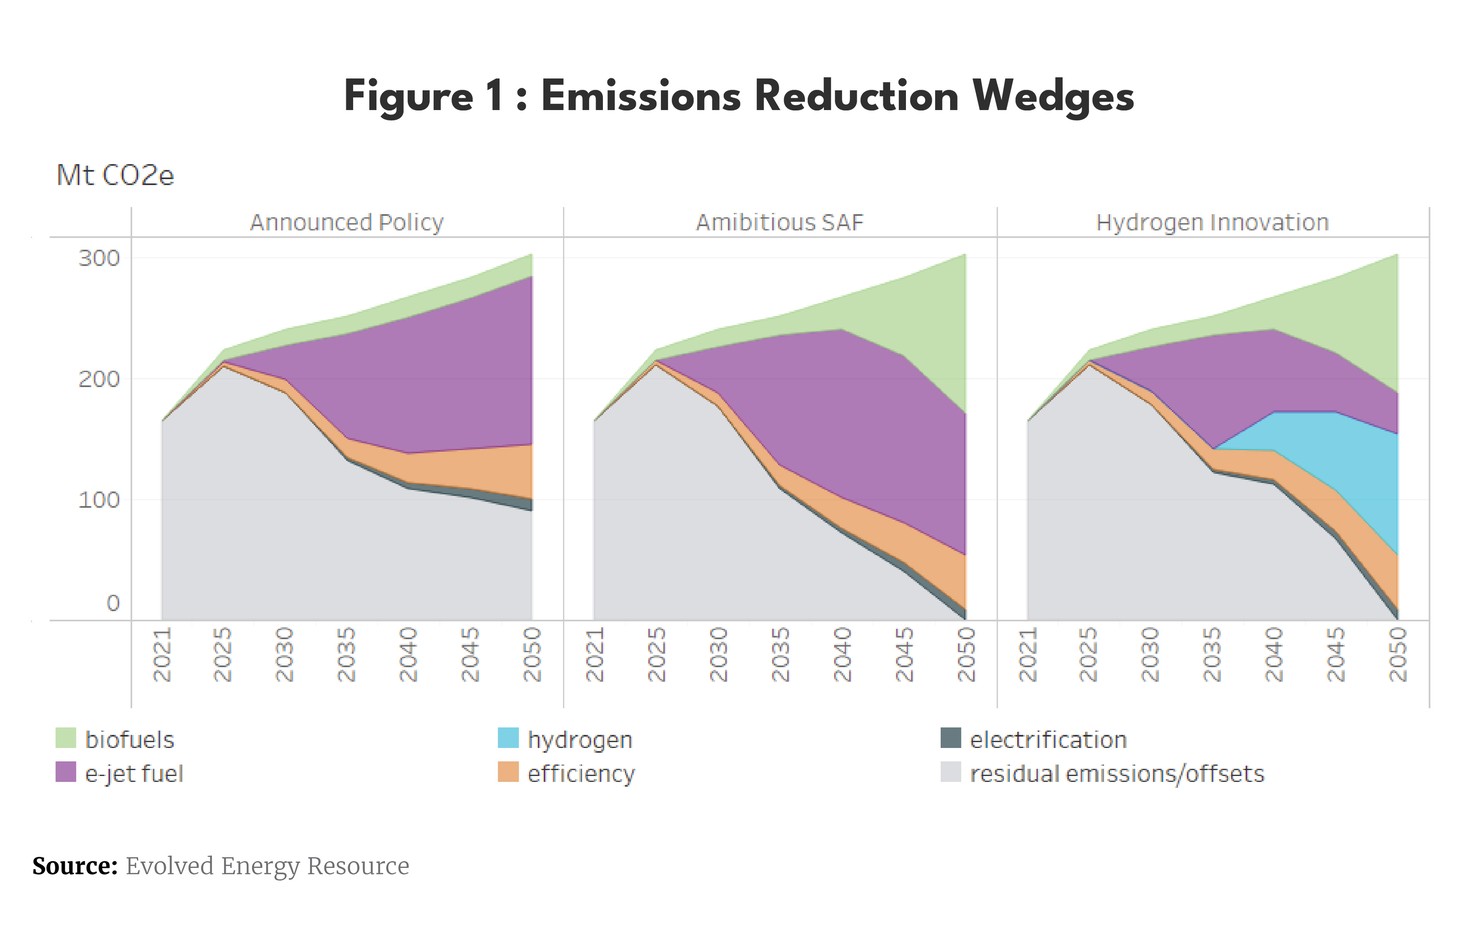
Emissions Reduction Wedges
Figure 1 below shows the contributions towards decarbonization through 2050. Efficiency grows at a steady pace over time with achievement of a 1.5% per annum improvement in passenger-mile efficiency in all scenarios (representing both airframe and engine improvements as well as operational efficiency gains), with electrification of short-haul routes showing a small reduction by 2050 (reducing fuel demand by 3% by 2050).4 The remaining wedges differ by scenario, with the Ambitious SAF scenario deploying the largest volume of biofuels and e-fuels; Hydrogen Innovation deploying the majority of clean hydrogen directly as an aviation fuel; and Announced Policy using the largest volume of offsets.
SAF Production
Figure 3 & Figure 4 show the pattern of SAF deployment temporally and spatially, with a mapping of our modeled results down to state-level production estimates. E-fuels production is concentrated in the Midwest, where an overlap of available CO2 (captured from biofuels and direct air capture facilities) and low-cost wind creates attractive economic conditions for e-fuel production. Biofuels are found in the Midwest and Southeast. Clean hydrogen is produced more locally than the SAF alternatives due to the higher delivery cost (via pipeline) of moving hydrogen as an energy carrier. This produces a broader distribution of clean fuel production in the Hydrogen Innovation scenario.
Impacts of the IRA on SAF Production
The Inflation Reduction Act (IRA) contains provisions supporting clean electricity, clean hydrogen, and carbon capture. These tax credits substantially reduce the cost of e-fuel feedstocks (e.g., H2 and CO2) and create an attractive environment for their deployment before 2035. As a result, the IRA increases the competitiveness of e-fuels instead of biofuels in the near-term, but a significant amount of biofuel production occurs in the long-term. We don’t assume the near-term SAF credits incent deployment above the planned expansion through 2027. Their relative transience compared to other tax credits is likely to minimize their impact compared to other tax credits in the IRA.
SAF Production Expenditures
We find the U.S. needing to spend up to $1.3 trillion through 2050 to build and operate fuel production facilities to serve the aviation sector in order to fully replace fossil fuels with SAF by mid-century. This includes capital investment in the fuel conversion facilities themselves (electrolyzers, Fischer-Tropsch plants, HEFA plants, etc.) as well as payments for biomass feedstocks and investment in the clean generation needed to provide electricity for e-fuels pathways. Different states and regions have a competitive advantage in different aspects of that value chain. Below, we show the top-10 states5 for production expenditures by scenario.
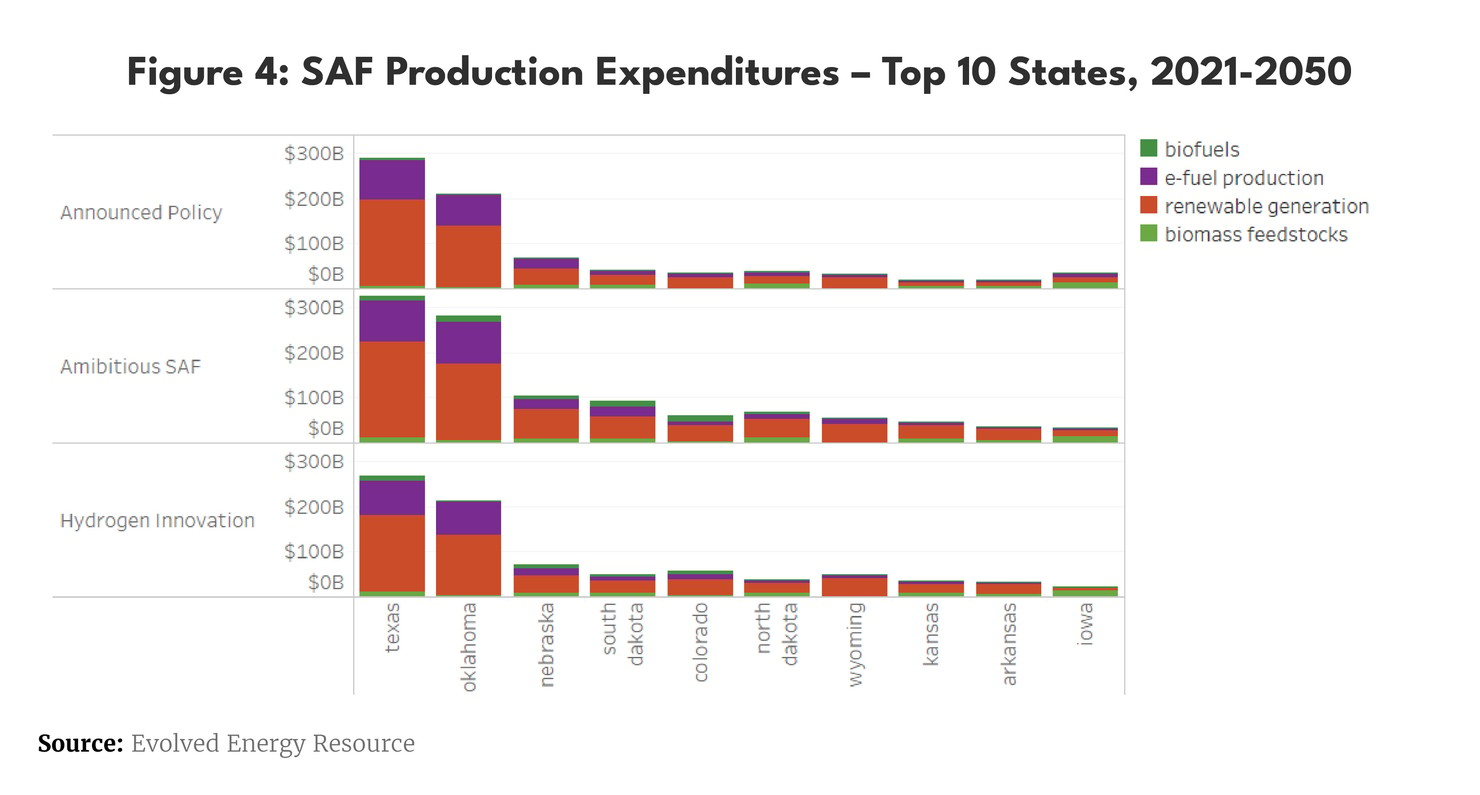
The ultimate pattern of investment may be influenced by choices reflected in the scenarios analyzed here as well as resource availability; state and local policy decisions; and technology progress. Still, this analysis provides a basic understanding of regional competitiveness of different types of SAF production. It also indicates the scale of potential resources - renewables, biomass, geologic sequestration, as well as financial - necessary to support the decarbonization of the aviation sector in the U.S.