Memo Published June 26, 2019 · 16 minute read
Eliminating US Climate Pollution: Consider the Source
Lindsey Walter
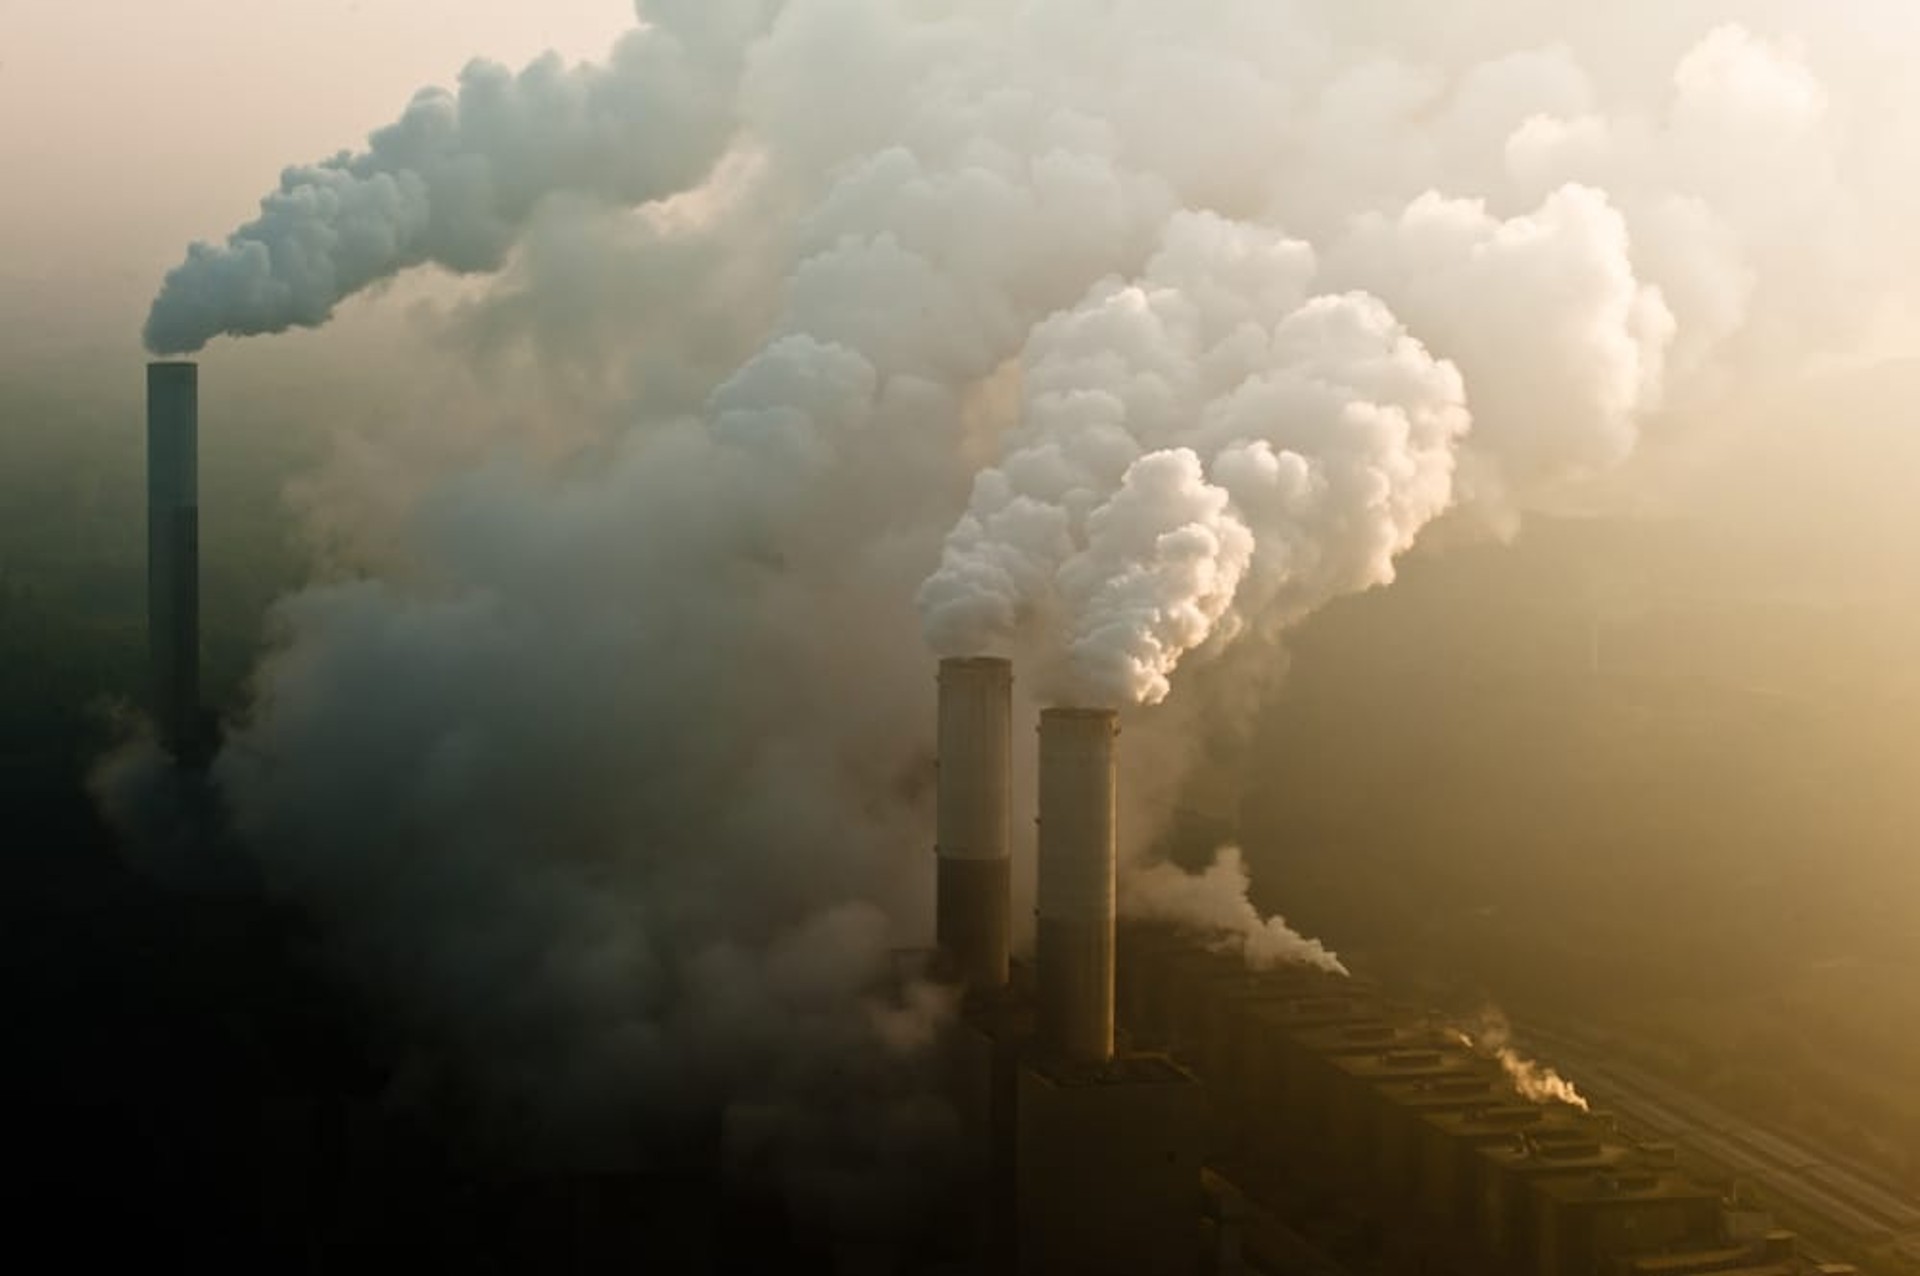
Addressing climate change has emerged as one of the top issues on voters’ minds as we enter the 2020 campaign season. There will be a lot of debate over specific plans and ambitions, but if we’re going to eliminate climate pollution -- and we believe we must eliminate it by 2050 -- it’s important to first take a look at where climate pollution comes from in the United States.
Just three sectors of the economy, power, transportation, and industry, produce more than 71% of all climate pollution. And after three years of decline, emissions are beginning to increase again in the U.S. In fact, 2018’s 2.5% increase in emissions from fossil fuels was the second biggest jump in emissions since 2000.1 Why does this matter? Because, the sources of emissions and slow pace of progress makes it very clear, we’re well beyond the time when we could pick and choose only preferred solutions to climate change. Understanding where emissions come from makes it very clear, we are going to need to use every single carbon-free technology we have to eliminate carbon pollution as quickly as possible at the lowest cost. Even then, the U.S. will still need to innovate to develop additional technologies that we do not have, but desperately need, particularly in transportation and industry. Finally, we are going to need tailored solutions for all sectors of the economy using a variety of policy levers.
This paper is intended to help provide a basic understanding of the challenge we face, so we can create the tailored, technology-inclusive policies we need to eliminate climate pollution across the economy and in each of the six major emitting sectors. Our goal here isn’t to get into specific policies (yet), but rather to explain what difference the emissions in different sectors in the economy makes and how each contributes to climate change. Any comprehensive plan to get to net-zero carbon by 2050 will need to address ALL of these emissions sources, many of which are frequently left out of the conversation.
Overview of Emissions by Economic Sector
There are seven sectors of economic activity that produce the overwhelming amount of emissions in the U.S.: power, transportation, industry, agriculture, buildings, oil & gas, and other. There is also the land use sector (LULUCF,) which actually removes carbon pollution from the atmosphere. Transportation is slowly overtaking the power sector as the largest source of emissions (both around 27%), with the industrial sector coming in third at around 17%.2 Total US emissions actually increased in 2018 by 1.5% to 2.5%, according to Rhodium Group’s final 2018 assessment.
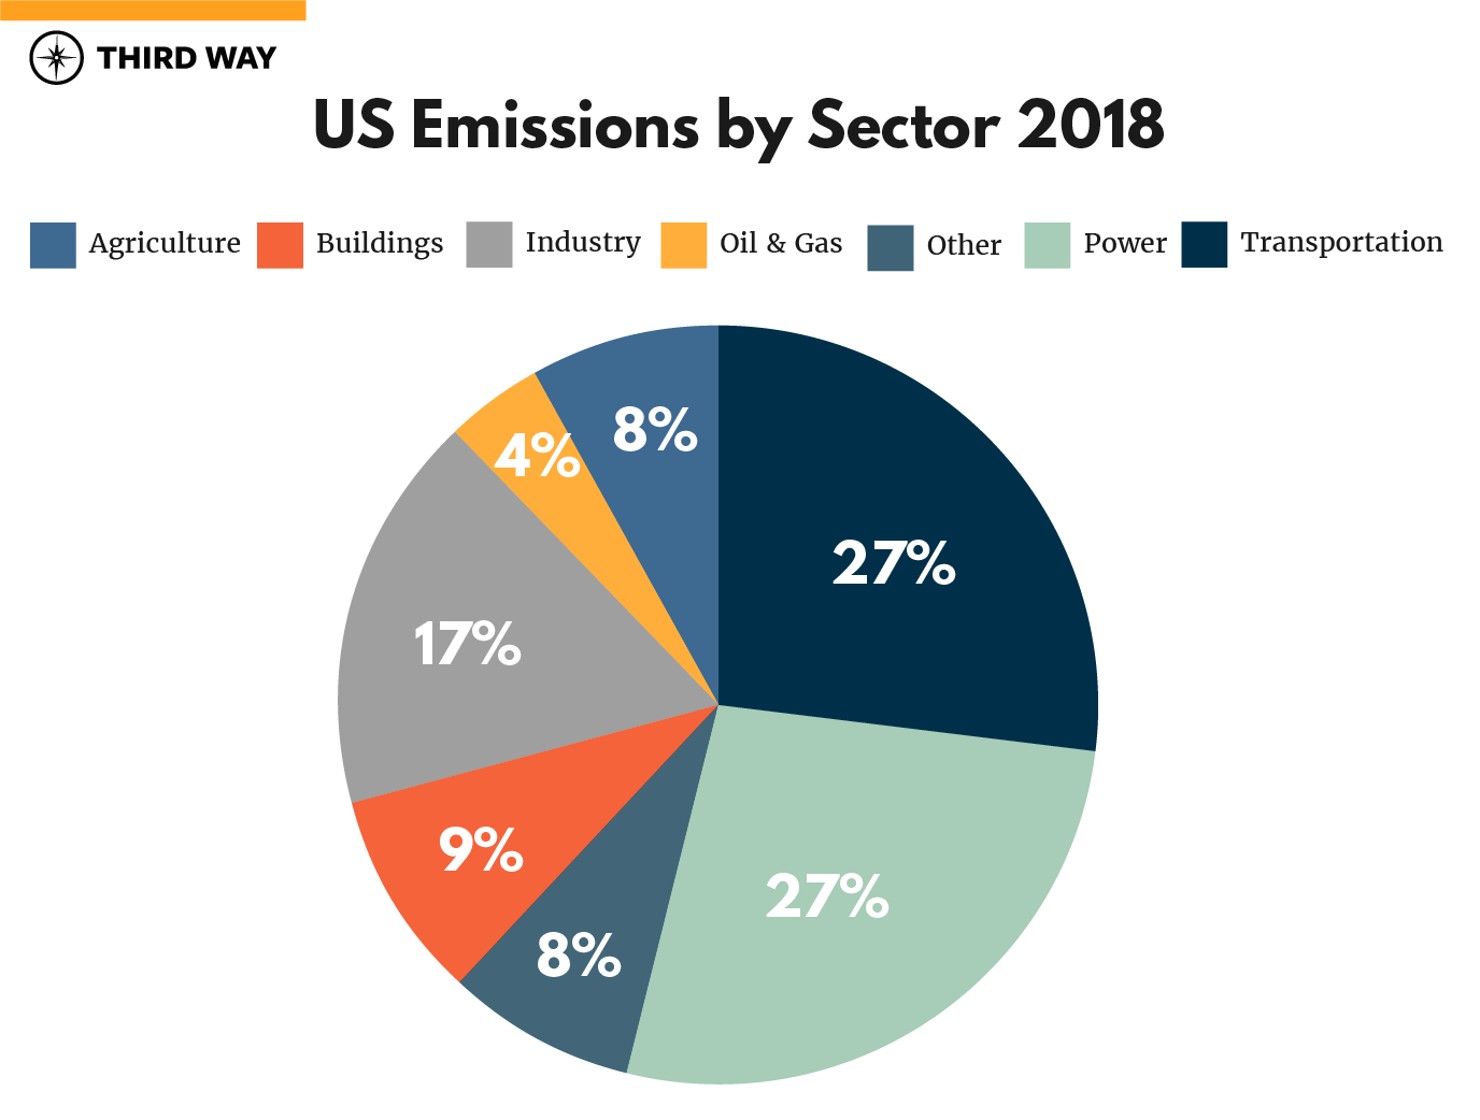
Figure 1: Share of US emissions by sector in 2018 (Data Source: Rhodium US Climate Service).
Definitions of Economic Sectors
Power: Electricity generation produced by either zero-carbon technologies including solar, wind, hydropower, and nuclear power, or power plants using natural gas, coal, and (to a small extent) oil.
Transportation: Operation and maintenance of powered vehicles, including light duty (cars, SUVs, and pick-ups) and heavy duty (tractor-trailers, delivery vans, busses, and construction) vehicles, trains, airplanes and helicopters, and river- and ocean-going vessels.
Industry: Manufacturing processes, including factories, production of chemicals, steel, cement, and other commodities, and the refining of resources like petroleum or natural gas.
Agriculture: Growing and harvesting of crops and raising livestock.
Buildings: Operation, including heating and cooling, of commercial and residential buildings.
Oil & Gas: The extraction and production of oil or natural gas.
Other: Any other economic activity that contributes to climate change-causing pollution.
Land Use: Full name land use, land-use change, and forestry (LULUCF). Activities that result in the release or biological sequestration of carbon dioxide in plants, solids, and dead organic matter.
While the transportation and power sectors are currently larger than the industrial sector, the gap between them is closing. As you can see in the figure below, industrial emissions (yellow line) are predicted to significantly increase. In fact, the industrial sector is predicted to grow by 23% through 2050. In comparison, transportation and power sector emissions are predicted to decline by 6% and 2%, respectively.
Figure 2: US emissions by sector in million metric tons of carbon dioxide equivalent. (Data source: Rhodium US Climate Service)
More than 70% of emissions in the US come from just three sectors of the economy.
More than 70% of emissions in the US come from just three sectors of the economy. While the power sector tends to get the most attention from policymakers, it is time to give equal thought to transportation, now the largest source of emissions in the country, and industry, which will soon be the fastest growing contributor to climate change. Fully eliminating emissions also requires us to look beyond the big three and address all sectors in turn.
Power
The power sector includes all of the activity involved in generating electricity. Historically, it has been the US’s largest source of carbon pollution, as most electricity came from burning coal. Particularly over the last decade, this is changing. Beginning in 2016, plummeting natural gas prices enabled it to surpass coal as the most prevalent fuel used to generate electricity. Now, coal is around 31% of electricity generation and 71% of emissions for the power sector, while natural gas is around 32% of generation and 26% of emissions.3 Nuclear power remains our largest source of carbon-free electricity, with wind and solar providing a growing amount of clean energy, along with hydro power, which has only limited growth potential.
Now, coal is around 31% of electricity generation and 71% of emissions for the power sector, while natural gas is around 32% of generation and 26% of emissions.
Figure 3: Power generation in million kilowatt hours by each source. (Data source: Rhodium US Climate Service)
Eliminating emissions from the power sector will require replacing coal and natural gas with zero-carbon resources. In 2017, there were 359 remaining coal power plants.4 We already have the technologies to replace an enormous amount of fossil fuel electricity generation with wind, solar, nuclear power, within-day battery storage, and efficiency. That, however, does not get us to zero.
To do this, the US needs to innovate and develop additional cost-competitive tools. For one, we are lacking grid-scale batteries that can sufficiently deal with the intermittency issues of renewables, particularly when solar or wind are unable to produce energy for a long period of time (days or weeks). Natural gas and flexible nuclear power can compensate in the short term while we continue to develop new and improved batteries that can store electricity at a low cost for longer periods. In the long run, however, natural gas will need carbon capture and storage technologies if we want to reach net-zero emissions. This need for a reliable, consistent source of carbon-free energy could also be addressed in the future with emerging technologies like advanced geothermal and advanced nuclear, which would require additional research and support to be commercialized by 2030.
Decarbonizing the power sector will also help reduce emissions from other sectors as well, particularly as we continue to electrify things like vehicles and heating systems. If the emissions from electricity use were distributed to end use sector, then the share of emissions from electricity by sector would be 56.7% for industry, 0.3% for transportation, and 72.1% for buildings.
For more on the power sector, check out Carbon Brief’s great explainer.
Transportation
The transportation sector is quickly becoming our largest source of greenhouse gas emissions in the US. It’s also trickier to eliminate emissions in transportation than in the power sector. That’s because instead of replacing a relative handful of power plants owned by large, regulated companies, we have to deal with millions of privately-owned cars and light-duty trucks, as well as fleet vehicles like delivery trucks, tractor trailers, and buses, and airplanes, ships, and trains owned by thousands and thousands of private companies, municipal and state governments, and the federal government. The light-duty vehicles (pickups, SUVs, and cars) most Americans own are responsible for the largest chunk of transportation emissions (59%) as shown in the figure below.
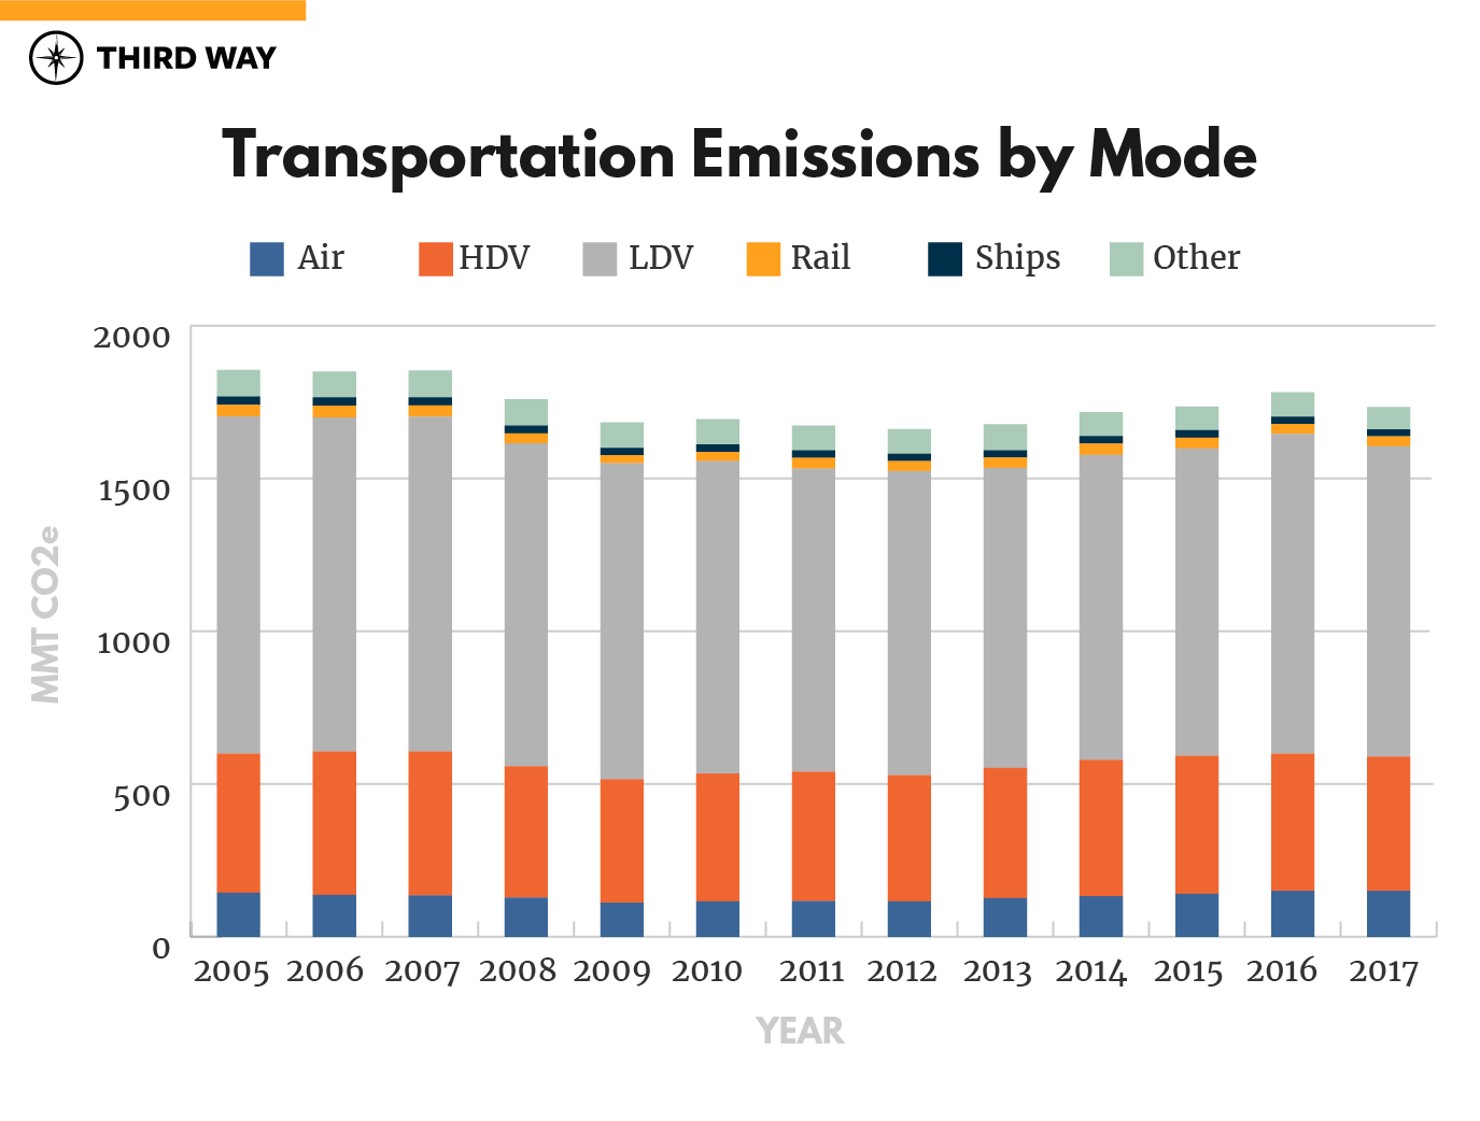
Figure 4: Transportation emissions in million metric tons of carbon dioxide equivalent by mode. (Data source: Rhodium US Climate Service)
There are approximately 250 million gasoline-powered light-duty vehicles in the US today. To eliminate the carbon pollution these vehicles emit, we will need to innovate net-zero carbon liquid fuels, such as net-zero carbon biofuels, that can replace petroleum-based gasoline and run in existing engines and replace gasoline-powered vehicles with new SUVs, pickups, and cars powered by electricity or hydrogen. That takes time. The average fleet turnover rate is around 20 years. That timeline could be shortened if we are willing to buy up or incentivize scrapping of a large share of on-road vehicles.
At any rate, we need to start selling a much larger share of zero-emissions vehicles now. In 2018, almost 88,000 electric vehicles were sold in the US, only 0.5% of new sales. If we wanted all new sales to be electric vehicles within the next 10 years, then the percent of new vehicles sold that are electric would need to increase by around 9% every year. Any significant increase in zero-carbon vehicle powered by electricity or hydrogen will also require an extensive build-out of charging or refueling infrastructure.
The remaining transportation sources of carbon pollution come from medium and heavy duty vehicles (25%), air (9%), rail (2%), ships (1%), and other sources (4%). Addressing these sources will require a broader variety of policies and technologies. This includes investment in innovation to develop batteries that have sufficient capacity and are lightweight and cost-effective enough to use in vehicles, mode shifting where cleaner sources of transportation replace more carbon-intensive, and development of new fuels, particularly for air and maritime travel.
Perhaps the most important issue often left out of the conversation is how we design and build communities. In too many areas -- rural, suburban, and even urban -- people don’t have an affordable alternative to using their car, truck or SUV to get from their home to work or school, and for every errand they run. As a result, people are spending more time behind the wheel, and driving more miles and enduring more traffic every day; and emitting more carbon pollution.5 Changes in planning, zoning, and transportation funding could help immensely by providing people in every type of community (rural, suburban, or urban) the option to drive or walk, bike, or take public transportation to get where they need to go. This would not -- and should not -- eliminate Americans’ option to drive. It could give them more choices, and also take a significant bite out of the miles people travel in vehicles and, ultimately, carbon pollution.
For more on the transportation sector, check out C2ES’s report.
Industry
Industrial emissions come from any industrial or manufacturing process. This is a critically important sector. While in 2018 it ranked third behind both transportation and power in the US, emissions from industry are predicted to grow by 23% over the next thirty years.6 This would make it the fastest-growing sector for emissions in the US economy.
Emissions from industry are predicted to grow by 23% over the next thirty years.
Around 77% of industrial emissions comes from the combustion of fossil fuels like natural gas and petroleum for process energy (for example, heating for furnaces, kilns, and dryers).7 These emissions can be broken down into more than a dozen different sub-sectors. Chemicals and refining are the top two emitters, and iron and steel rank third. The wide variety of activities in this sector makes it particularly challenging to understand, let alone develop a set of strategies to eliminate emissions.
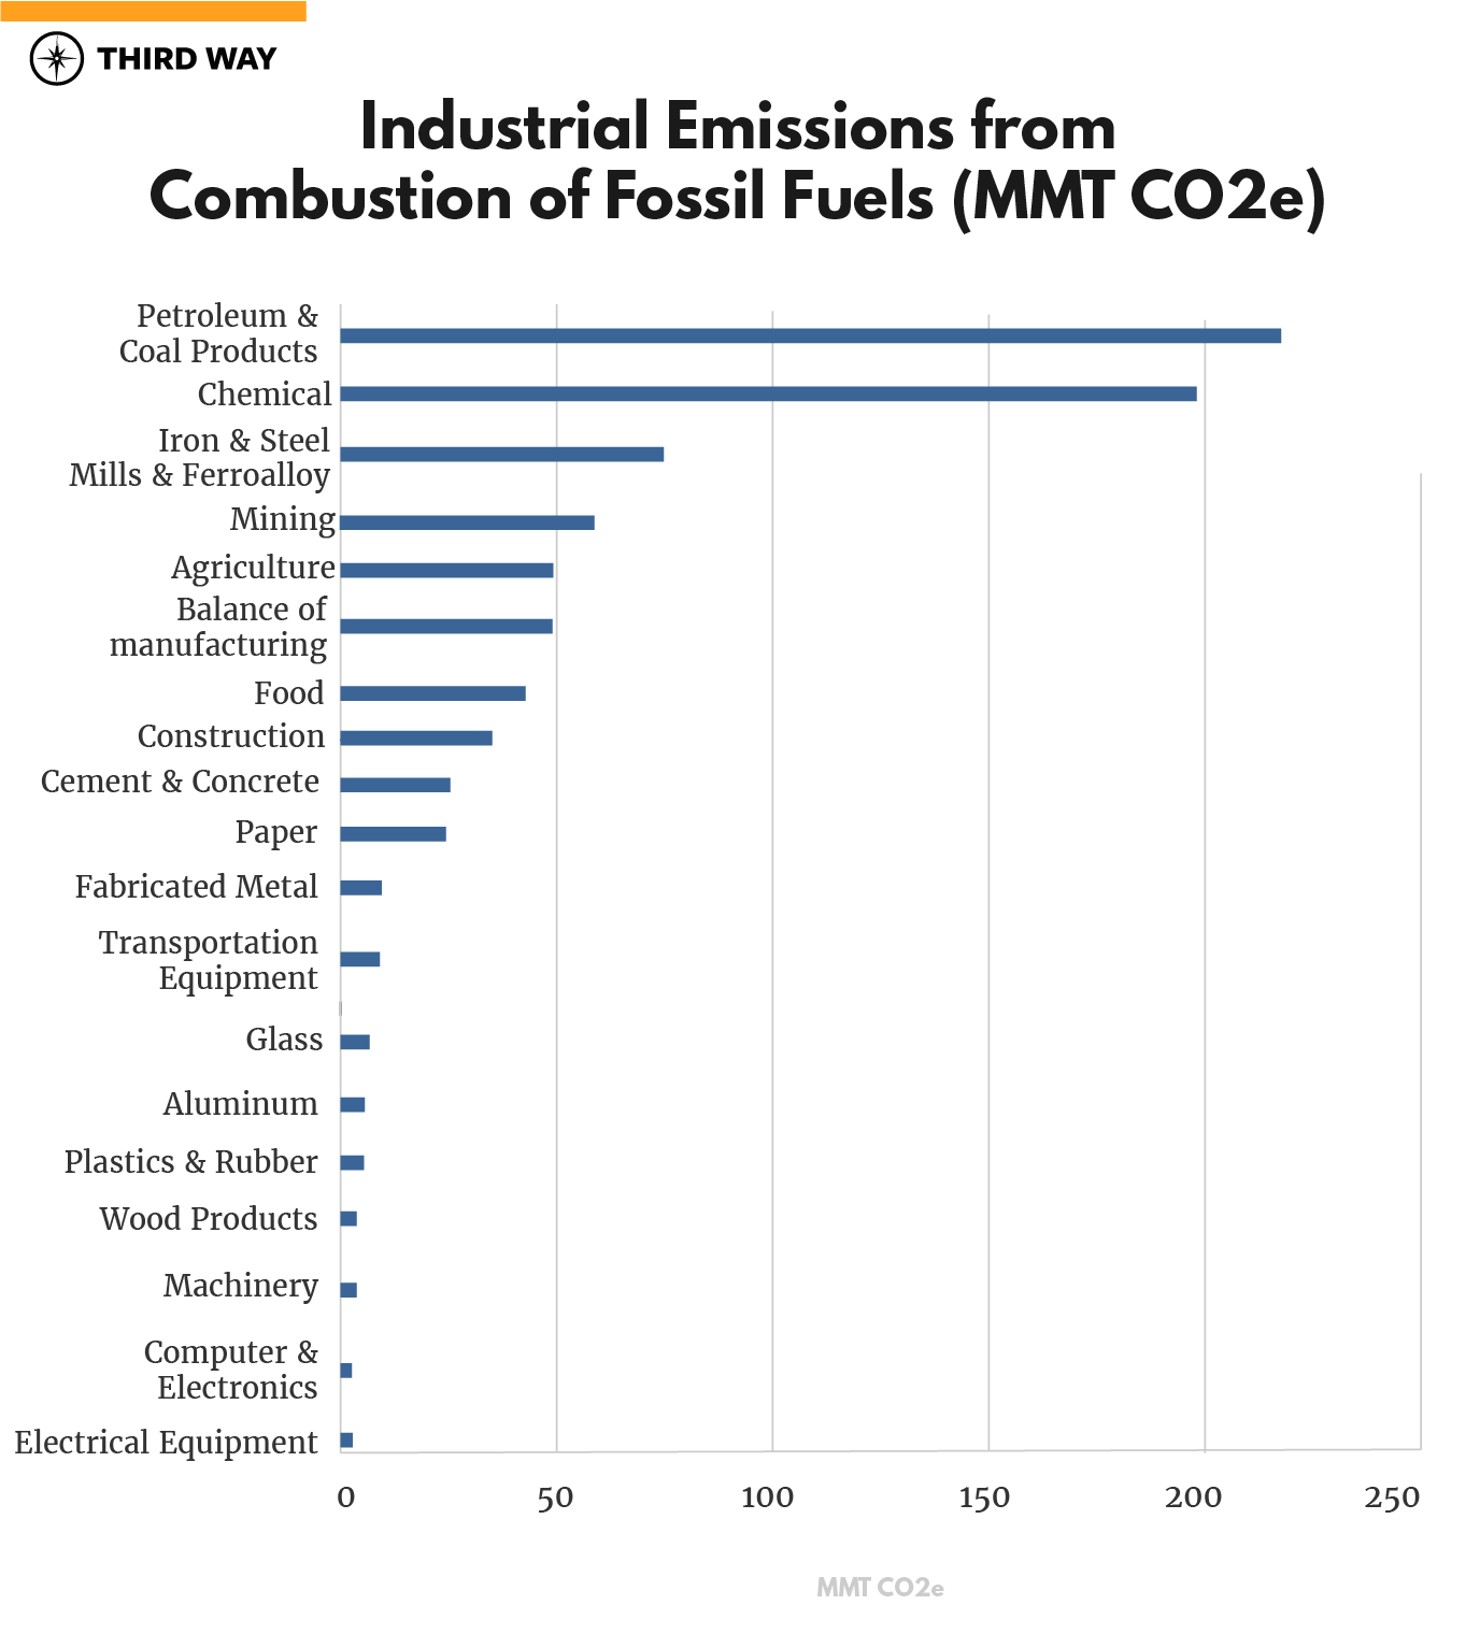
Figure 5: Industrial emissions from the combustion of fossil fuels in million metric tons of carbon dioxide equivalent in 2017. (Data source: Rhodium US Climate Service)
The remaining 23% of industrial emissions come from 1) chemical reactions that occur when raw materials are transformed into products (for example, cement and ammonia),8 and 2) the production and use of hydrofluorocarbons (HFCs), highly potent GHGs used in refrigeration, air-conditioning, aerosols, and foams.9 These emissions are broken down by greenhouse gas and subsector below.
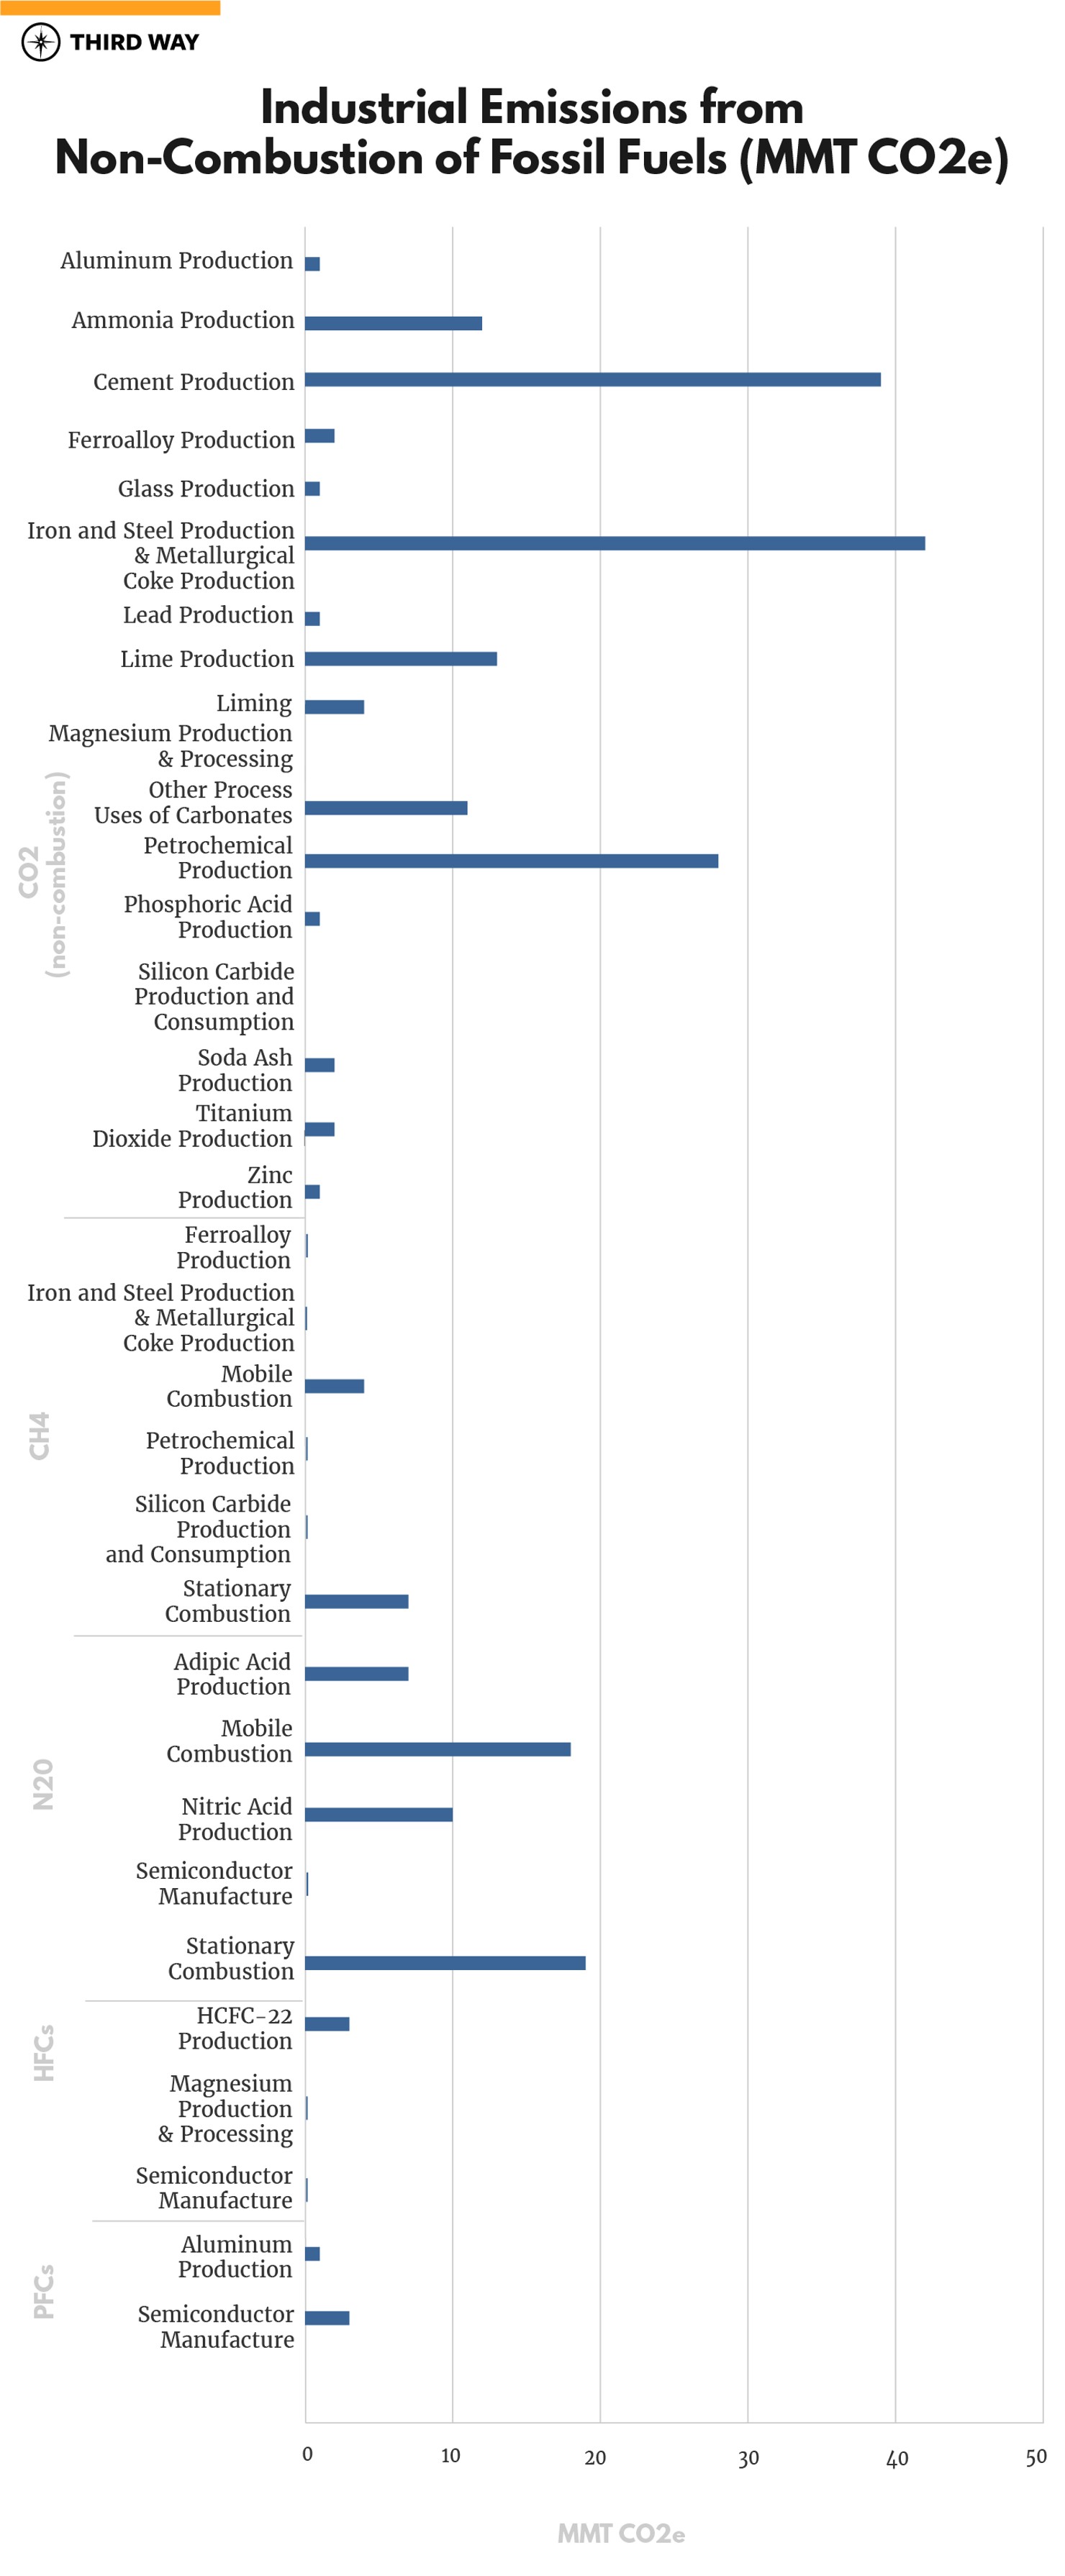
Figure 6: Industrial emissions from non-combustion of fossil fuels in million metric tons of carbon dioxide equivalent in 2016. (Data source: Rhodium US Climate Service)
US companies and policymakers can reduce emissions from the combustion of fossil fuels the same way they are doing it in the power sector; replacing fossil fuels with alternative carbon-free fuel sources. However, a difficulty with industry is that these processes can require high temperatures and consistent sources of energy, so often times clean energy sources like wind and solar are not suitable replacements. There are some existing technologies and others under development that will be able to meet those needs such as advanced nuclear and carbon capture technologies.
For emissions from chemical reactions, we will also need carbon capture as well as new materials and processes. To eliminate HFCs, we will need to use more climate-friendly alternatives and trade out old equipment for more sustainable options.
Around 960 plants from 14 different industries report their emissions to the EPA’s Greenhouse Gas Reporting Program. These 960 plants represent only 0.5% of all US manufacturing facilities, yet are responsible for roughly 25% of industrial sector emissions.10 The rest of the 95.5% of facilities have emissions that fall below the reporting limits for the EPA. Focusing on these large energy-intensive manufacturing facilities is a great place to start.
Direct Air Capture
Completely eliminating emissions from all sectors is an incredibly difficult, if not impossible, challenge within the necessary timeline. Particularly for hard to decarbonize sectors like industry, we are going to need to offset some of our emissions by removing carbon dioxide from the atmosphere. This is the gist of “net” zero emissions. While there are many carbon removal options, direct air capture (DAC) is one that could play an important role in offsetting carbon pollution if we are able to advance the technology. DAC can pull carbon out of the air at industrial sized levels. The technology has already seen large cost reductions over the past few years, but needs further innovation in order to fulfill the important role in offsetting the emissions that we are not able to eliminate.
For more on industrial emissions, check out Third Way’s report.
Agriculture
Agriculture sector emissions, responsible for around 8% of total US emissions, come from the production of livestock and crops for food. There are agricultural activities that remove CO2 from the atmosphere, but the emissions from agriculture still result in a net positive. There are three greenhouse gases that result from various agriculture-related activities. Non-combustion CO2 emissions come from a nitrogen fertilizer, methane (CH4) from cattle and sheep and manure management, and nitrous oxide (N20) emissions from soil management practices.
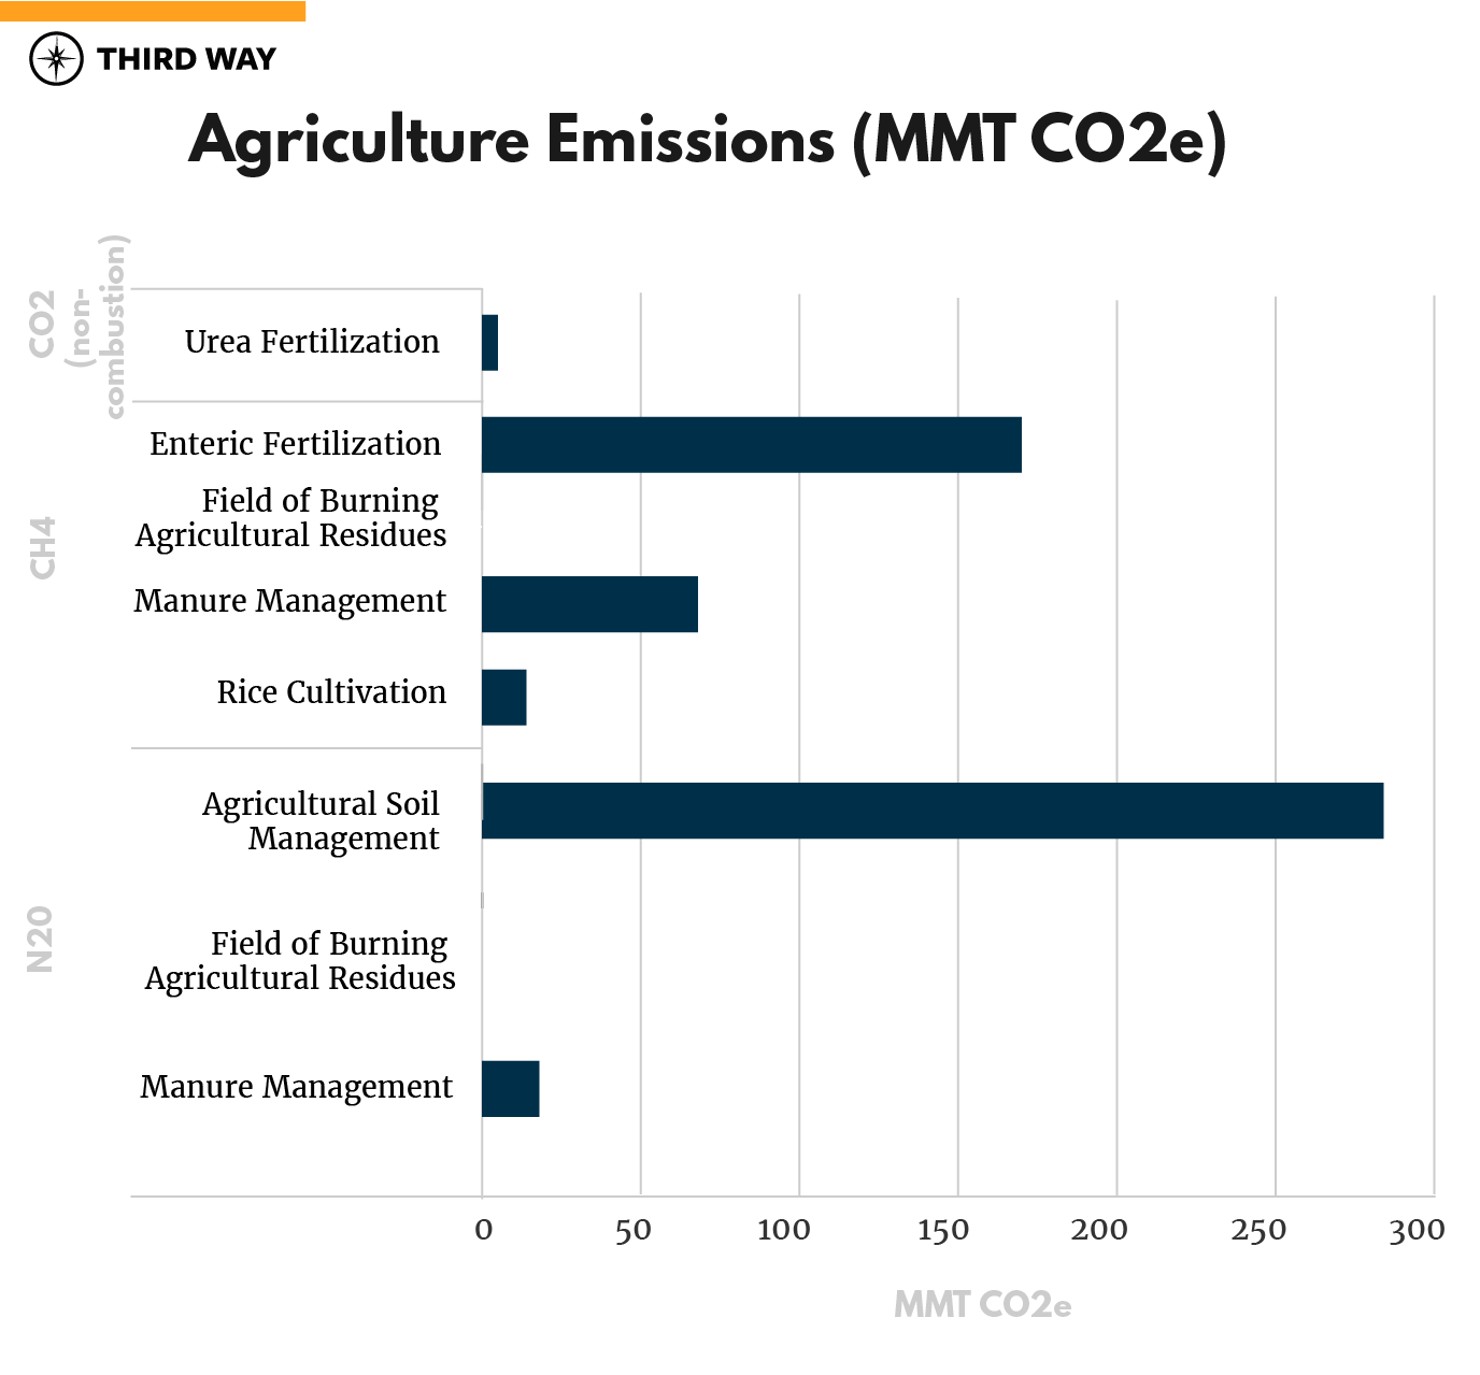
Figure 7: Agriculture emissions by greenhouse gas and subsector in million metric tons of carbon dioxide equivalent in 2016. (Data source: Rhodium US Climate Service)
Let’s be realistic. We’re not going to eliminate all greenhouse gas emissions, particularly from livestock. However, we can make a significant cut in agricultural emissions by improving soil, manure, and livestock management practices. To improve soil management, we need better fertilizer management and sustainable crop and irrigation practices. To improve manure management, we could deposit more manure on pasture and as solid waste instead of storing and treating it in liquid-systems that result in more emissions. We can also capture methane emissions from manure decomposition and use it as clean energy. Lastly, to improve livestock management, we could use higher quality feed that reduces methane emissions released from livestock like cows.
For more on agriculture emissions, check out the WRI’s overview.
Buildings
Most of the carbon pollution from buildings is the result of electricity use, with an additional 28% from burning fossil fuels onsite, typically for space and water heating. So in order to eliminate emissions from buildings, the electricity they use has to come from zero-carbon sources and their heating has to be electrified or come from another carbon free source. The emissions from burning fossil fuels onsite are shown below. Specific solutions for residential and commercial buildings can be different because we are dealing with different ownership entities.
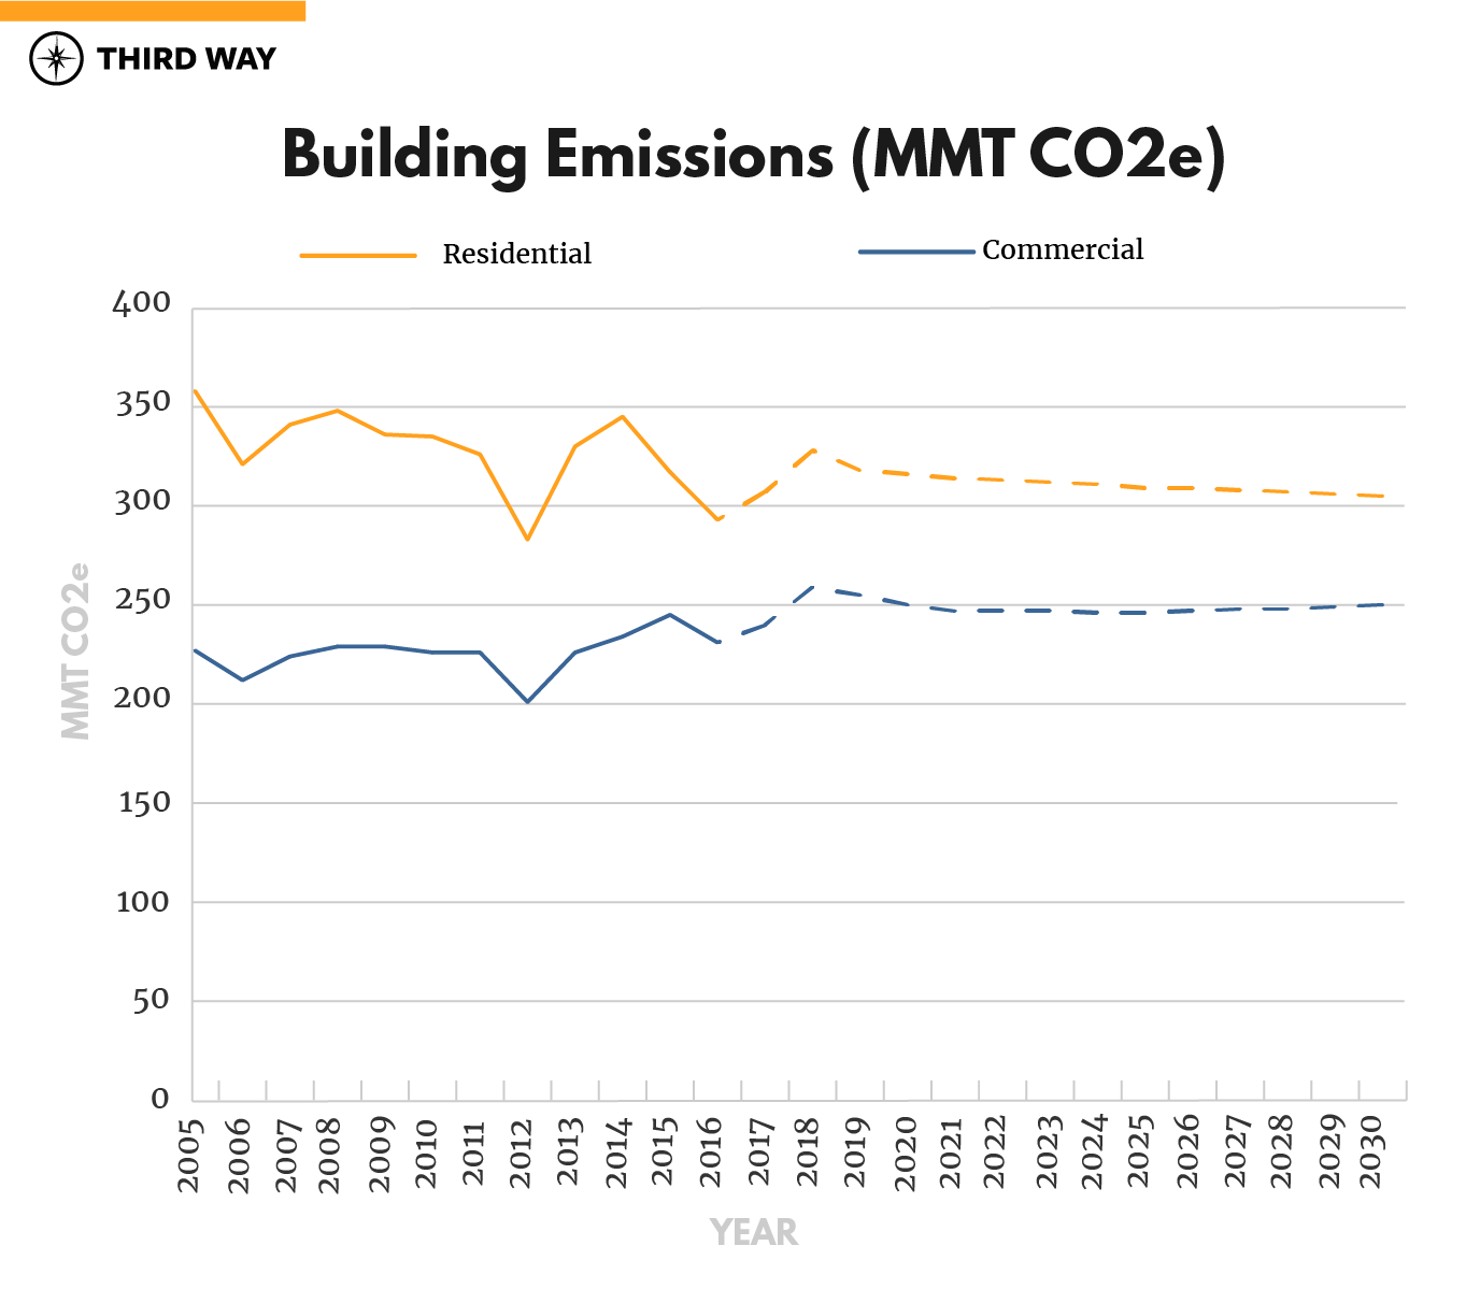
Figure 8: Building emissions by commercial and residential buildings in 2016. (Data source: Rhodium US Climate Service)
In order to eliminate emissions from buildings, all new buildings need to be built with top sustainability and efficiency standards and old buildings will need to be retrofitted. With retrofitting, electrifying heating and improving energy efficiency are fundamental for reducing emissions from buildings. That means improving the efficiency of lighting, insulation, windows, appliances, etc.
For more on the building sector, check our NRDC’s overview.
Oil & Gas
The oil and gas sector includes emissions associated with the production of these fossil fuels. The majority of emissions in this sector are methane emissions from natural gas systems. Eliminating these emissions will require preventing this methane from leaking into the atmosphere from wells and pipelines.
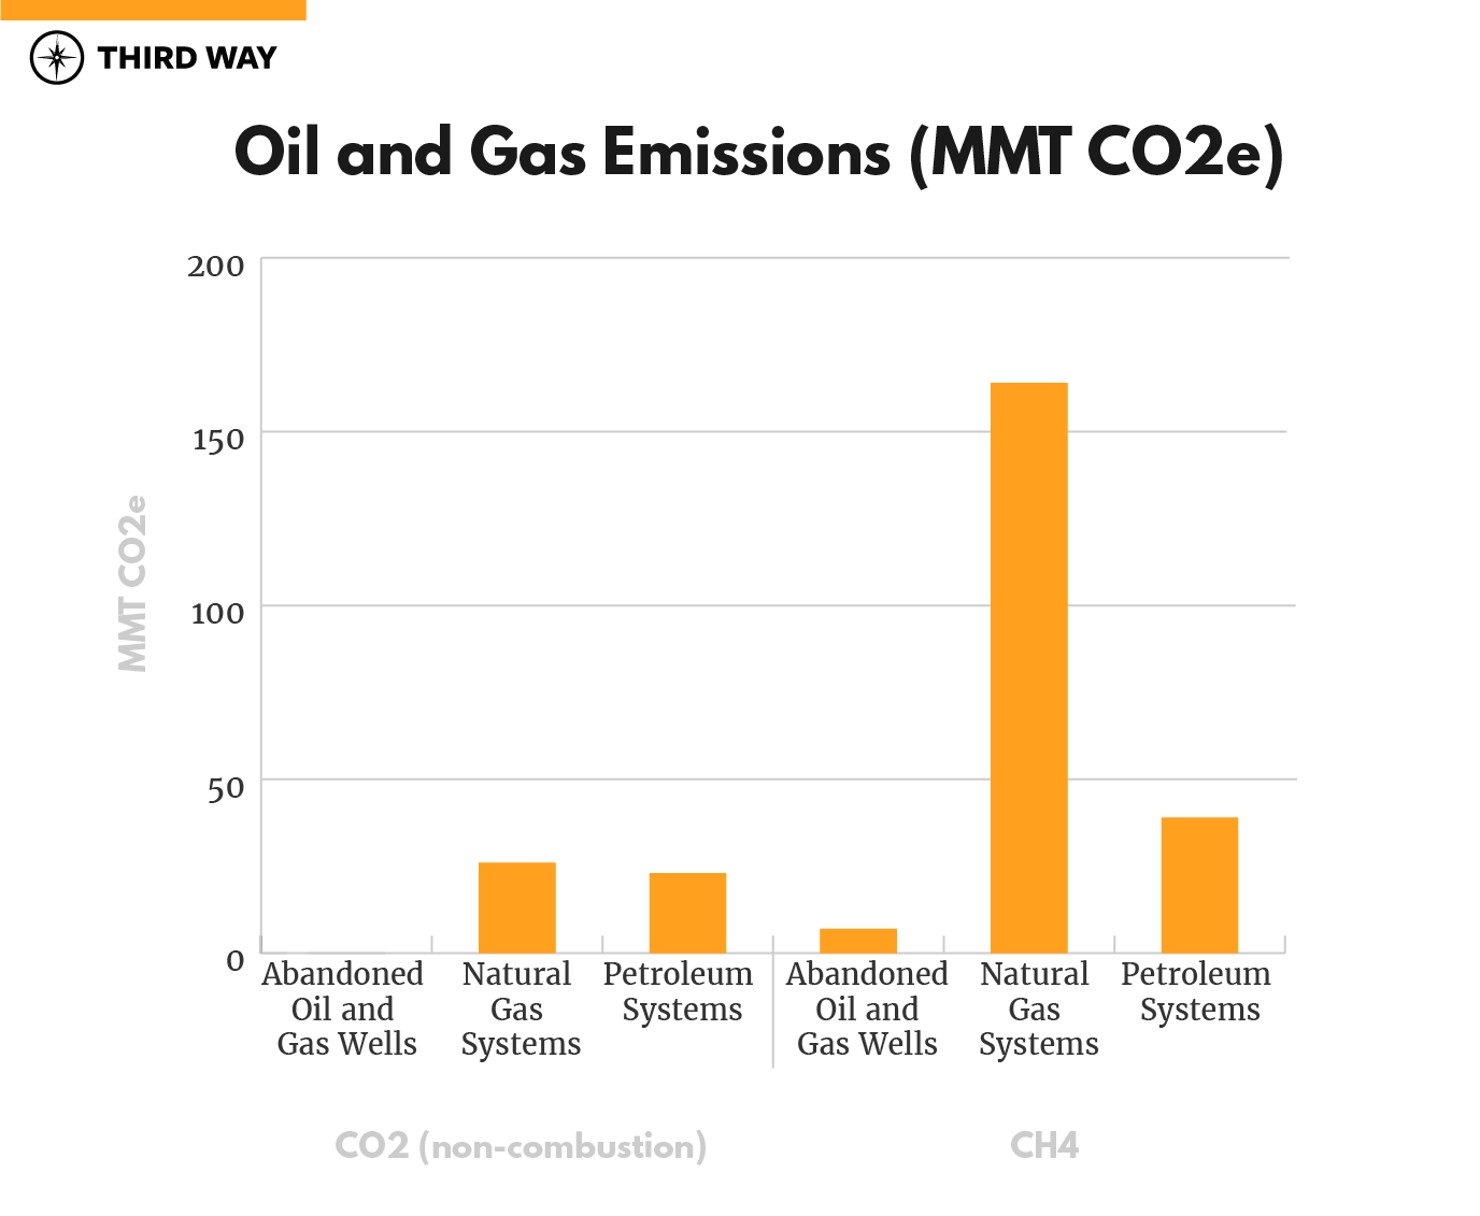
Figure 9: Oil and gas emissions by greenhouse gas emission and subsector in 2016. (Data source: Rhodium US Climate Service)
For more on oil and gas methane emissions, check out EDF’s overview.
Other
The remaining emissions or “other” category is best broken down into different greenhouse gases: CO2 from non-combustion, CH4, N2O, HFCs, SF6, and PFCs. As illustrated in the figure below, the largest amount of pollution comes from the substitution of ozone depleting substance, non-energy use of fuels, landfills, and coal mining. When we say net zero emissions, it means addressing or offsetting all of these smaller sources of carbon pollution.
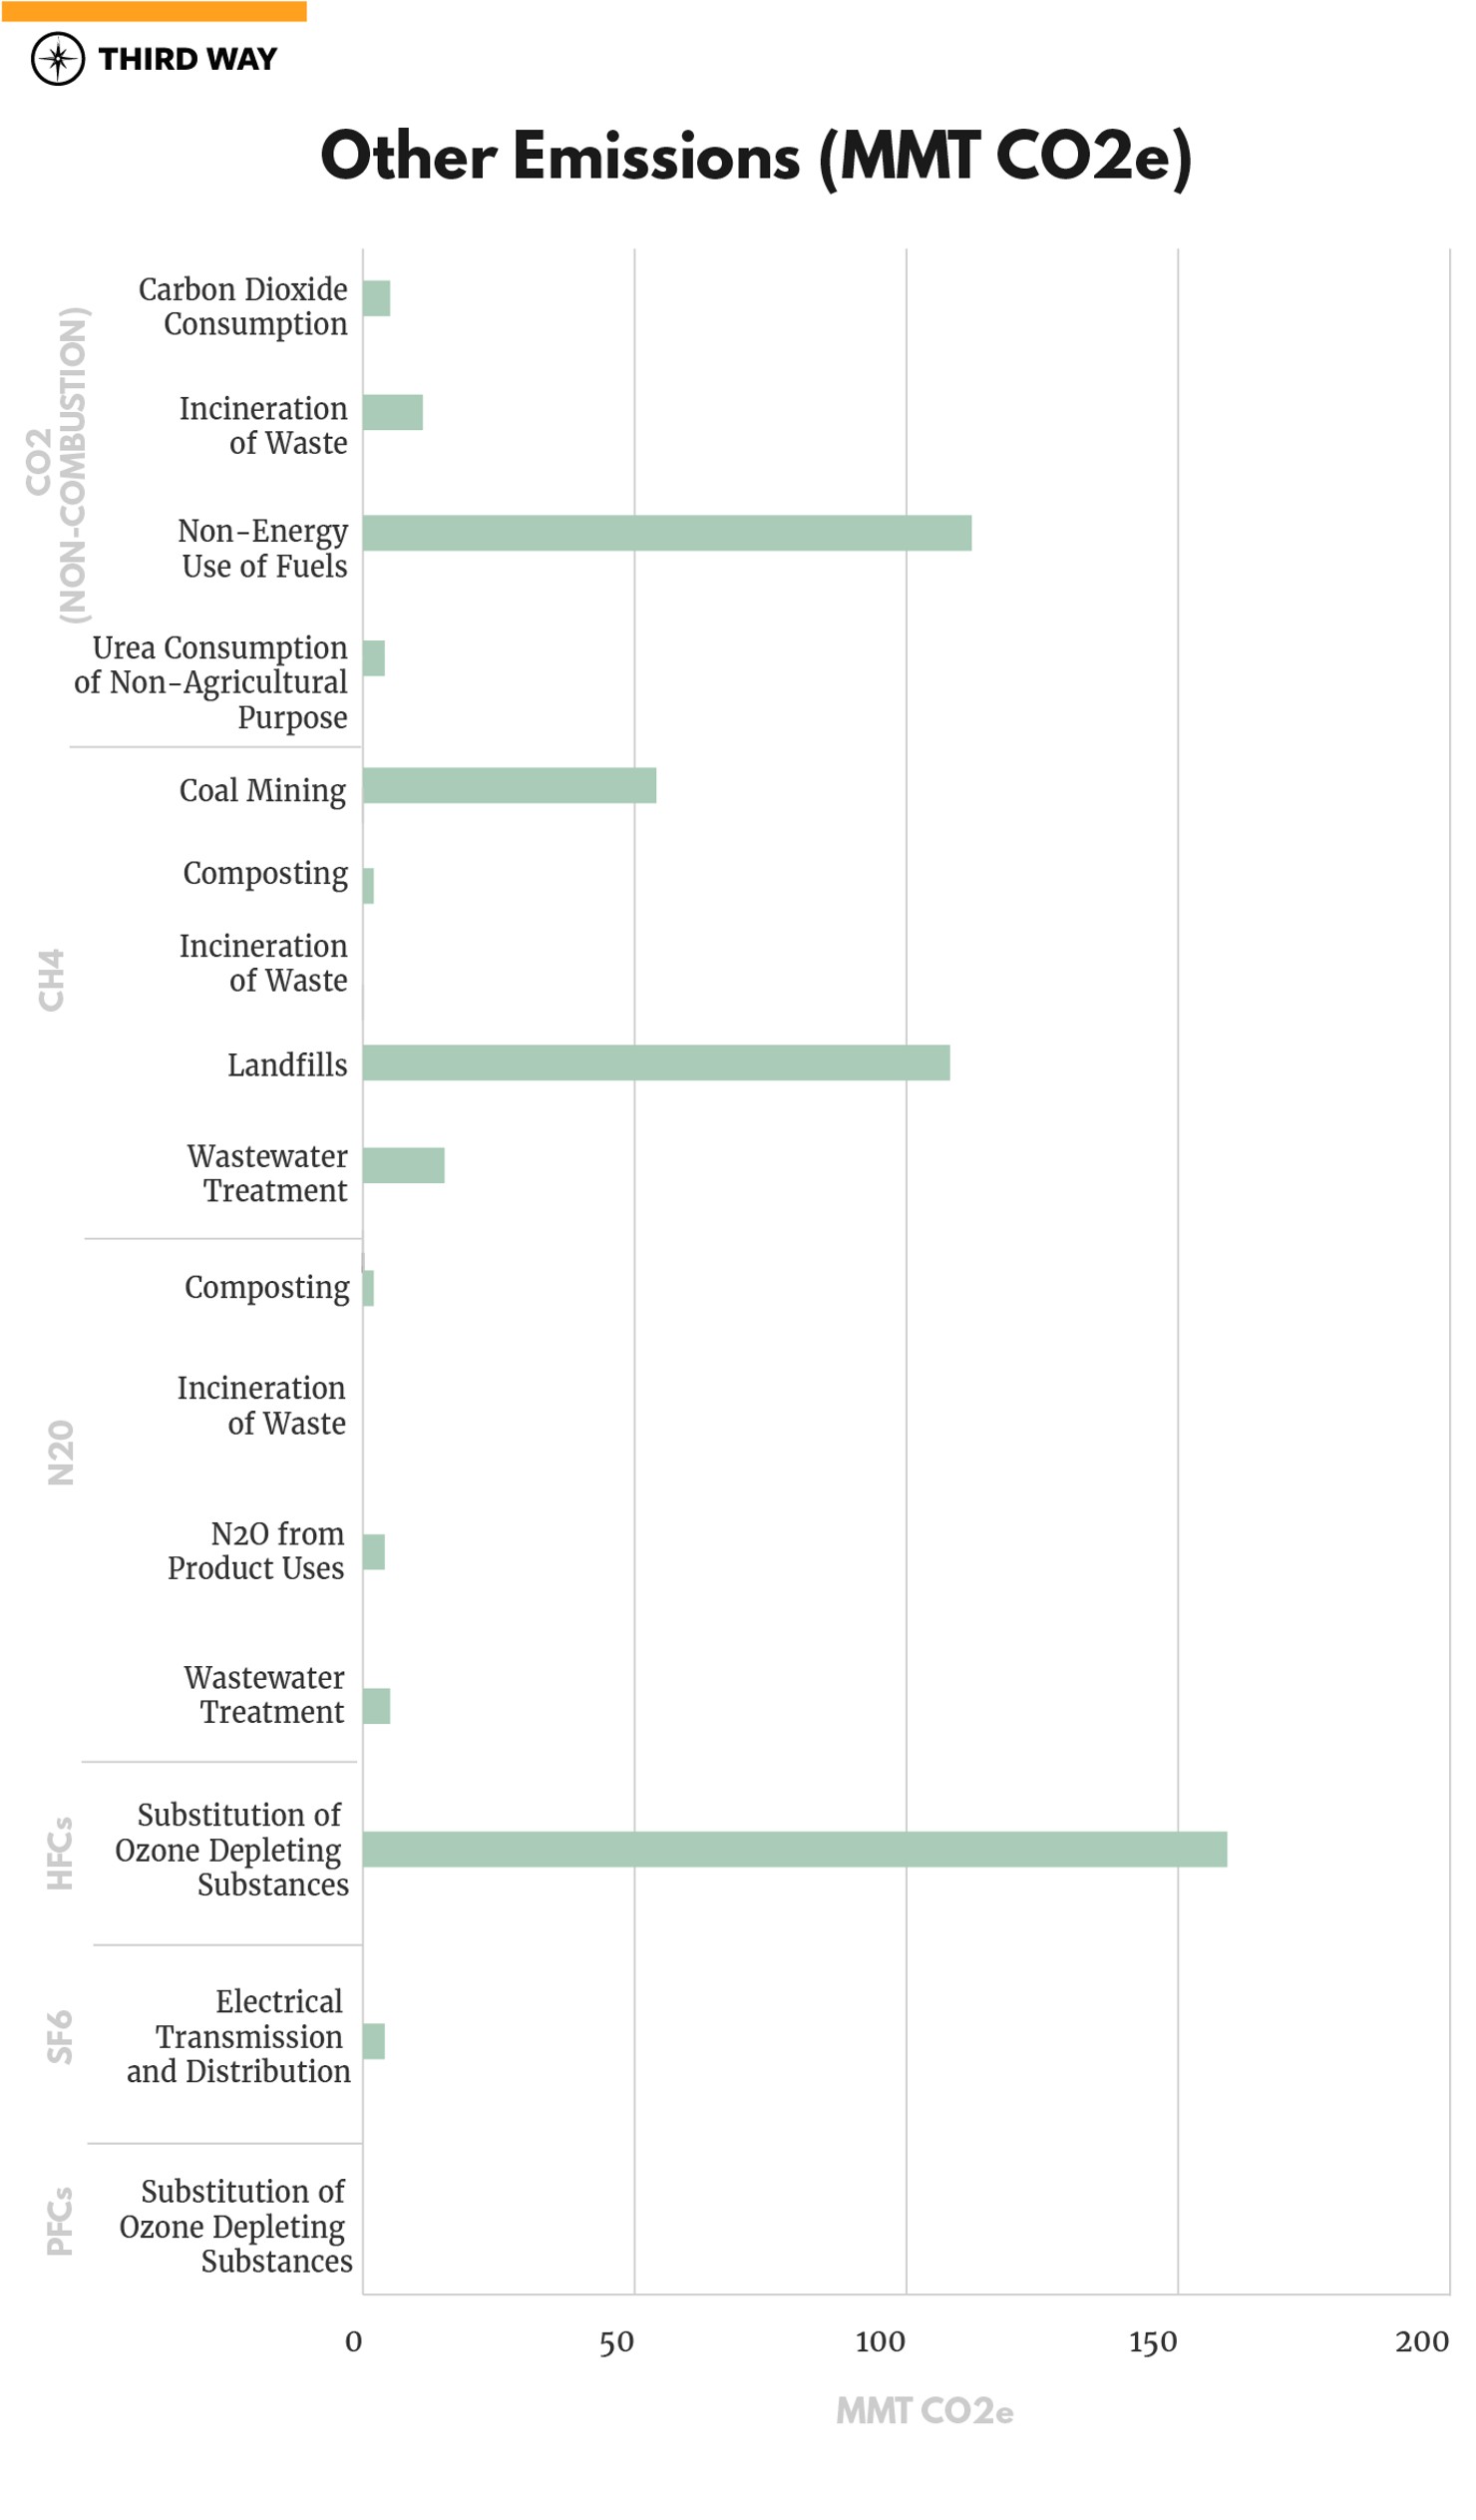
Figure 10: Other emissions by greenhouse gas emission and subsector in 2016. (Data source: Rhodium US Climate Service)
For more on ozone depleting substance, check out the EPA’s overview.
Land Use
Land Use, Land-Use Change, and Forestry (LULUCF) is a net sink of CO2 emissions in the US. This means that these activities result in the biological sequestration of CO2 in plants, solids, and dead organic matter. This offsets around 11% of US emissions, removing around 720 million metric tons of CO2e each year.
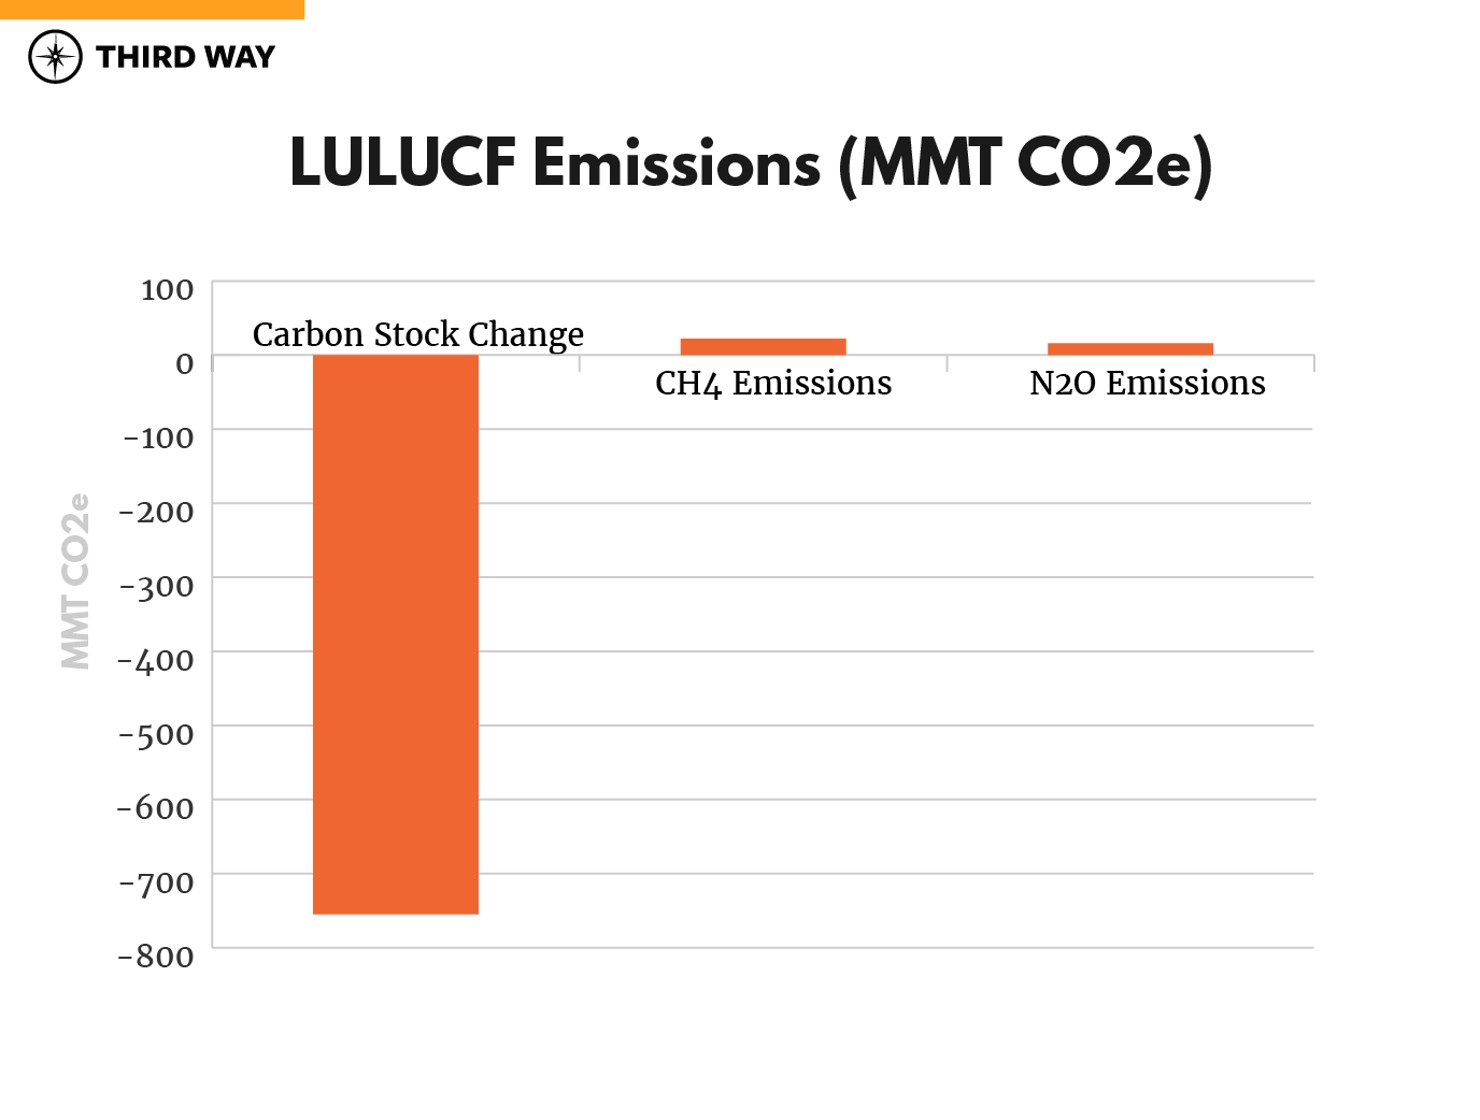
Figure 11: LULUCF emissions by greenhouse gas emission in 2016. (Data source: Rhodium US Climate Service)
There are opportunities to enhance our carbon sinks from LULUCF. We can change the uses of different land to increase its potential to store carbon, and we can also improve management practices on existing lands without changing the use. This includes reducing tillage practices on cropland, improving grazing practices, and replanting forests after disturbances.11 Rhodium Group’s Taking Stock 2018 found that if we enhance our LULUCF carbon sinks, then with high sequestration we could offset up to 14% of US emissions in 2025 and 13% in 2030.
For more on LULUCF, check out the C2ES’s overview.