Fix the Damn Bridges


At the end of May, President Donald Trump stormed out of an infrastructure meeting with Speaker Nancy Pelosi and Senate Minority Leader Chuck Schumer over the tertiary issue of how Congress should conduct oversight on his Administration. But while the President continues to hold vital funding hostage to his own political troubles, our infrastructure continues to deteriorate.
The average age of all bridges in the United States is 44 years old. According to the most recent data from the Federal Highway Administration, of the nearly 730,000 bridges in the US, over 300,000—approximately 40%—are over 50 years old.1 But there are certain bridges, constructed in a way that makes them far more prone to collapse, that have an average age of 82 years.2 We need to fix them. These bridges are designed with many of the same deficiencies as the bridge spanning the Mississippi River in downtown Minneapolis that collapsed in 2007, causing 13 deaths and 145 injuries.3 But the problem is far more extensive than most realize. In fact, there are nearly 5,000 bridges at serious risk of collapse—at least one in every state. The danger of these bridges to the traveling public, to the critical food supply chain, and to our national security has been largely ignored for decades.
Infrastructure improvements are always popular in America, but the issue has never been as salient with voters as it is now. In the midst of today’s political insanity, a simple campaign promise by candidate Gretchen Whitmer to “fix the damn roads” catapulted her to victory in both the contested primary, and the general election for the Michigan governorship.4 Danica Roem became America’s first transgender state legislator, not by running as a trailblazer, but by running on the issue of local traffic congestion.
The US has an ailing transportation system affecting communities in every state. And within that system is an especially pernicious problem: the failing state of US bridges. We need an infrastructure bill, and we need to fix the damn bridges.
The Problem with Bridges
In order to understand the severity of our nation’s bridges, it’s important to know three key terms: redundancy, fracture critical, and structural deficiency.
A redundancy allows a bridge to continue operating even if it’s damaged. Put another way, the failure of a redundant component of a bridge does not necessarily lead to the failure of the entire bridge. Engineers routinely incorporate redundant structural support in designing a bridge so that a failure of one component will be supported by other parts—preventing a collapse of the entire structure.
A fracture critical component, on the other hand, would cause a bridge to collapse if it failed. According to the most recently published data from the Department of Transportation, there are over 18,000 fracture critical bridges in the US.5
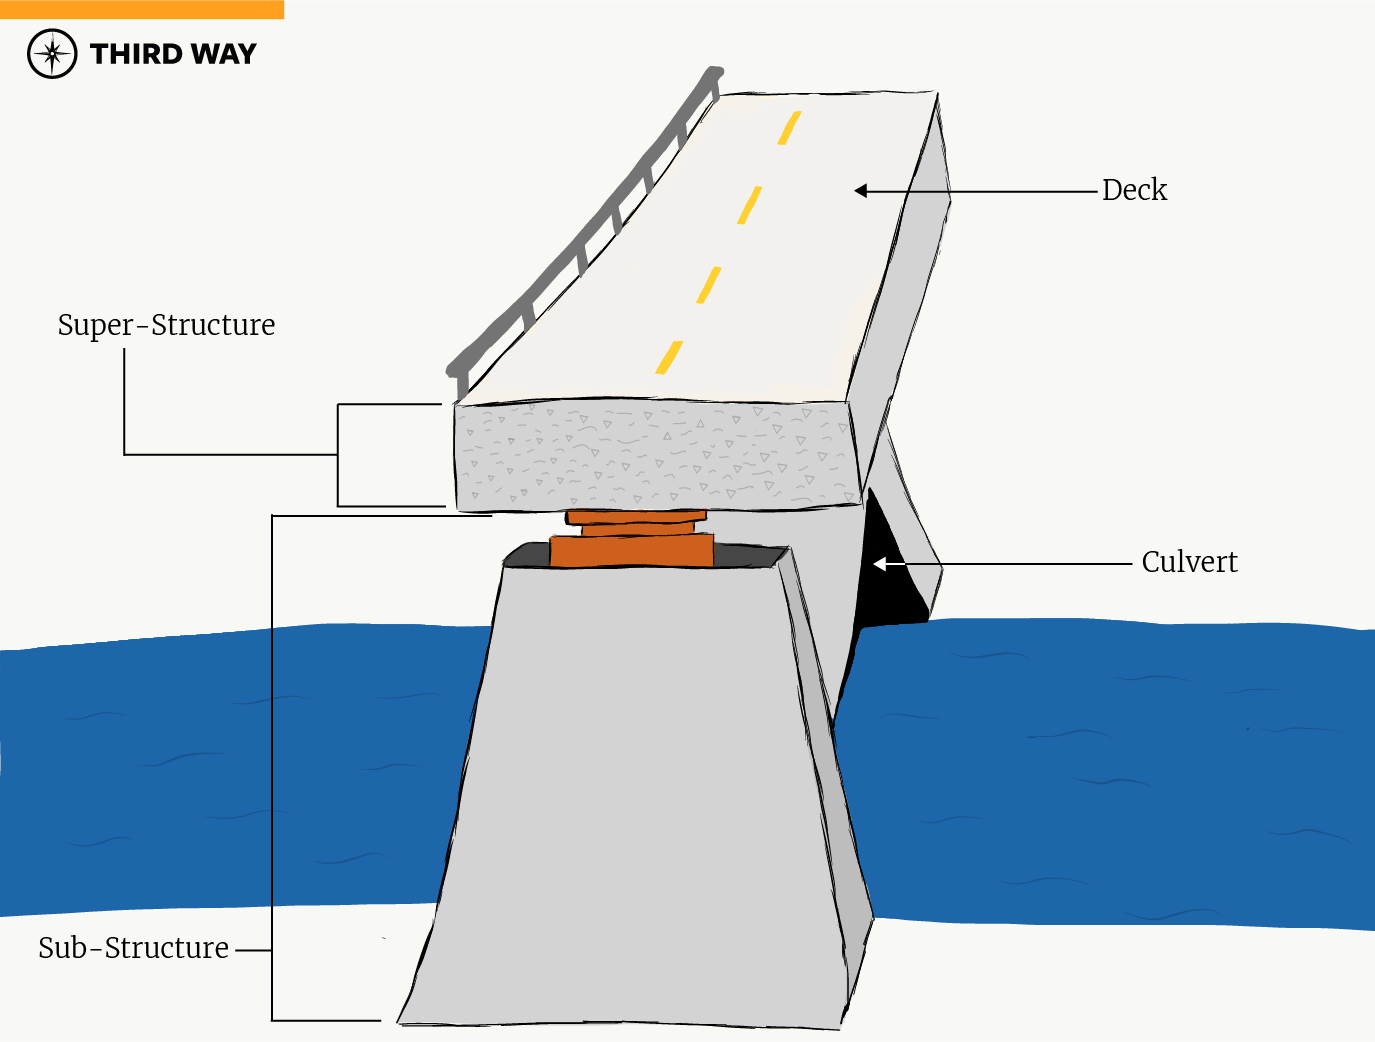
A structurally deficient bridge is one that has received the lowest safety rating from the National Bridge Inventory. This database, maintained by the Federal Highway Administration, assesses four parts of each bridge: the deck, superstructure, substructure, and culvert. The condition of the entire bridge is then assigned one of three ratings. Any component receiving the lowest rating (less than or equal to 4 out of 10) is considered structurally deficient.6 The Department of Transportation’s most recently available data indicate that over 47,000 US bridges are structurally deficient.7
A bridge designed with a fracture critical component is not in imminent danger of collapse; neither is a bridge that is structurally deficient, so long as it has redundancy designed into it from the outset. The real danger comes when a bridge is both structurally deficient and contains a component that is fracture critical. As of April 22, 2019, there are nearly 5,000 structurally deficient bridges that contain fracture critical members based on figures from the Federal Highway Administration.8 It should also be noted that this figure is on the low end of estimates. Previous analyses by the American Society of Civil Engineers and author Barry LePatner put the number of structurally deficient bridges with fracture critical members at approximately 8,000 using a slightly broader Department of Transportation definition of structural deficiency that was discontinued in 2018.910 No matter which measure one uses, the result is the same: every state has at least one such bridge—and some have many more.
By state, the number of structurally deficient fracture critical bridges per 10,000 lane miles varies widely, with West Virginia and Iowa taking the top spots.
Even more concerning is how frequently these bridges are used. Every day, some 19.6 million trips are made across structurally deficient fracture critical bridges.11 Collapse threatens lives and property, and the ensuing repairs to a collapsed bridge seriously impact the communities on both sides of the crossing.
Barriers to Repair
The average age of all bridges in the US is 43.6 years, but the average age of structurally deficient fracture critical bridges is almost double that at 82.4 years.12 So why don’t we jump on repairs for the most at-risk bridges in the country?
First, current funding is woefully inadequate. At the current rate of infrastructure improvement, it would take over 80 years to make the significant repairs needed to fix the bridges.13 The Highway Trust Fund, which was established as part of the Federal Aid Highway Act of 1956, hosts the account to construct and repair surface transportation projects. It receives funding though the federal fuel tax (18.4 cents per gallon of gasoline and 24.4 cents per gallon of diesel). But these levies haven’t changed since they were implemented in 1993 during the Clinton Administration. The purchasing power of funds contributed to the Highway Trust Fund in 2018 was just 64 cents for every dollar paid into it in 1993, according to the Institute of Taxation and Economic Policy.14 They estimate that 5 cents of the decline in purchasing power is due to fuel economy (14%), and 31 cents is due to construction inflation (86%).15
Second, the funding stream will likely not keep up with transportation trends. New vehicle fuel economy has increased by nearly 10 miles per gallon between 1993 and 2016, according to the Bureau of Transportation Statistics.16 Yet electric, hybrid, and internal combustion vehicles do the same amount of damage to roads and bridges, despite being charged less (if at all) in taxes at the pump. Reducing greenhouse emissions is great for addressing climate change, but funding for needed infrastructure repairs to a rapidly deteriorating system of roads and bridges has failed to adapt to these changing conditions. And without funding for ongoing maintenance costs, bridges and other infrastructure deteriorate much faster and cost considerably more to repair.
Finally, there is an issue with how federal funds can be used for local projects. The Transportation Infrastructure Finance and Innovation Act (TIFIA) provides low-interest loans and credit assistance for surface transportation projects. While the program’s success has led it to become a model for other federal infrastructure funding schemes, some smaller municipalities feel as though they aren’t receiving enough help. Strict criteria related to minimum project cost requirements, interest rates, and required future funding channels exclude many projects.17 Easing some of the more restrictive requirements could help smaller municipalities finance critical bridge repairs.
Looking Ahead
Five thousand at-risk bridges shouldn’t be a partisan issue—it should be an emergency siren to all policymakers. Fixing them should be a top priority for any infrastructure package, and Congress should take four steps to do so.
First, a significant pool of money must be set aside for immediate repair of structurally deficient bridges with fracture critical components. There are numerous financing methods being discussed—including increasing gas and diesel taxes and indexing them to inflation, increasing vehicle registration fees, and imposing a vehicle miles-traveled tax—all of which have pros and cons. The Committee for a Responsible Federal Budget has compiled a list of funding options.
Second, smaller municipalities should have greater access to federal funding. This could come in the form of decreased cost thresholds for smaller projects, which often do not meet the minimum requirement. It could also come in the form of an increase in loan amount. Under TIFIA, the Department of Transportation can guarantee up to 49% of a project’s cost as a loan, but in reality it has limited loans and loan guarantees to 33%.18 This is particularly burdensome when dedicated revenue streams are politically difficult to secure.
Third, bridges need to be smarter. Visual inspection and other outdated assessment methods work solely to catch glaring issues with bridges, but they miss the subtler signs of structural fatigue, impact damage, and corrosion. Automated monitoring systems can scan for bridge deterioration in regular intervals, and already do so in more technologically savvy places like Hong Kong and Taiwan. These technologies could be used in the US as well to determine which bridges require immediate attention. New and old bridges can also benefit from technological advances. Things like high-performance steel, self-healing materials, and wireless inspection systems can make future construction last longer.
Finally, our bridge assessment needs an upgrade. The Federal Highway Administration’s Long-Term Bridge Performance has noted several flaws, including poorly-defined and poorly-documented data.19 Performance measuring relies too heavily on expert opinion and not on objective criteria. Vast subjectivity in rating conditions, lack of proper documentation, incomplete data, and the fact that much deterioration and damage escape visual inspection all contribute to these uncertainties.
It’s time to fix the damn bridges. By prioritizing fixing bridges that are both structurally deficient and fracture critical, the US can avert needless disasters. The current Congress and President should put aside their differences and find a way to increase funding for critical infrastructure projects. Roads, bridges, ports, and railways are the engine behind the US economy—the government should take the danger of these bridges to the traveling public, the critical food supply chain, and to our national security far more seriously.
Endnotes
Author’s Analysis of “National Bridge Inventory Highway, Non-Highway, and Routes under Bridges for all States ASCII Files.” Federal Highway Administration. United States Department of Transportation. 22 April 2019. https://www.fhwa.dot.gov/bridge/nbi/ascii2018.cfm#del Accessed 9 May 2019.
Author’s Analysis of “National Bridge Inventory Highway, Non-Highway, and Routes under Bridges for all States ASCII Files.” Federal Highway Administration. United States Department of Transportation. 22 April 2019. https://www.fhwa.dot.gov/bridge/nbi/ascii2018.cfm#del Accessed 9 May 2019.
“10 Years after Bridge Collapse, America is Still Crumbling.” All Things Considered. National Public Radio. 1 August 2017. https://www.npr.org/2017/08/01/540669701/10-years-after-bridge-collapse-america-is-still-crumbling. Accessed 14 May 2019.
“Fix the Damn Roads.” Whitmer Gilchrist for Michigan. https://www.gretchenwhitmer.com/issues/infrastructure/. Accessed 19. May 2019.
Author’s Analysis of “National Bridge Inventory Highway, Non-Highway, and Routes under Bridges for all States ASCII Files.” Federal Highway Administration. United States Department of Transportation. 22 April 2019. https://www.fhwa.dot.gov/bridge/nbi/ascii2018.cfm#del Accessed 9 May 2019.
Tables of Frequently Requested NBI Information. Federal Highway Administration. United States Department of Transportation. 6 March 2019. https://www.fhwa.dot.gov/bridge/britab.cfm. Accessed 9 May 2019.
Author’s Analysis of “National Bridge Inventory Highway, Non-Highway, and Routes under Bridges for all States ASCII Files.” Federal Highway Administration. United States Department of Transportation. 22 April 2019. https://www.fhwa.dot.gov/bridge/nbi/ascii2018.cfm#del Accessed 9 May 2019.
Author’s Analysis of “National Bridge Inventory Highway, Non-Highway, and Routes under Bridges for all States ASCII Files.” Federal Highway Administration. United States Department of Transportation. 22 April 2019. https://www.fhwa.dot.gov/bridge/nbi/ascii2018.cfm#del Accessed 9 May 2019.
“Tables of Frequently Requested NBI Information.” Federal Highway Administration. United States Department of Transportation. 6 March 2019. https://www.fhwa.dot.gov/bridge/britab.cfm. Accessed 9 May 2019.
LePatner, Barry. “The Methodology.” Save Our Bridges. 2012. http://www.saveourbridges.com/new/methodology.php. Accessed 3 June 2019.
Author’s Analysis of “National Bridge Inventory Highway, Non-Highway, and Routes under Bridges for all States ASCII Files.” Federal Highway Administration. United States Department of Transportation. 22 April 2019. https://www.fhwa.dot.gov/bridge/nbi/ascii2018.cfm#del Accessed 9 May 2019.
Author’s Analysis of “National Bridge Inventory Highway, Non-Highway, and Routes under Bridges for all States ASCII Files.” National Highway Administration. United States Department of Transportation. 22 April 2019. https://www.fhwa.dot.gov/bridge/nbi/ascii2018.cfm#del Accessed 9 May 2019.
“2019 Bridge Report.” American Road & Transportation Builders Association. 2019. https://artbabridgereport.org/reports/2019-ARTBA-Bridge-Report.pdf. Accessed 2 May 2019.
“An Unhappy Anniversary: Federal Gas Tax Reaches 25 Years of Stagnation.” Just Taxes Blog. Institute on Taxes and Economic Policy. September 25, 2018. https://itep.org/an-unhappy-anniversary-federal-gas-tax-reaches-25-years-of-stagnation/. Accessed 23 May 2019.
“An Unhappy Anniversary: Federal Gas Tax Reaches 25 Years of Stagnation.” Just Taxes Blog. Institute on Taxes and Economic Policy. September 25, 2018. https://itep.org/an-unhappy-anniversary-federal-gas-tax-reaches-25-years-of-stagnation/. Accessed 23 May 2019.
“Average Fuel Efficiency of U.S. Light Duty Vehciles.” Bureau of Transportation Statistics. United States Department of Transportation. https://www.bts.gov/content/average-fuel-efficiency-us-light-duty-vehicles. Accessed 23 May 2019.
“The Transportation Infrastructure Finance and Innovation Act (TIFIA) Program.” p. 9. Congressional Research Service. 15 February 2019. https://crsreports.congress.gov/product/pdf/R/R45516. Accessed 21 May 2019.
“The Transportation Infrastructure Finance and Innovation Act (TIFIA) Program.” pp. 1, 2. Congressional Research Service. 15 February 2019. https://crsreports.congress.gov/product/pdf/R/R45516. Accessed 21 May 2019.
“Long-Term Bridge Performance.” Federal Highway Administration. United States Department of Transportation. https://www.fhwa.dot.gov/publications/research/infrastructure/structures/ltbp/ppt1.pdf. Accessed 9 May 2019.
Subscribe
Get updates whenever new content is added. We'll never share your email with anyone.