Memo Published December 19, 2022 · 10 minute read
Millions of Americans Face High Health Costs Year after Year
Nicole Tapay, David Kendall, & Ladan Ahmadi

Takeaways
New research shows that 10 million working-age Americans have families that spend more than 5% of their household income on medical bills for two years in a row. When paired with costs of insurance, health care is taking a total of 14% to 15% of their income. These working-age Americans are also more likely to have lower incomes, be older, have more chronic conditions, and live in the Midwest.
Patients with chronic health conditions often have large out-of-pocket costs even when they have insurance. The Affordable Care Act (ACA) helped many obtain and afford health insurance coverage and capped the annual amount people must pay out-of-pocket. However, those caps are set too high for many people—especially those with costly medical conditions who face high costs year-after-year. The burden of such persistent high costs is especially acute for people with low to middle incomes.
Our new research shows that 10 million working-age Americans have families that spend more than 5% of their household income on medical bills for two years in a row.1 For a family with a median income of $84,370 in 2022, that cost is an average of $5,950 each year.2 Their out-of-pocket costs are in addition to $6,106 in average premiums for employment-based coverage or $6,830 in average premiums for standard coverage in the ACA insurance exchanges.3 That means health care takes a total of at least 14% to 15% of their income, which is about as much as the cost of housing.4 According to our research, they are also more likely to have lower incomes, be older, have more chronic conditions, and live in the Midwest.
To better support individuals with chronic conditions who routinely spend a large percentage of their income on care, Third Way has proposed capping their costs.5 A cost cap limits how much each person would spend for insurance premiums and out-of-pocket (OOP) for deductibles, copayments, and coinsurance based on their income. To show who would be helped from a cost cap that protects people with chronic conditions who have high costs for one or more years, we looked at working-age people (ages 18-64) with OOP spending that exceeds 5% of family income over two years. The data comes from the federal Medical Expenditure Panel Survey, which follows people over two-year periods.6
The research shows the demographic factors behind the OOP cost burden for people with a single year of high costs and those with persistent high costs over two years. Key findings include:
- High costs for care plague people at all income levels.
- Families with lower incomes face a far greater financial burden.
- People with more chronic conditions face higher OOP costs.
- Persistent high OOP costs are worse for people buying coverage on their own.
- Families with persistent high costs typically have higher prescription drug costs.
- Complex and changing laws and health plan rules keep families with chronic conditions on edge.
- Persistent high costs are concentrated among those ages 55-64.
- High OOP costs afflict all racial and ethnic groups.
- People with persistent high costs are more likely to have trouble paying their medical bills.
- The Midwest has the highest rate of families with persistent high OOP costs.
We unpack these findings more below with the stories of two families who are representative of the financial challenges facing millions of Americans with high health costs.
Stacey Armato’s Son, Massimo, has Cystic Fibrosis
Stacey Armato, a 41-year-old mother of three in Hermosa Beach, California, has a 6-year-old son, Massimo, with cystic fibrosis, which causes lung damage. Massimo takes about a dozen medications, costing thousands of dollars each month. Fortunately, their insurance limits their total spending on Massimo’s care to about $6,000 a year. While this coverage is better than the current standard for coverage under the Affordable Care Act, it is not enough for their financial security.7
The Armatos’ high OOP costs represent a problem for people at all income levels. Unfortunately, the high OOP cost burden on the Armatos is not rare. Assuming their family earns $84,370, the median family income, and they purchase their coverage through the ACA exchanges, their insurance policy’s OOP limit is well below the $13,900 permitted for family coverage under federal law. Nonetheless, their expenses on Massimo’s care exceed 7% of the family’s income annually, and they must pay this amount year-after-year. The Armatos are not alone. As shown in the chart below, 5% of people in families earning from two-to-four times the federal poverty level ($46,060 to $92,120 for a family of three in 2022) face persistent high OOP costs two years in a row. High OOP costs also present challenges when they arise within a short period of time and more people confront this challenge. Over three times as many people in families with incomes within this range face one-time high OOP costs over one of the two years.
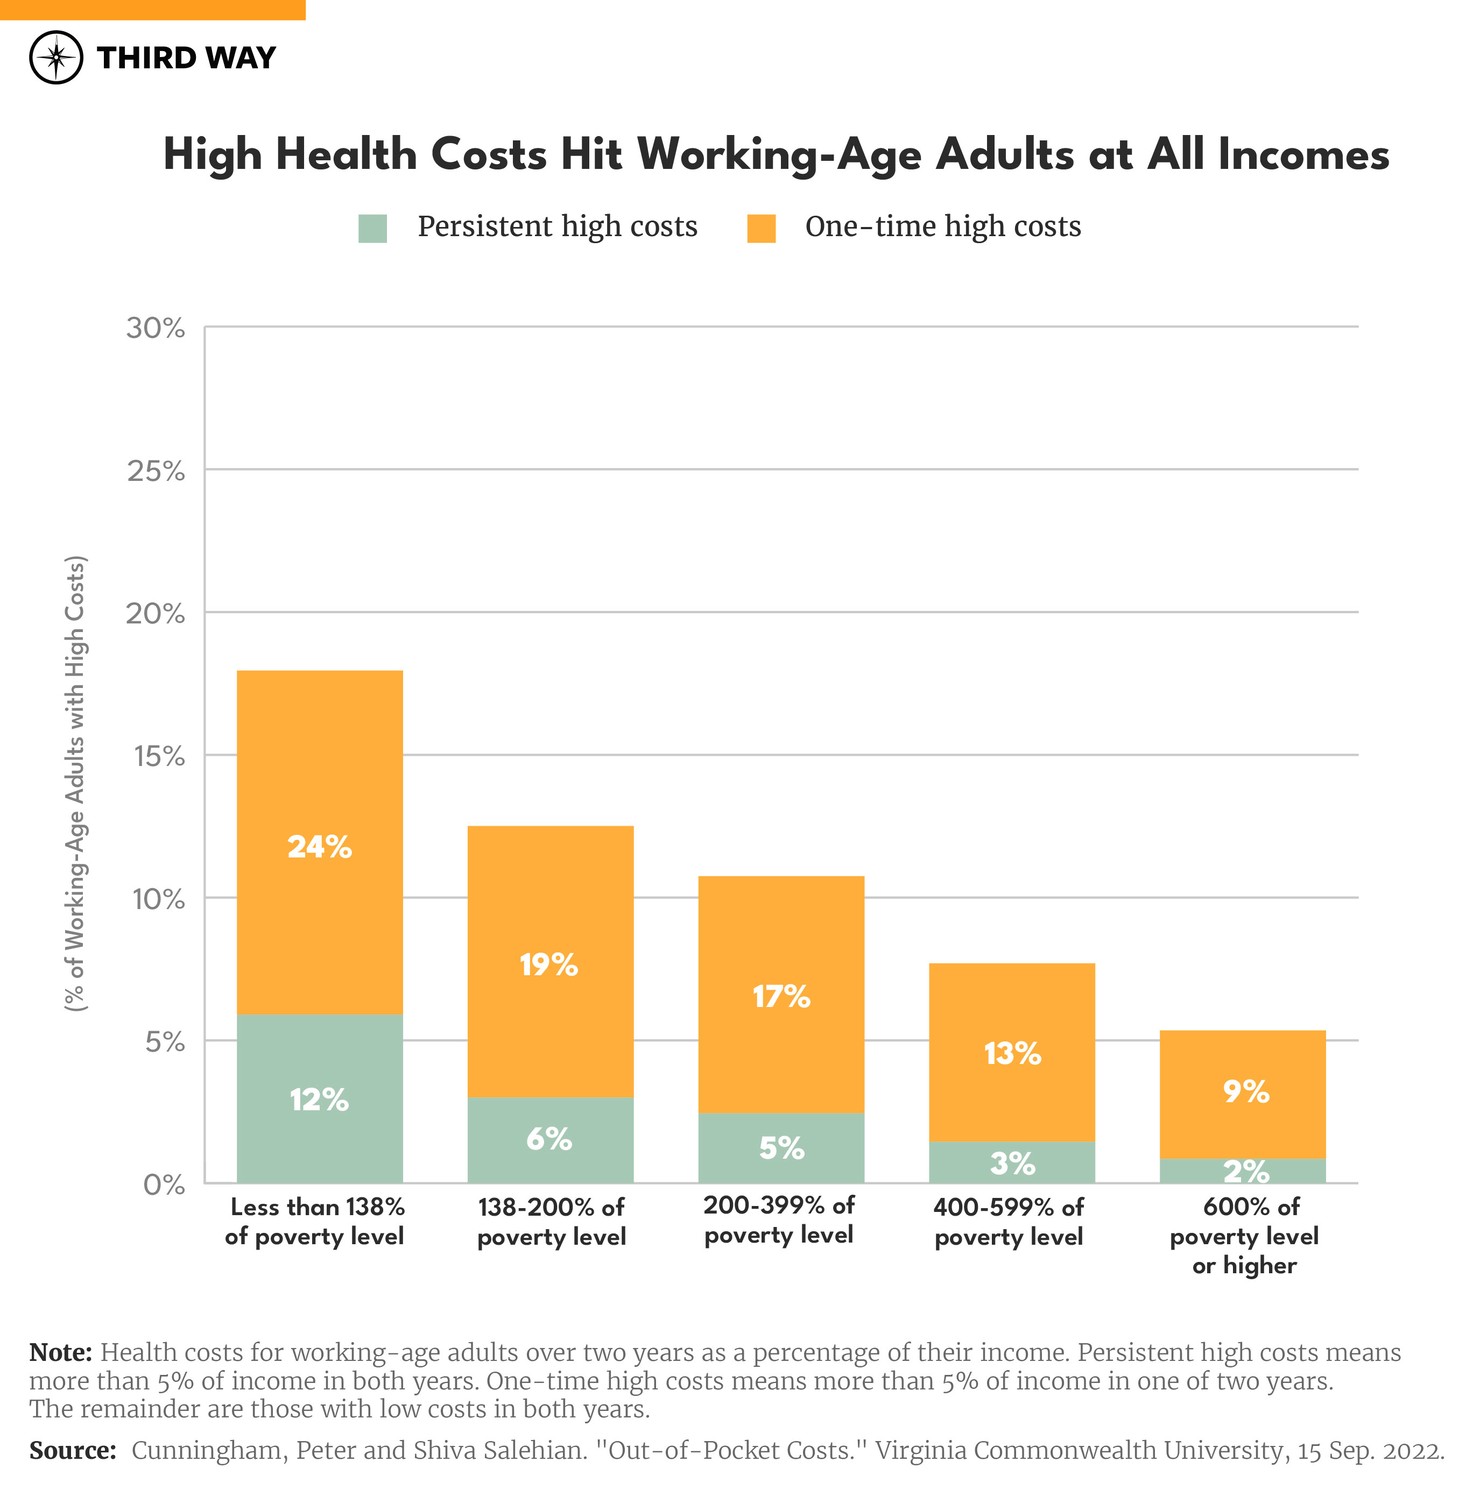
Families with lower incomes face a greater financial burden from high OOP costs. Twelve percent of the people in families with persistent high costs and low incomes qualify for free coverage through Medicaid, but they may not be enrolled, or they may live in one of the 12 states that has not expanded Medicaid to include them.8 Twice as many low-income families face high OOP costs within a year. Even families with higher incomes can face high OOP costs. Three percent of people in families earning from four-to-six times the poverty level ($92,120 to $138,180 for a family of three in 2022) face persistent high OOP costs, and 13% have one-time high costs in one of the two years studied.
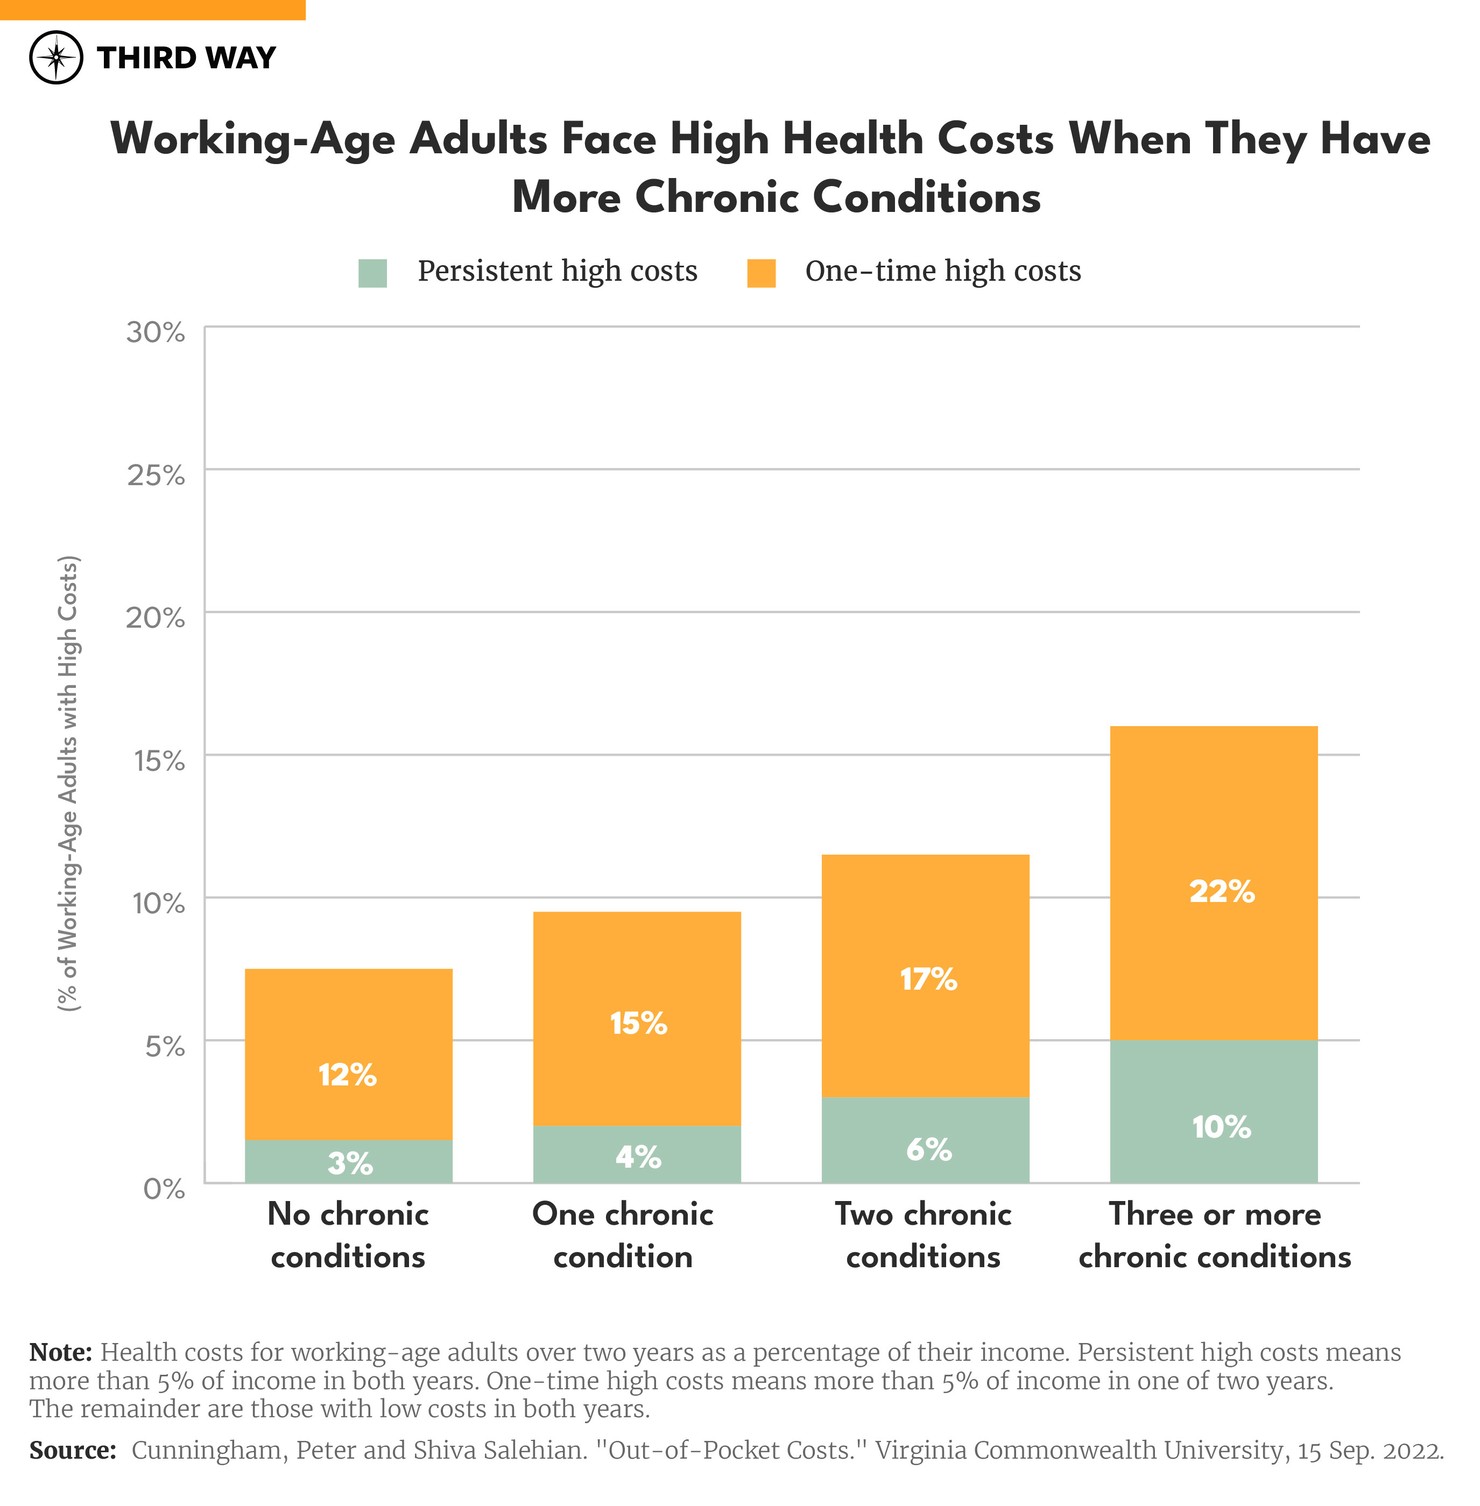
People with more chronic conditions face higher OOP costs. Like Massimo, people with chronic conditions have a bigger risk of getting hit with persistent high OOP costs. The risk increases with the number of chronic conditions people have. For example, Massimo might also have ongoing lung infections and other diseases like diabetes and arthritis, especially as he grows older, requiring more medications and regular monitoring. Six percent of people with two chronic conditions have persistent high OOP costs as shown in the chart below. People with three or more chronic conditions are four times more likely to have persistent high costs than those who have none. The risk of high costs in a single year also increases with the number of chronic conditions.
Persistent high OOP costs are worse for people buying coverage on their own. Nine percent of those with their own coverage have persistent high OOP expenses, which is half a million working-age adults who have individually purchased coverage for two years.9In contrast, one-third as many people in families with employer coverage face the burden of persistent high OOP costs. This could be because employer coverage has lower deductibles or other cost-sharing requirements and people with their own coverage have greater health care needs.
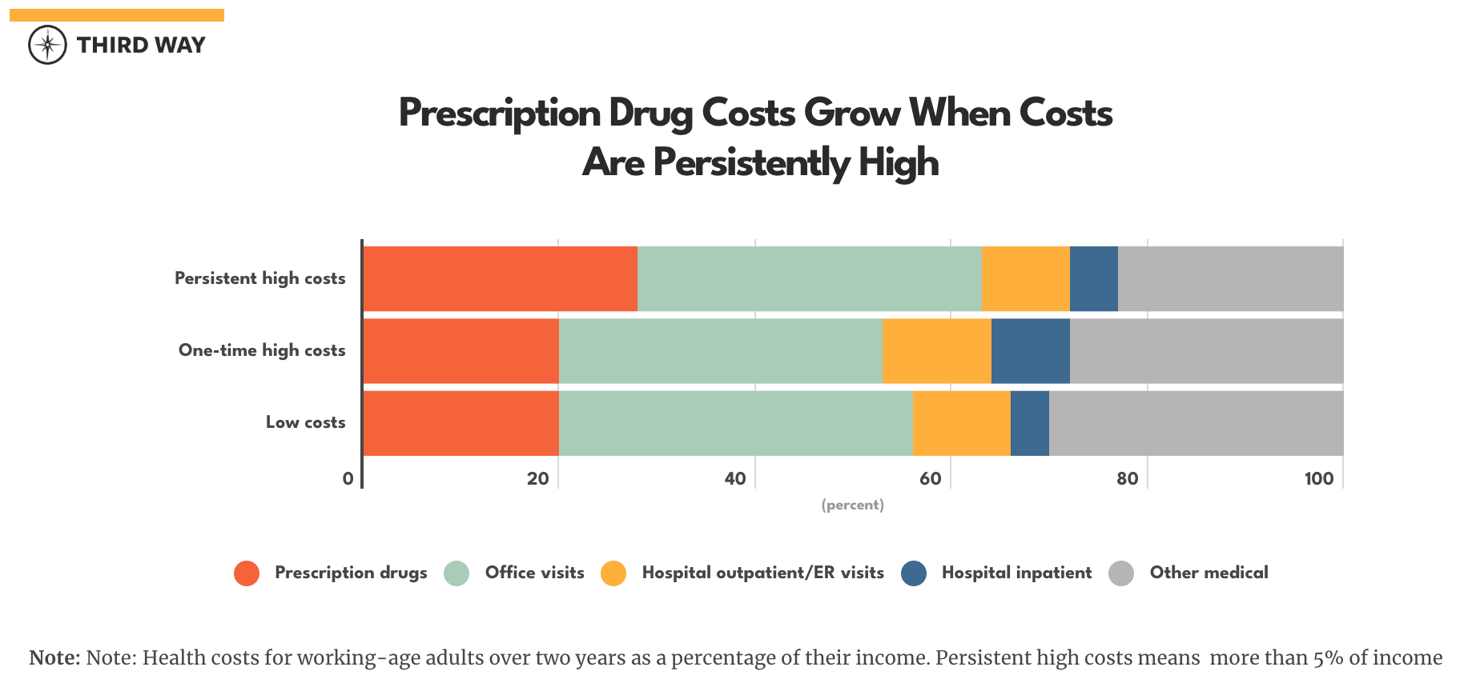
Families like the Armatos typically have higher prescription drug costs. Families with persistent high costs pay an average of $1,453 for prescription drugs two years in a row. Drugs account for 28% of these families’ total costs compared to 20% for families with one-time high costs as shown in the chart below. This could indicate that coverage is not as good for families with persistent high overall health costs.
Jamie Lyn May and her Son Andy Have the Same Debilitating Disease
Jaime Lyn Moy of Waterford, Michigan and her son, Andy, have psoriasis and psoriatic arthritis. 10 Psoriasis is severe skin rash that can lead to arthritic pain in the joints and swelling.11 Jaime notes that “Andy has been through a lot. When his psoriasis flares, he is covered head to toe with burning, itching and pain. The psoriatic arthritis affects his joints, especially his spine and hips. Between the two of us, the out-of-pocket costs for our quarterly injections are almost $4,000…. Having to find over $10,000 every year to afford the biologics that keep us healthy and keep my son out of a wheelchair is unimaginable.” Their costs are affordable through a copay assistance program, which is typically sponsored by the pharmaceutical industry.
The Moys’ fate, like millions of others, is in the hands of a complex coverage system. The Moys might be able cover their costs now, but the copay assistance program could end suddenly, or they could have other costs for which they would still have to pay a deductible or other OOP costs. Laws and health plan rules determine whether such copay assistance counts toward a patient’s OOP cost requirements. They could be liable for up to $17,400 in OOP costs under a silver level plan sold on the health insurance exchange. If that happened, they’d have to suffer the consequences of going without the biologic therapy because Jamie says they couldn’t afford it. Four-in-ten adults in the United States delay or go without health care each year because they can’t afford it.12
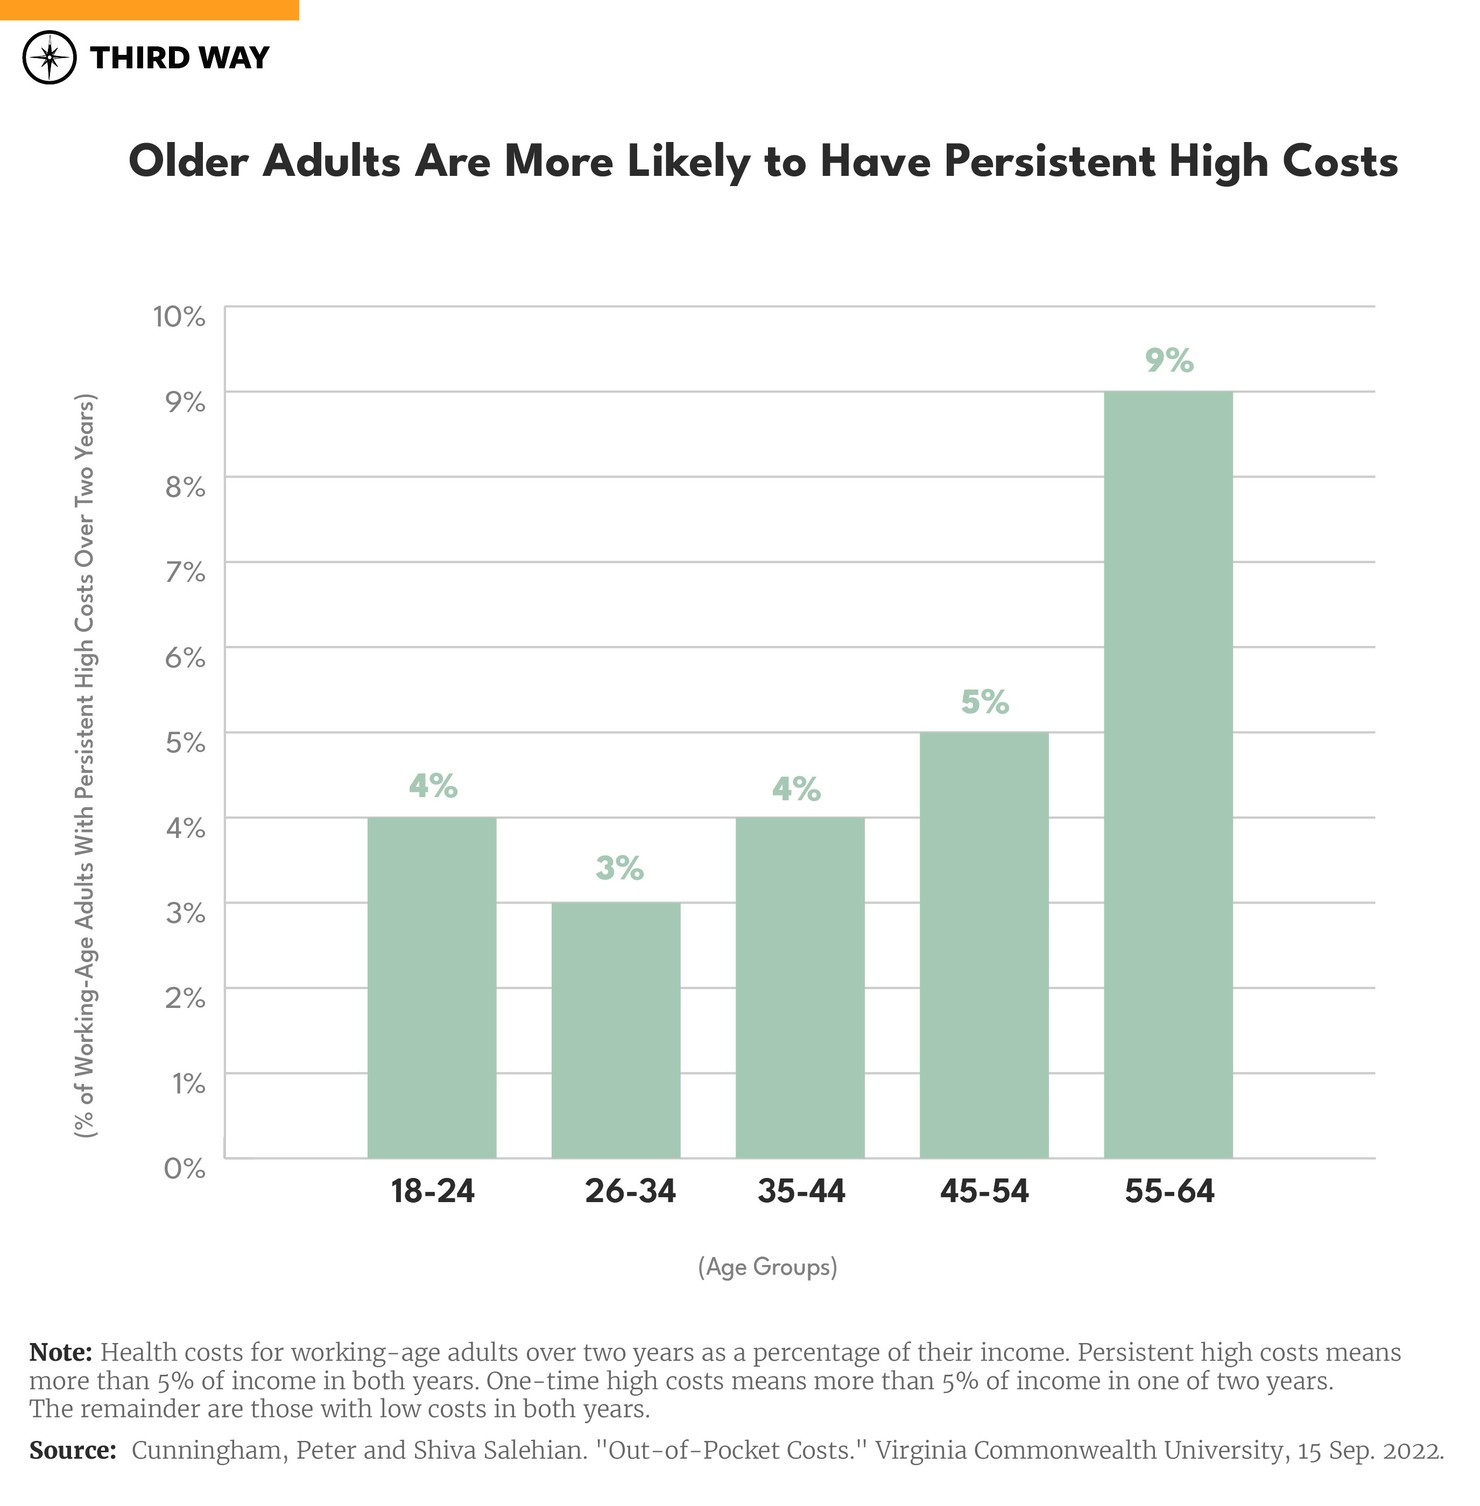
Persistent high costs increase with age. If Jamie were age 55, she would be in an age group more likely to have persistent high OOP expenses as shown in the chart below. Nine percent of 55 to 64-year-old working adults have persistent high costs over two years compared to 4% of 18 to 25-year-olds.
High OOP costs afflict all racial and ethnic groups. White people have the highest rate of persistent high health costs at 6%, compared to 3% for Black and Hispanic people and 2% for Asian people. For single year high costs, white people have a rate of 17% compared to 14% for Hispanic people, 13% for Black people, and 11% for Asian people. The fact that the data don’t show inequity for minority populations may be misleading and obscuring the full picture. Inequities regularly occur with access to care, and it is not clear what the impact on OOP costs would be if access to care were equitable.
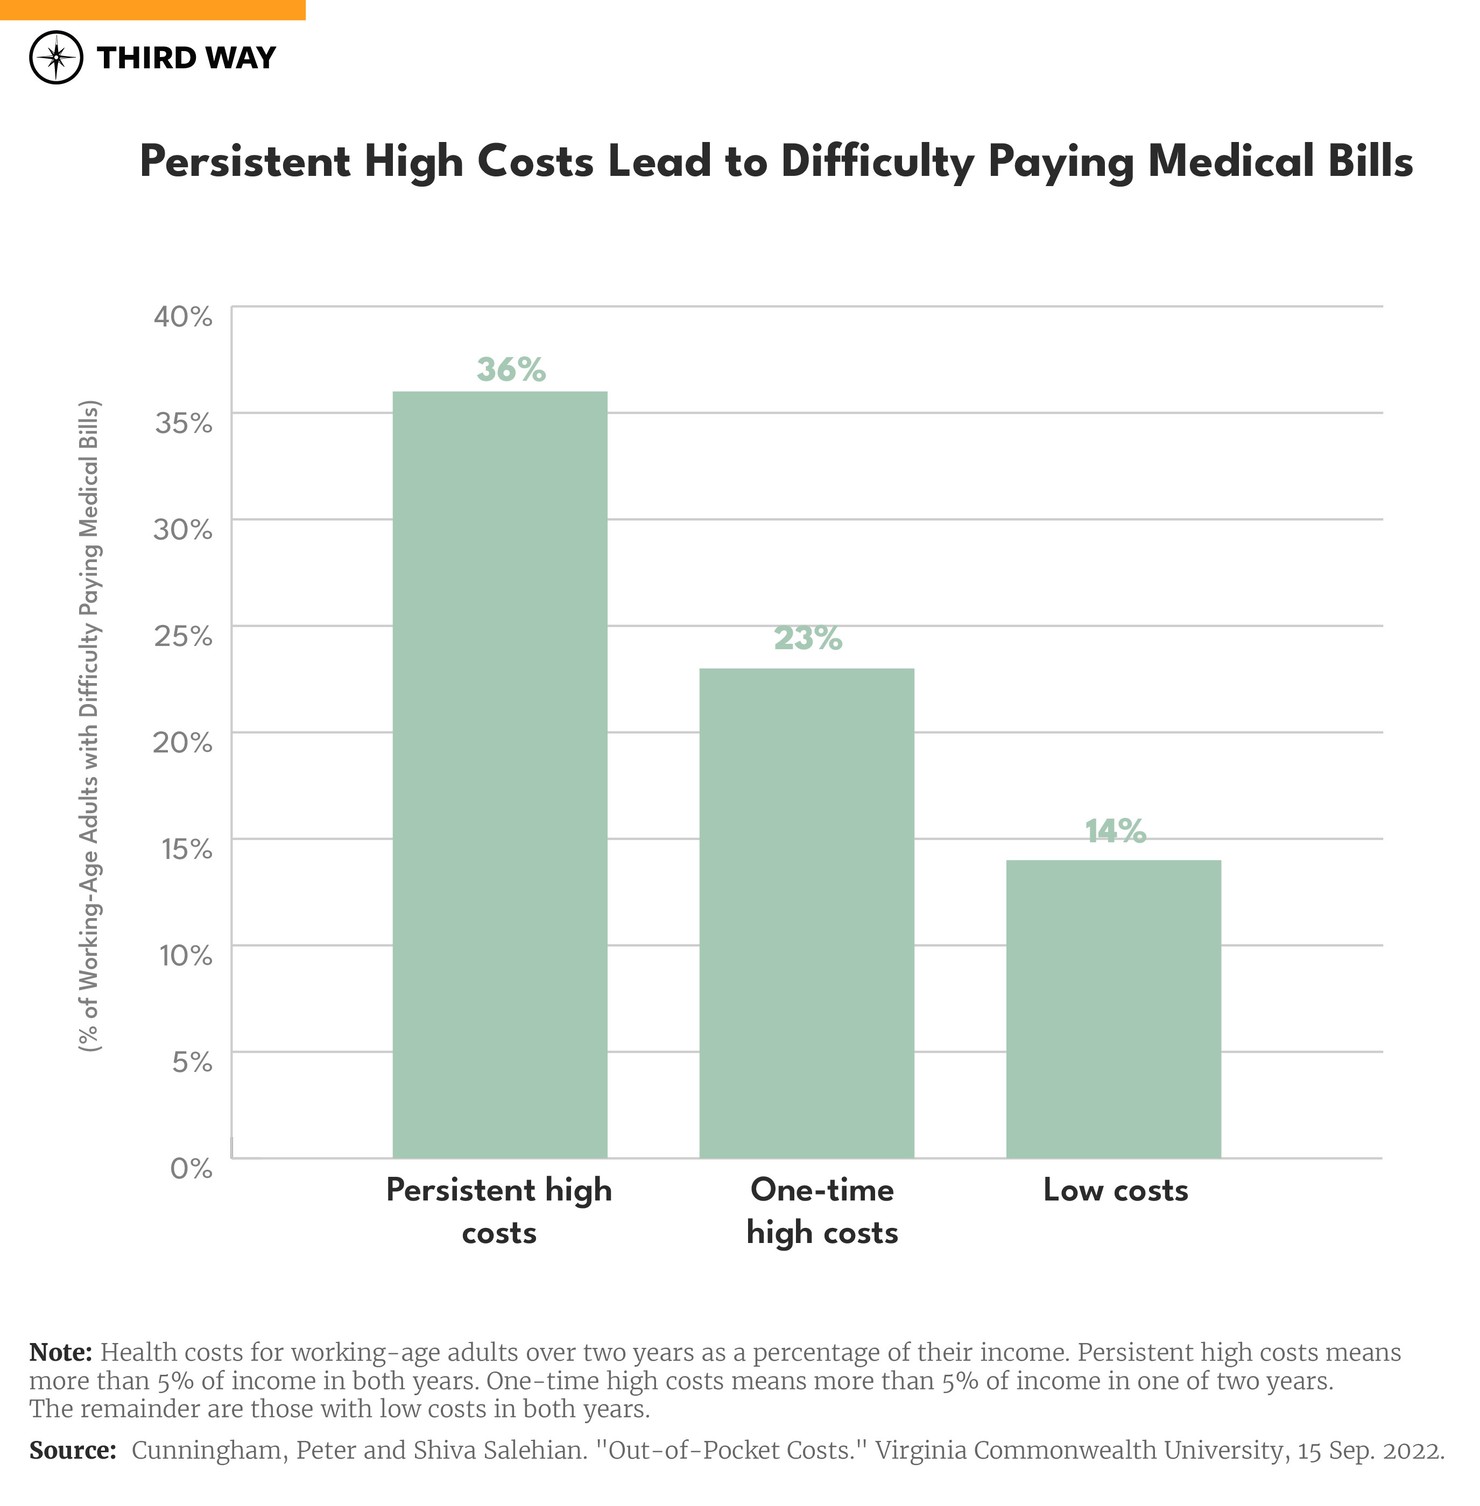
People with persistent high costs are more likely to have trouble paying their medical bills. Overall, 17% of working age adults report having trouble paying their medical bills in at least one year over a two-year period. Over twice as many have trouble when they have persistent high costs over two years compared to those with low costs over two years as shown in the chart below. Among those who have trouble paying their bills, four-out-of-five with persistent high costs won’t be able to pay their bills at all in at least one year over a two-year period (see table 3 in the research results download). These problems are worse for people with individually-purchased coverage.
People across the country shoulder persistent high OOP costs, with more in the Midwest. The Midwest, where the Moys live, has the highest rate of families with persistent high OOP costs. There, 6% of families have high OOP costs like the Moys compared to the lowest rate of 4% in the Northeast (see table 1 in the research results download). Among families with high costs in a single year, the South has the highest rate at 18% compared to the lowest rate of 13% in the Northeast. Despite this variation, no region of the country is spared from the problem of high OOP costs. It is a national problem.
Conclusion
The 6.7 million working-age Americans with persistent high OOP costs reveal a major gap in coverage protections. The nation needs a universal cost cap that includes protection for people who face high costs year after year. A cost cap that spans multiple years as Third Way proposes would help end the unfair demographic variation in costs for people based on their income and health costs.
Methodology
Virginia Commonwealth University researchers, Peter Cunningham and Shiva Salehian, analyzed data from the Medical Expenditure Panel Survey.13 They conducted a longitudinal analysis using data from 2015 to 2019. A complete set of tables are available to be downloaded here.