Memo Published July 20, 2023 · 15 minute read
Offshore Wind: Policies to Help America Lead
Isabelle Chan

Takeaways
- Despite the support of the Biden Administration’s 30 GW by 2030 target, Inflation Reduction Act (IRA), Bipartisan Infrastructure Law (BIL), and the Department of Energy’s (DOE) Floating Offshore Wind Shot, the US lags behind its offshore wind competitors and must move quickly to have a chance at capturing a portion of the $1 trillion global market it has access to.
- A particular focus on floating offshore wind expertise and manufacturing abilities will allow the US to meet domestic demand and clean power targets, while also enabling American businesses to compete for export markets in North, Central, and South American exports.
- To become competitive in offshore wind, the US must capitalize on its innate competitive advantages to grow a viable supply chain, strengthen its capabilities in the Original Equipment Manufacturer (OEM); Engineering, Procurement, and Construction (EPC); and Operations & Maintenance (O&M) sectors, support a transitioning workforce, convene with stakeholders across the aisle, restructure permitting processes, and quickly build out transmission.
Why the US Should Compete in the OSW Market
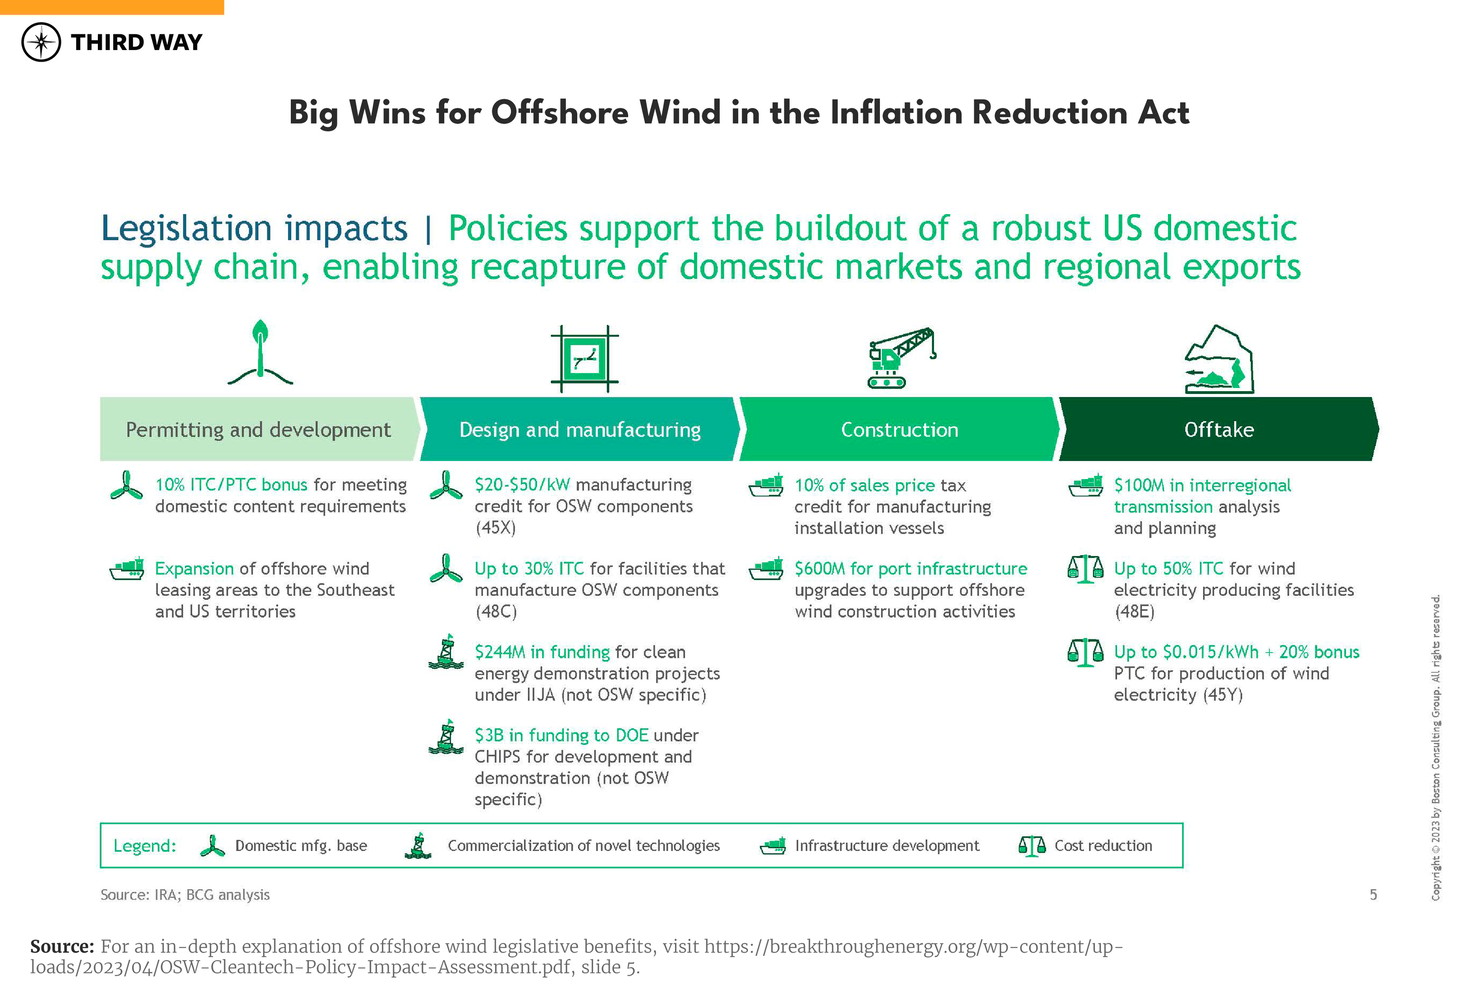
The US has seen enormous climate policy achievements over the past couple of years, most notably with the passage of the Inflation Reduction Act (IRA). With the IRA, Bipartisan Infrastructure Law (BIL), and the DOE Floating Wind Shot, offshore wind (OSW) energy has been given a huge runway for takeoff. Yet, despite these grand efforts, the US still has a lot of catching up to do. That’s because EU and Asian markets largely dominate offshore wind value chains, with ~95% of the market already captured.
However, the rewards in this space are worth competing for. In March 2023, the Boston Consulting Group (BCG) published a report on the second phase of an analysis commissioned by Third Way and Breakthrough Energy that investigated America’s competitive advantage for four clean energy technologies, including offshore wind. BCG estimated that, between now and 2050, the US could compete for a $1 trillion portion of the $4 trillion global offshore wind market--and stands a decent chance of actually capturing up to $500 billion dollars of that market.
If the US succeeds in this endeavor, it opens the door to creating over 90,000 new American jobs by 2050, and a chance to export floating offshore wind technology, materials, and expertise to nearby countries in the Americas.

Technology-wide Policy Recommendations
The US must deliver on multiple fronts to build a domestic offshore wind supply chain with regional export potential for floating offshore wind components. There are several technology-wide policy recommendations that touch on multiple value chain segments to consider. Prioritizing these can help deliver a viable and growing offshore wind market in the US.
Prioritize Transmission Buildout and OSW Project Permitting
Advancing US offshore wind deployment has specific requirements that differ from onshore power generation. On the transmission side, DOE leadership must collaborate with the Federal Energy Regulatory Commission, Regional Transmission Organizations, Independent System Operators, and the Bureau of Ocean Energy Management (BOEM) to ensure plans to connect offshore wind resources to the mainland grid are properly designed and underway. This is especially important for high voltage direct current (HVDC) transmission, which allows for more efficient and stable energy transmission over long distance ranges.
It is also essential to conduct permitting review and approval for new transmission and offshore wind projects swiftly, while balancing the necessary reviews required under the National Environmental Policy Act (NEPA). Current approval procedures for offshore wind projects can take over 11 years. This pace does not align with the necessary buildout of OSW required in the IEA’s Net Zero Emissions by 2050 Scenario and can delay America’s chance to secure export opportunities. Policymakers can address these barriers via new legislation that clarifies timelines and procedural requirements, allocating appropriations to properly staff BOEM, the National Oceanic and Atmospheric Administration (NOAA), the Grid Deployment Office (GDO), and other relevant offices, and harmonizing federal and state permitting processes. However, Congress must consider the values of the natural environment, tribal governments and communities, fishermen, and other stakeholders when streamlining permitting and siting.
New Location Opportunities for OSW Projects
DOI recently announced a first-of-its-kind Proposed Sale Notice for OSW projects in the Gulf of Mexico. If this proposal is finalized, areas off the coast of Louisiana and Texas will be auctioned for OSW development, with the potential to provide clean power to 1.3 million homes. Expanding project opportunity locations ensures progress towards the Biden-Harris Administration’s 30 GW by 2030 goal and allows for a more equitable spread of jobs and economic benefits across the country’s coasts.
Engage with stakeholders and ocean co-users
Due to a multitude of ocean users with various concerns and interests at play, the US must be mindful of the importance of stakeholder engagement. BOEM should continue to include ocean users in the development process, like conducting surveys, Requests for Information, and town halls. Also, regularly scheduled pre-leasing geospatial assessments can help define and navigate heavy co-use areas, such as major fishing zones, migratory wildlife routes, shipping routes, and energy areas as well as investigate how climate change impacts co-use zones—specifically when it comes to changes in wildlife patterns. By improving marine spatial planning, the US can limit OSW’s impact on wildlife, communities, local economies, and conflict with other ocean users.
Opportunities for Alignment Between Marine Conservation & Energy Production:
Ever wonder how energy infrastructure can coexist with marine wildlife? A project in France in collaboration with the University of Massachusetts Amherst is looking into how floating wind farms can also be a habitat for local species. Investigating co-habitation methods between various ocean stakeholders should be a continuous long-term strategy for the US.
Research, Development, and Demonstration (RD&D)
RD&D plays a major role in catapulting the US’s competitive edge in offshore wind energy. Over the years, the US yielded analytical leadership and IP to other regions and foreign businesses, which means their path to catching up will involve expediting innovation. These recommendations start with the most urgent point to address in order to maintain regional export potential, with the latter two suggestions touching on long-term research efforts that are wise for the US to start preparing solutions for now.
Accelerate RD&D for Floating Offshore Wind Technology
Floating offshore wind energy could provide many benefits to the US. First, deploying these wind turbines at deeper sea depths means they can capture higher wind speeds, with the ability to potentially provide half of the electricity needs to both coasts of the US. Second, since these turbines are farther out at sea, they will also leave less of a visible impact on America’s coastlines—a smaller but significant benefit for coastal populations who desire an unobstructed view of the coast.
While fixed offshore wind is already dominated by well-established foreign businesses, the floating offshore wind market is still nascent—giving the US a rare chance to capture a portion of a highly developed technology market and compete globally. Currently, the US ranks 7th in market “readiness” for floating offshore wind technology. There is opportunity for the US to advance as a global competitor in this market if it focuses on developing floating technology capabilities. The US also needs this technology to capture its offshore wind resource fully since most of it lies in deeper waters. For example, out of the ~4,200 GW of technical OSW resource potential in the US, 65% is in areas that require floating bases (60 meters or more in depth). Furthermore, BCG identified Central and South American regions as the only offshore wind exporting opportunities for the US. Within these regions, the majority of their offshore wind resources (85%) are in deeper waters that require floating technology. Therefore, America’s regional export potential is strongly dependent on its capability to lead in floating offshore wind.
One way the US can advance floating technology is by supporting a floating offshore wind demo program managed by DOE’s Office of Clean Energy Demonstrations. This program can help demonstrate floating offshore wind technology at various depths, while also targeting current obstacles, such as advanced subsea structures or dynamic cables. Additionally, increasing funding, maintaining proper staffing levels within WETO, and supporting National Labs that have OSW and innovation expertise, such as the National Renewable Energy Lab (NREL) and the Pacific Northwest National Lab (PNNL), will also propel the US in this area.
DOE’s Floating Offshore Wind Shot
New data from a recent Third Way and Evolved Energy Research study indicates that achieving DOE’s Floating Offshore Wind Shot target (cutting the cost by 70% to $45 per megawatt-hour by 2035) will deploy an additional 19 GW of floating offshore wind by 2050. The US could see over $94 billion in cost savings if it succeeds in this earth shot.
Increase Research Output and Transmission Planning for Energy Islands
Energy islands, manmade hubs that connect clean electricity offshore to the mainland, allow for the deployment of OSW farther away from the coastline and in deeper waters. Energy islands also offer a cost-effective way to couple offshore renewable electricity with energy storage and hydrogen production due to the reduction of transportation costs. Currently, Europe is also leading in energy island development. To remain competitive, the US should include energy islands in its long-term transmission planning for connecting offshore wind energy to the national grid and leverage progress made from existing research efforts. For example, WETO initiated planning with its West Coast Offshore Wind Transmission Literature Review and Gaps Analysis that addresses some of these offshore transmission concerns. The study found that offshore transmission systems will require substations or other methods to connect these offshore resources, which are estimated to be 15-50 miles off the west coast, to the mainland grid. Additionally, the Water Power Technologies Office’s National Marine Energy Centers (NMECs) can provide insight on how to connect offshore resources to the mainland. One of the initiatives under the NMECs is the Testing Expertise and Access for Marine Energy Research (TEAMER) program, which includes dynamic ocean cable demonstrations at various depths. As the US becomes more familiar with the potential of energy islands and considers deploying them, it would be wise to start drafting a legislative framework or executive action that allows for this technology to weave into our current system and electricity markets.
Don’t Forget About Infrastructure Resiliency
Offshore wind turbines are already designed for harsher marine conditions and have an average lifespan of 20-25 years. However, climate change and subsequent extreme weather will continue to impact energy systems and infrastructure now and in the future. With this in mind, offshore wind farm designs must adapt to the increased likelihood of higher storm frequencies, hurricanes, and extreme heat. Port infrastructure, cable landing sites, and transformer stations are other areas that will require resiliency upgrades due to a higher frequency in storms, sea level rise, and storm surges. Long-term strategic actions, such as additional funding streams for researching how to make OSW infrastructure more resilient or federal weatherization cost-share agreements with industry, can help decrease premature replacements, onsite labor needs, and resource waste as future supply chain shortages of feedstock materials are anticipated. Additionally, more modeling and research output on how climate change impacts ocean energy can better inform offshore wind turbine designers of new design safety features during extreme weather conditions.
Policy Recommendations for 3 Priority Value Chain Segments
1. OEM (Original Equipment Manufacturers)
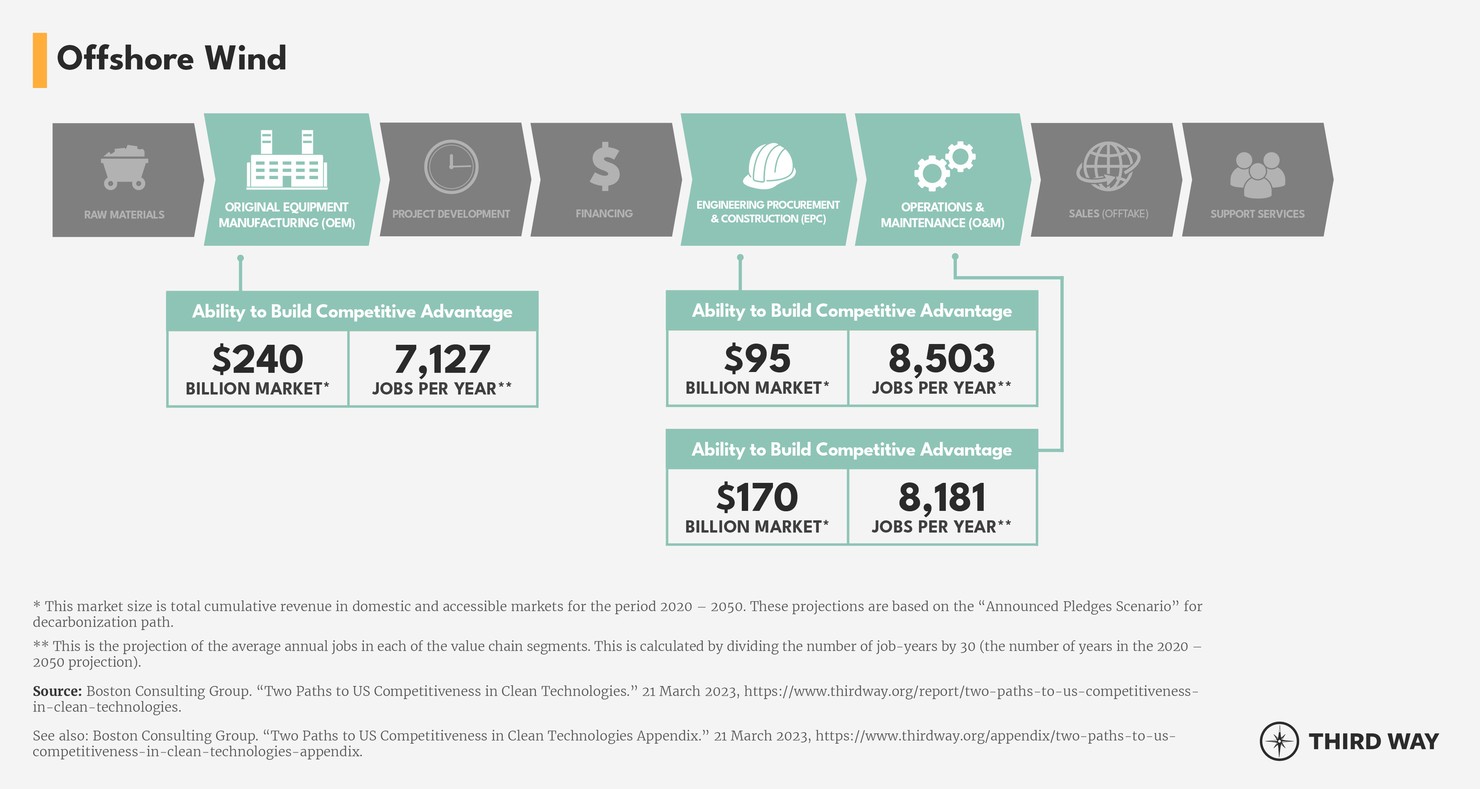
Out of the three value chain segments where the US has strong competitive advantages in offshore wind, OEM has the highest market potential, with up to $250 billion in SAM opportunity from 2020-2050. The US must move quickly to create a domestic manufacturing base to service its offshore wind supply chain. Luckily, the IRA domestic manufacturing incentives, like 45X and 48C, gave the US a lift in this area. However, there are still some gaps the US must address.
Manufacturing Automation
In addition to IRA subsidies, automation in offshore wind OEM can help build up our supply and capacity faster, while also reducing manufacturing labor costs. Further research into advanced techniques will help to scale US OEM capabilities.

2. O&M (Operations & Maintenance)
O&M is the second largest opportunity for the US in the OSW value chain, with a serviceable addressable market of up to $180 billion between 2020-2050. While all other value chain segments for OSW peak between 2030-2040, O&M maintains momentum through 2050. Strengthening this value chain segment will bump competitiveness and offer long-term good-paying jobs to Americans across the country.
Supporting workforce development
We see a lot of occupational opportunities when enhancing this domestic supply chain. According to BCG’s study, offshore wind is expected to create over 245,000 jobs years in O&M between 2020-2050. On top of job creation, there’s also a huge opportunity to transition workers in the Oil and Gas (O&G) industry, due to an overlap in O&M skills, such as subsea and platform maintenance. Federally supported registered apprenticeships are a great way to train and support new and transitioning workforces. The Department of Labor would ideally oversee this program in partnership with union-led training and community colleges. Additionally, a follow up to NREL’s US Offshore Wind Workforce Assessment with a comprehensive regional workforce analysis would help provide a roadmap on the timing of job needs, their geographic distribution, jobs requirements that are supply chain adjacent (such as manufacturing), and anticipated opportunities for overlap with the O&G industry for transitional training purposes.
Turbocharge the construction of Jones Act-compliant O&M vessels
Due to the restrictions under the Jones Act (Merchant Marine Act of 1920), which require shipping between US ports to only use US-made vessels with a US crew, there is a shortage of legally viable vessels (both for O&M and EPC) to conduct offshore wind development. However, as much as the Jones Act is constraining, it is here to stay and the US must plan accordingly to build up this supply chain within these restraints. On a positive note, it ensures the creation of quality American jobs along the way. The ECO EDISON will be the first Jones Act-compliant service operations vessel (SOV) in the US upon completion. This SOV will help transport materials and technicians to wind turbines and back and will create manufacturing jobs (many of which overlapped with oil and gas shipbuilding skillsets) across 12 states. The quicker the US can move on building out this fleet, the better its competitive edge will be.
Harness the benefits of remote-operated devices
Much of the O&M activities for OSW will continue to rely on human labor, but there is a certain amount of O&M that automation can help with—especially for floating offshore wind. The US can lean on its remote sensing, drones, and autonomous systems expertise to cut down labor costs, conduct predictive maintenance, and investigate OSW turbines during unsafe conditions.
3. EPC (Engineering, Procurement, and Construction)
EPC is the third highest value chain segment for US competitiveness in offshore wind, with an addressable market of up to $100 billion between 2020-2050.
Establish Industry-Wide Standardizations
Establishing industry-wide standards for component size and weight can help prolong the use of support infrastructure, like ports and vessels. Thus, reducing the need for early replacements and making the EPC supply chain segment more efficient.
Focus on Port Infrastructure
The US is home to a lot of aging ports. Upgrading these ports and making sure they are ready to support an offshore wind boom, is critical to building a strong domestic supply chain. Luckily, the IRA included $600 million for port infrastructure upgrades to support offshore wind development, which is a great starting point. In addition to maintaining America’s ports, there will also need to be a focus on constructing new ports. For example, the Port of Long Beach’s Pier Wind, will be the largest facility aimed at supporting floating offshore wind manufacturing and assembly on the West Coast.
Conclusion
BCG estimates the US’s highest level of competitiveness in OSW is achievable if it scales up a supply chain in the next five years. That’s a big ask, especially since new NREL estimates find building a domestic supply chain takes between 6-9 years. Moreover, there are already European and Asian OSW developers in South America, such as in Brazil, meaning US regional export potential only remains positive if it builds up in time. However, the US can still catch up and maximize its competitive edge. To do this, the US must do its due diligence to balance long- and short-term planning to ensure the longevity of its offshore wind supply chain and secure competitive leadership across priority value chain segments.
Regardless, the US can and should grow its domestic OSW supply chain for two reasons. First, the US will be able to service its own supply needs with American jobs and components. Second, floating offshore wind technology advancement opens the door for the US to become a regional exporter. With recent legislation and executive climate targets announced, the US created a great regulatory foundation for offshore wind. If it prioritizes advancing floating offshore wind technology, as well as the OEM, O&M, and EPC supply chain sectors, the US has a chance to catch up to its competitors and lead a niche part of the global offshore wind market.

