Memo Published February 6, 2020 · 11 minute read
Trump’s Costly Trade Wars
Sunny Glottmann
Takeaways
In December 2017, Trump gave a rousing speech, vowing to give the American people “a giant tax cut for Christmas.”1Leaving aside the fact that those tax cuts were mostly for businesses and the wealthiest Americans, Trump conveniently forgot to mention that he was also gifting the American people the largest and most costly trade war since the trade war started by President Hoover.
While an agreement on the United States-Mexico-Canada Agreement (USMCA) is a win thanks to the tireless efforts of Speaker Nancy Pelosi and House and Senate leaders, Trump’s costly trade wars have hurt the very same working families he claims to protect. In this memo, we look at how Trump’s trade wars have raised prices, stifled economic growth, and hurt American manufacturing workers and farmers.
Under Trump’s trade wars:
- The US trade deficit reached its highest point since the Great Recession, $684.1 billion in the fourth quarter of 2018.2
- The US trade deficit in goods is the largest of all time and more than $100 billion worse than any year under the Obama Administration.3
- The US economy has lost nearly 200,000 full-time jobs and $64 billion in long-term real GDP, according to the Tax Foundation4
- The CBO reports that under the current tariff schedule, consumer prices will rise by 0.5%, reducing average real household income by about $1300.5
- Trump promised that tariffs would reduce our dependence on Chinese imports, incentivizing us to buy more goods “Made in the USA”. Instead, Taiwanese, Mexican, and Vietnamese imports are booming.
- Taxpayers are spending $28 billion to bail out farmers who are unable to export their crops abroad.6In 2019, farm debt is projected to reach a record-high of $416 billion.7
What are the effects of Trump’s trade wars?
Since his election, Trump has taken a series of actions with the goal of getting America better deals with our trading partners. His favorite weapon: tariffs, which have become the centerpiece of these trade wars. What Trump fails to recognize is that tariffs are not abstract dollars paid by our “enemies” to support American factories. Tariffs are paid by consumers every day when they buy their groceries, or a new car, or go holiday shopping. In other words, tariffs are a tax imposed on Americans every time they open their wallets.
Since January 2018, Trump has imposed the following tariffs:
- 10% to 25% tariffs on $362 billion worth of Chinese goods.8In response, China has imposed retaliatory tariffs, ranging from 5 to 25% on approximately $91.1 billion of US exports.9
- Import tariffs of 25% on steel and 10% on aluminum.10In total, $26.4 billion of steel and aluminum have been impacted by the tariffs, creating an additional cost burden of $4.6 billion for consumers.1112
- “Global safeguard tariffs” on $8.5 billion in solar panel imports and $1.8 billion in washing machine imports.13
President Trump has argued that an “America First” trade agenda—bringing trade partners back to the negotiating table, being tough on China, and protecting America’s manufacturing industries—would lower the trade deficit and benefit US workers. Instead, his policies have created a greater trade imbalance, alienated our top trading partners, and hurt Americans on two fronts—rising prices for consumers and businesses.
Here is how Trump’s trade wars are affecting Americans and the rest of the world.
1. The U.S. trade deficit has ballooned under Trump’s trade wars.
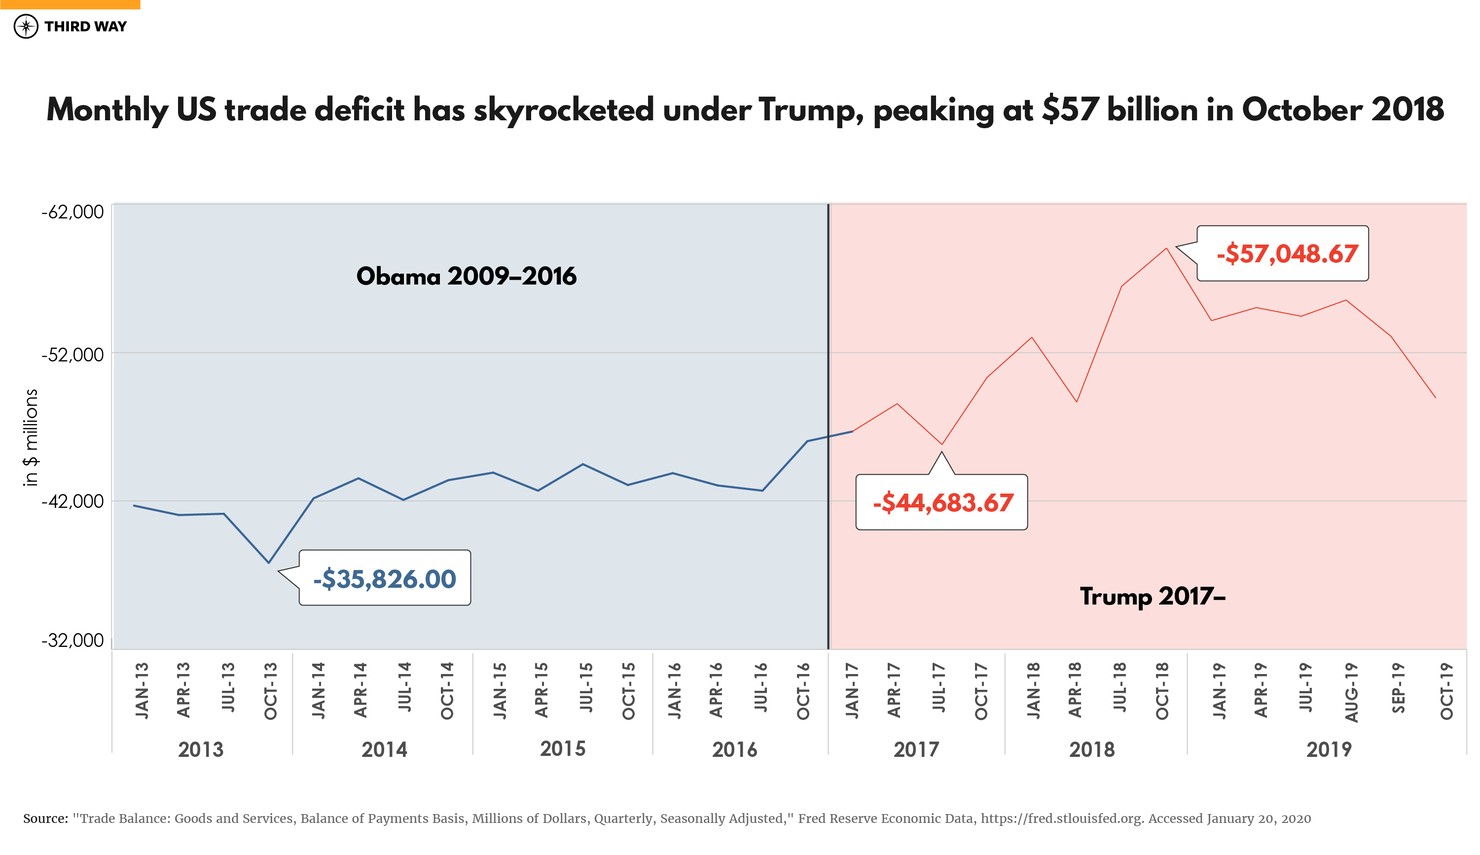
When Trump took office, the total US trade deficit was at $570.9 billion. By the fourth quarter of 2018, the US trade deficit has increased nearly 20% ($114 billion), peaking at $684.1 billion.14The US monthly trade deficit in goods and services peaked under Trump in October 2018 at $57 billion.15
Trump claimed that implementing trade protectionist policies would reduce the United States’ trade deficit, and yet, under President Trump the average monthly trade deficit in goods and services is $50.1 billion, almost $10 billion higher than the average monthly trade deficit in goods and services during Obama’s second-term ($40.7 billion).16
In 2018, total American exports fell by $7 billion from the previous year, while imports grew by $17.8 billion.18Despite tariffs increasing the prices of foreign goods, we still continued to purchase more foreign goods than we had in years past. As foreign countries, especially China, chose to purchase less US goods, decreased export revenue has counteracted the benefits of reduced imports.19Consequently, tariffs do not reduce the trade deficit, but they do incentivize our trading partners to buy less American goods.
Trump’s trade wars have reduced the competitiveness of American goods and services. In 2018, nearly 15% of US goods imports, over $300 billion worth of goods, were covered by some form of trade protection.20In retaliation, our top trading partners have increased tariffs on 8.2% of US exports, raising tariffs from an average of 7.3% to 20.4%.21On steel and aluminum alone, the EU has imposed retaliatory tariffs on US exports worth $3.2 billion.22
2. Trade barriers reduce economic growth.
The Federal Reserve found that, in 2018, trade uncertainty contributed to a 1% decline in total US investment.23According to the CBO’s most recent “Budget and Economic Outlook” report, “higher trade barriers—in particular, increases in tariff rates—implemented by the United States and its trading partners since January 2018 reduce the level of real (that is, inflation-adjusted) U.S. (GDP) by roughly 0.3 percent by 2020.”24Moreover, the Tax Foundation has estimated that Trump’s tariffs have “reduce[d] long-run GDP by 0.26 percent ($64.11 billion) and wages by 0.16 percent, and eliminate[d] 198,700 full-time equivalent jobs.”25
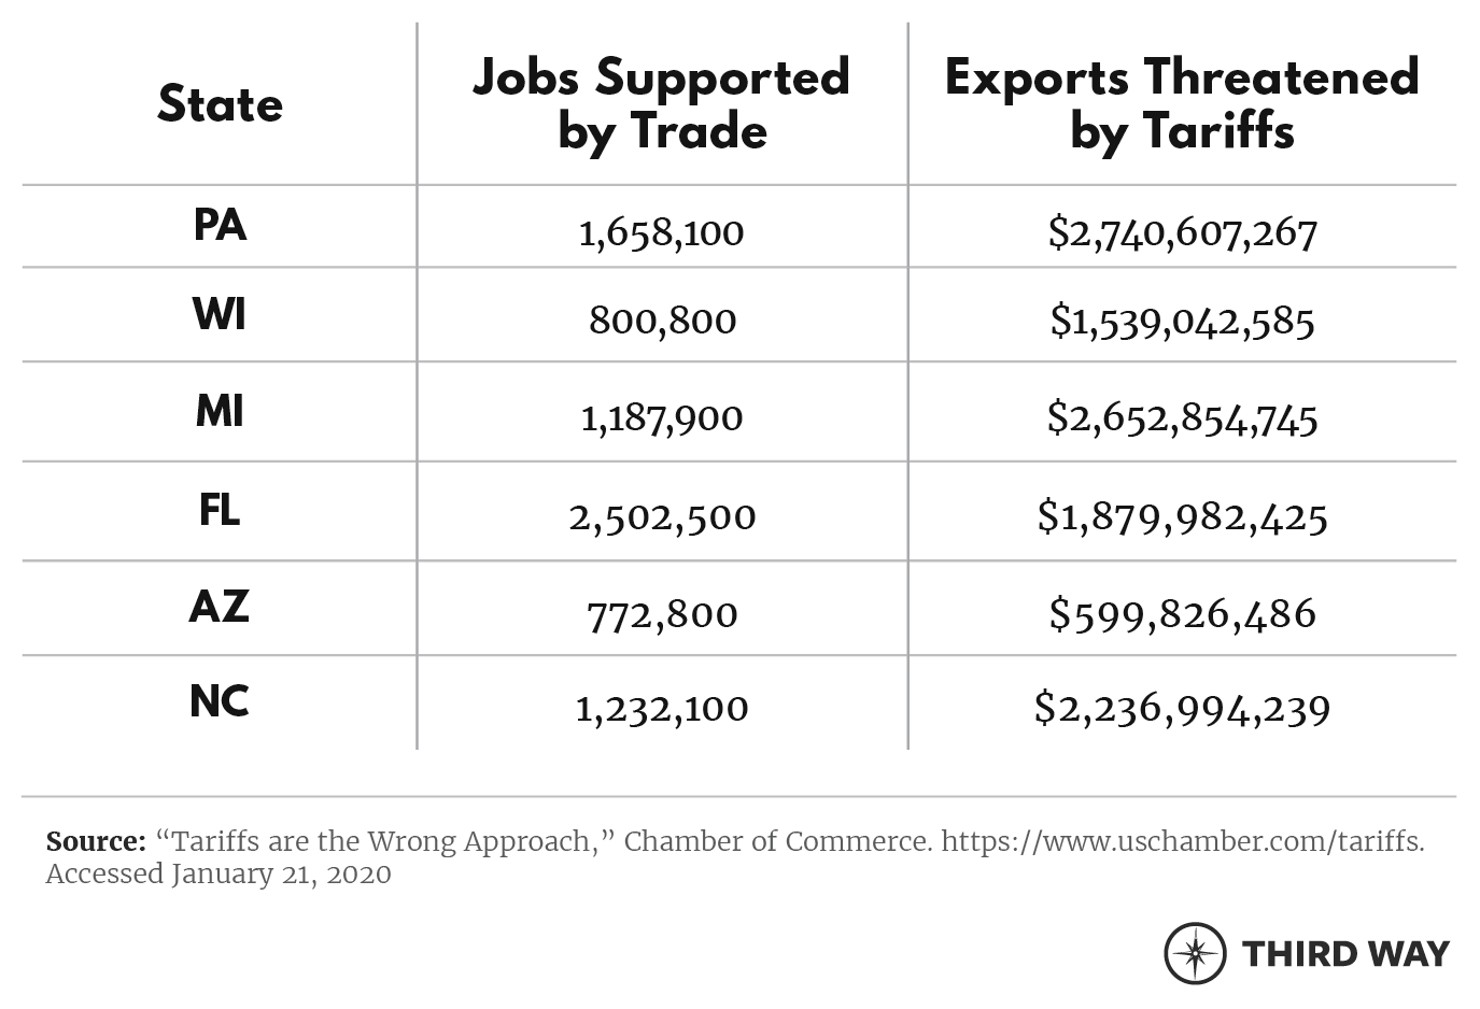
Moreover, a recent study put out by the Chamber of Commerce, shows how tariffs are uniquely impacting states’ economies. For instance, battleground states’ economies include 8.1 million workers impacted by trade and $11.1 billion of exports threatened by tariffs.26
Even if Trump removed every tariff he has imposed tomorrow, the damage done by Trump’s trade wars will continue to cause ripple effects through the United States and global economy. President Trump often touts his business acumen as being precisely what America needs to get the economy “booming.” But what businessman would deliberately enact policies that lower investment, cut jobs, and reduce short and long-term economic growth?
3. Tariffs are a tax paid out of Americans’ wallets.
Trump’s tariffs are an $88 billion tax on Americans.27A recent study found "tariffs continue to be almost entirely borne by U.S. firms and consumers."28Consequently, in 2019 alone, the trade war with China will cost an average American family $1,277 through lowered wages and increased prices for household items.29Tariffs function no differently than a sales tax, which impacts lower-income families hardest. For low-income earners, purchasing groceries, clothing, and other necessary household items takes up a larger share of their budgeted expenses than for wealthier households, hence Trump’s tariffs are causing the greatest burden to families already experiencing economic hardship.
4. American industries are hurting.
Trump’s trade wars have cost American businesses $45 billion.30Trump’s tariffs on steel and aluminum have been disastrous for the manufacturing and construction industries. Trump claimed that protecting domestic steel and aluminum would create more jobs, but the rising price of steel and aluminum has led to job losses and a decline in manufacturing output that has far exceeded the new jobs created in the steel and aluminum industries. In the United States, there are 282,000 steel-producing workers and 72,000 aluminum-producing workers, accounting for approximately 0.2% of the total private workforce.31Steel and aluminum-using industries, like manufacturing and construction employ a far larger share of the workforce and benefit from lower prices. Now, they are paying 9% more for steel.32Meanwhile, after imposing 25% tariffs on steel, US steel production only rose by a paltry 2% between the third quarter of 2017 and the end of third quarter 2019.33US steel producers lacked the necessary market share to set prices lower than global competitors. Economists estimate that for each of the 12,700 jobs at steel and aluminum factories that have been “saved,” Americans are paying $815,000 per job.34
Consequently, since enacting trade barriers, American consumers and businesses have lost $51 billion, paying higher prices for consumer and intermediate goods.”35From the US-China trade war alone, $10 billion of goods used in the construction industry are getting hit with tariffs, raising prices by an additional $2.5 billion.36It is no surprise that the supply of completed housing units has “decreased one percent in the second quarter of 2019, the biggest decline in six years.”37
5. American manufacturing is hurting.
Trump claimed that imposing tariffs would help make American manufacturing more competitive in the global economy. Yet, since Trump began his trade wars in 2018, the manufacturing industry has not experienced the triumphant renaissance it was promised.
The Blue Wall states of Michigan and Wisconsin—both with high rates of manufacturing employment—were promised that increasing tariffs on steel, aluminum, and Chinese goods would make it easier for American factories to compete. Trump has frequently prided himself on identifying with blue collar workers, but, compared to Obama, Trump has failed to create sustainable manufacturing job growth in the Blue Wall states. For example, in the last three years of Obama’s presidency manufacturing employment in Michigan grew 10.7%.Under Trump, Michigan’s manufacturing employment only has only grown by 1.8%, almost 9 percentage points lower than Obama over a similar time frame.38 In Wisconsin, there has been essentially zero growth in manufacturing employment since Trump instituted his first tariffs in January 2018.39 Escalating tariffs are not bringing back manufacturing jobs and securing greater economy opportunity for manufacturing workers in these critical voting battleground states.
Likewise, manufacturing productivity has not soared under trade protectionism. One indicator of manufacturing productivity is the volume of railroad activity. Rail carloads for manufacturing inputs—often a leading indicator for the broader economy—fell 3.5% year-over-year in 2019, reflecting lower manufacturing activity.40Experts predict that regardless of imminent trade deals, tariffs have changed supply chains to the detriment of American industries. We are only now beginning to witness the full impact of Trump’s trade wars on the US manufacturing industry.
Trump won in 2016 by promising to protect manufacturing jobs in the Blue Wall, and yet, it turns out trade protectionism does not do any favors for your average manufacturing worker.
6. American farmers are hurting.
The agriculture sector has been hard hit on two fronts: rising costs on steel are increasing farmers’ productions costs, while retaliatory tariffs of agricultural exports are forcing farmers to lower the price of their crops.41In response to China halving its demand for US agricultural exports, the United States is subsidizing American farmers for up to $28 billion for their lost export sales.42At its present level, government assistance covers 40% of farmers’ incomes.43Even with assistance, farmers are experiencing an alarming increase in bankruptcies. For example, 580 Chapter 12 bankruptcies were filed on behalf of farms between September 2018 and 2019, up 24% from 2018.44Farm debt is also on the rise, and 2019 saw the highest amount of farm debt recorded in US history—a staggering $416 billion.45
7. Trump claimed that by protecting trade we’d have more goods “Made in the USA”. Now, we are buying more goods “Made in Taiwan”.
Trump claimed that increasing tariffs on China would incentivize manufacturing firms to return to the United States. But this claim has not panned out. Because of higher input costs and rising wages, manufacturing firms are often either staying put or relocating to other countries.46Since tariffs have been imposed China has retained “75% of its trade in the products affected by tariffs.”47In other words, China’s import market to the United States has only shrunk by one fourth ($35 billion).48Trump assumed that domestic producers would step in and take over those markets but, most of what we bought from China is now being bought from other countries, not the United States. Sixty-three percent of lost Chinese imports have been replaced by imported goods from other countries. So far, the biggest winners of Trump’s trade war with China have been Taiwan, Mexico, the EU, and Vietnam. Taiwan’s imports to the United States increased by $4.2 billion, Mexico’s imports to the United States have increased by$3.5 billion. Compared to last year, US imports from Vietnam have gone up 33.4%, a $2.6 billion increase.49This money isn’t going back into US factories and workers; instead, it is just making other countries richer.
Conclusion
Trump’s record on trade wars is clear—and it’s far from good. He has unilaterally waged multiple trade wars that have alienated our strongest allies. He has made China, one of our main economic competitors, a more viable trading partner to the rest of the world. He has erected new and unsustainable barriers to free trade. And, he has punished American consumers, farmers, factory workers, and businesses throughout.
America has led the world in creating more open and fair markets for decades. Our trade policies moving forward must return to these American values in order to ensure that we remain a dominant economic force in the global economy.