Memo Published November 22, 2024 · 13 minute read
What Voters Told Democrats in 2024
David de la Fuente & Lanae Erickson

It would be an understatement to say that Democrats did not get the result they wanted in the 2024 election. Heading into Election Day, most prognosticators, pollsters, and experts saw the election as extremely close, which was true to form with one of the smallest polling errors in swing states in recent memory. But ultimately, voters across nearly every demographic and geography shifted to the right enough to hand Trump a clear victory and a majority in both the House and Senate.
To gain a better understanding of what happened and where Democrats must go from here to defeat the MAGA forces that will now control every lever of government in Washington, Third Way partnered with Global Strategy Group to field a post-election survey of voters in Presidential battleground states.1 In it, we aimed to understand what message voters were sending to Democrats in 2024, and how the party might address those concerns and reassemble a solid coalition to win in future cycles.
Who Voters Trusted on the Issues
Let’s start with the simplest explanation for the top of the ticket results: by the time Americans cast their ballots, Donald Trump had built up large leads with voters on who they trusted to handle the issues that were the most important to them.
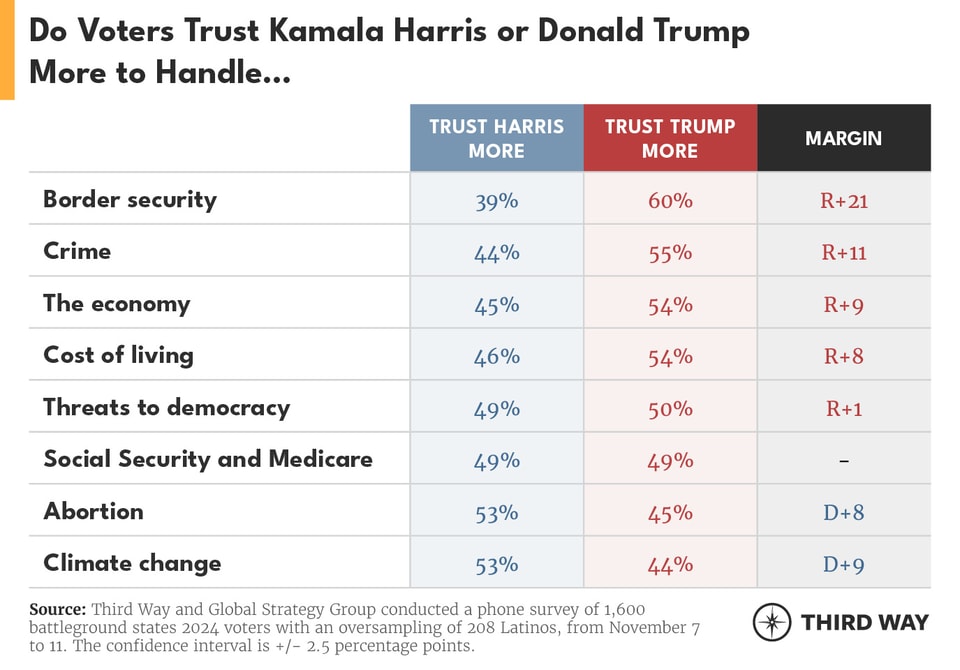
In our poll, voters said they trusted Trump more than Harris on border security by 21 points (60% to 39%), crime by 11 points (55% to 44%), the economy by 9 points (54% to 45%), and the cost of living by 8 points (54% to 46%). It’s hard to imagine how a candidate can win when voters say they prefer their opponent by wide margins on the issues that have topped every priority list all cycle. Among persuadable voters (those who said they considered voting for both Harris and Trump), Harris suffered a punishing disadvantage on the economy at 24% to 75% for Trump (a 51-point deficit) and on cost of living at 30% to 67% for Trump (a deficit of 37 points). Even worse were the numbers on crime and border security, where less than one-fifth of persuadable voters trusted Harris over Trump. With crime, 18% of persuadable voters trusted Harris to 81% for Trump, and with border security, it was just 13% for Harris to 86% for Trump.

Latino voters generally trusted Harris more than Trump on every issue, but one stood out as particularly strong for him and likely helped contribute to his gains among the group. On border security, Latinos only trusted Harris more by a 54% to 45% margin, which was Harris’ only single-digit advantage with Latino voters. In fact, Latinos trusted Trump more on border security than on any other issue we tested.
The two issues that saw the nominees basically tied are ones that will befuddle Democrats. On Social Security and Medicare, the candidates tied at 49% each, and on threats to democracy, Trump negligibly beat out Harris 50% to 49%. The only two issues on which Harris sported an advantage were abortion (53% to 45%) and climate change (53% to 43%).
When it came to college-educated white voters, a mainstay of the current Democratic coalition, they trusted Harris 13-points more on abortion, 11-points more on threats to democracy, and 10-points more on climate change than the general population, but they only rated her five points better on the economy and crime and seven points better than all voters on cost of living and border security. It would be fair to suppose that college-educated white voters saw Harris as representing their cultural values, but they were still timid in their trust on pocketbook and safety issues.

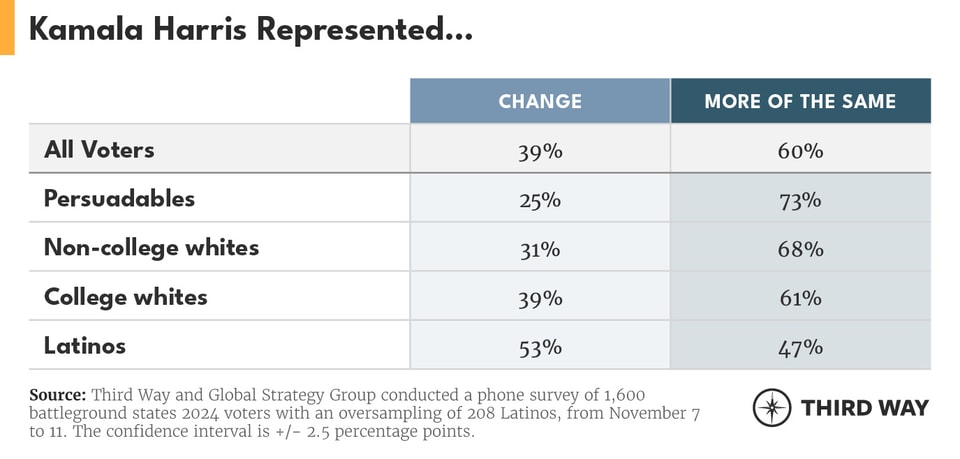
Heading into the election, Harris tried valiantly to present herself as the candidate of change moving past the Trump era of electoral politics. However, when voters were asked if Harris represented a change or more of the same, they overwhelmingly said “more of the same” by a 21-point margin (39% to 60%). For persuadable voters, that margin increased to 48 points, with 73% saying Harris represented more of the same and only 25% saying she represented change. In a moment where the electorate was dissatisfied with the status quo, this perception alone might have been enough to doom the Vice President’s chances.
Ideology & Which Party Was “Extreme”
The American electorate has long leaned more conservative than liberal, with a plurality of voters describing themselves as moderate. This ideological asymmetry means that Democratic presidential campaigns can only win if they woo a supermajority of moderate voters.
Aligning with this longstanding electoral fact, respondents in our poll self-identified as 42% moderate, 35% conservative, and 23% liberal. Democrats were evenly split, with 47% calling themselves liberal and 47% moderate, while Republicans broke towards their ideological base, with 67% calling themselves conservative and 33% calling themselves moderate. A supermajority (63%) of Independents considered themselves to be moderate, with conservatives and liberals each representing under 20% in that group. Not surprisingly, over 90% of liberals voted for Harris and over 90% of conservatives voted for Trump. But that means Trump started with a big lead, given that there are simply more conservative voters than liberals in America. Harris did win moderates, but only by a 10-point margin—52% to 42%. That simply wasn’t enough to win an election as a Democrat in this center-right country.
On the ideological breakdown, educational attainment among white voters made a big difference. White voters with a college degree reported themselves to be plurality moderate at 43%, but the rest were equal parts conservative (30%) and liberal (27%). However, white voters without a college degree were much further to the right. A plurality called themselves moderate in this group as well, at 42%, but the remainder broke 40% conservative to only 18% liberal.
Latinos clocked in at even more moderate than the general population (47% compared to 42% for the latter), though a bigger chunk of non-moderates described themselves as liberal (31%) than conservative (20%). Voters who considered voting for both Harris and Trump were about 20 points more moderate than the general population, coming in at 62% moderate, 11% liberal, and 25% conservative.
To gain a deeper understanding of these ideological currents, we also asked voters to place themselves, Harris, and Trump on a scale from o to 10—with 0 being completely liberal and 10 being completely conservative. The mean response for Harris was 2.45, while the mean response for Trump was 7.78, indicating that both were viewed about as far away from the middle (5) with Trump being 0.23 points further off-center than Harris. However, voters mapped themselves at a slightly right of center 5.63. That means Harris was perceived as 3.18 points to the left of how voters viewed themselves, compared to Trump being perceived as 2.15 points to the right. While a one-point difference may not seem significant, these ratings are like a Richter scale, so when voters put themselves that much closer to Trump, it’s an indication of a real problem for Democrats.

When asked to describe the candidates at the top of the ticket in a word or two in an open-ended question, this ideological gap became even more obvious. In their own words, voters described Harris as smart, qualified, and intelligent—but the word that predominated was “liberal.” For Trump, “strong” and “leader” were the most cited descriptions. Among key voter groups like persuadables, late deciders, ticket splitters, and low-propensity voters, the word “liberal” was even more prominent when describing the Vice President.

According to our data, Trump came out of Election Day with better favorable ratings, which appears to be a reversal from most preelection polls. In this post-election survey, voters were split nearly evenly in their opinions of Trump (48% favorable to 50% unfavorable) compared to Harris at negative six net favorability (46% to 52%). One thing that is clear though is that Harris and the Democratic brand were in sync in the minds of voters in a way that Trump and the Republican brand weren’t. Views of the Democrats in Congress were at negative seven favorability (44% to 51%), which was identical to Harris. However, Republicans in Congress were significantly less popular than Trump coming in at negative eight favorability (43% to 51%)—a six-point difference in Trump’s favor.
White voters with a college degree viewed Harris slightly better than the general population, with 48% favorable to 50% unfavorable opinions. Unsurprisingly, they viewed Trump much less favorably at 43% to 56%. Democrats in Congress were at negative six with this voter group (44% to 50%), while Republicans in Congress clocked in at a brutal negative 20 points (37% to 57%). By contrast, White voters without a college degree viewed Harris in an extremely unfavorable light, with her sporting a nearly two-to-one disadvantage coming in at 35% favorable to 63% unfavorable. White non-college voters loved Trump, and he commanded a nearly plus 20-point favorability rating with this group at 59% to 40%. Democrats in Congress were close to Harris at 35% to 60%, while Republicans in Congress significantly lagged Trump at 53% to 42%.
Latinos liked Harris more than the general population did, and they gave her a 55% to 42% favorable rating compared to Trump’s 38% to 60% unfavorable rating. Congressional Democrats closely matched Harris with Latinos, at 53% to 40%, but Republicans in Congress were notably worse than Trump at 30% to 65%, which amounts to a double-digit share of Latinos liking Trump but not Congressional Republicans.
Persuadable voters ended up viewing Harris extremely unfavorably at 28% to 61%. They didn’t love Trump and were less fond of him than was the general population, but they gave him much better marks than Harris, as he clocked in at 42% to 51%. In our poll, this group claimed to ultimately choose Trump at the end by a 49% to 23% margin. However, in the five Presidential battleground states that also hosted Senate races, this group basically split, with 41% voting for the Senate Republican nominee to 40% for the Senate Democratic nominee.
Perhaps most tellingly, when asked which party was more extreme, 44% of respondents chose the Democratic party, 41% picked Republicans, and 12% said both. While the lead Democrats have on this measure is close to the margin of error, the fact that it is even close should send a shock through the veins of the entire anti-Trump coalition.
The Path Forward Voters Want from Democrats
To her credit, Kamala Harris attempted to run as a mainstream, moderate candidate in her 107-day sprint of a general election campaign. And it turns out that voters liked the positions she ran on this cycle. But they also harbored serious questions about the Democratic Party on many issues that weighed down Harris’s efforts to land her pivot effectively.
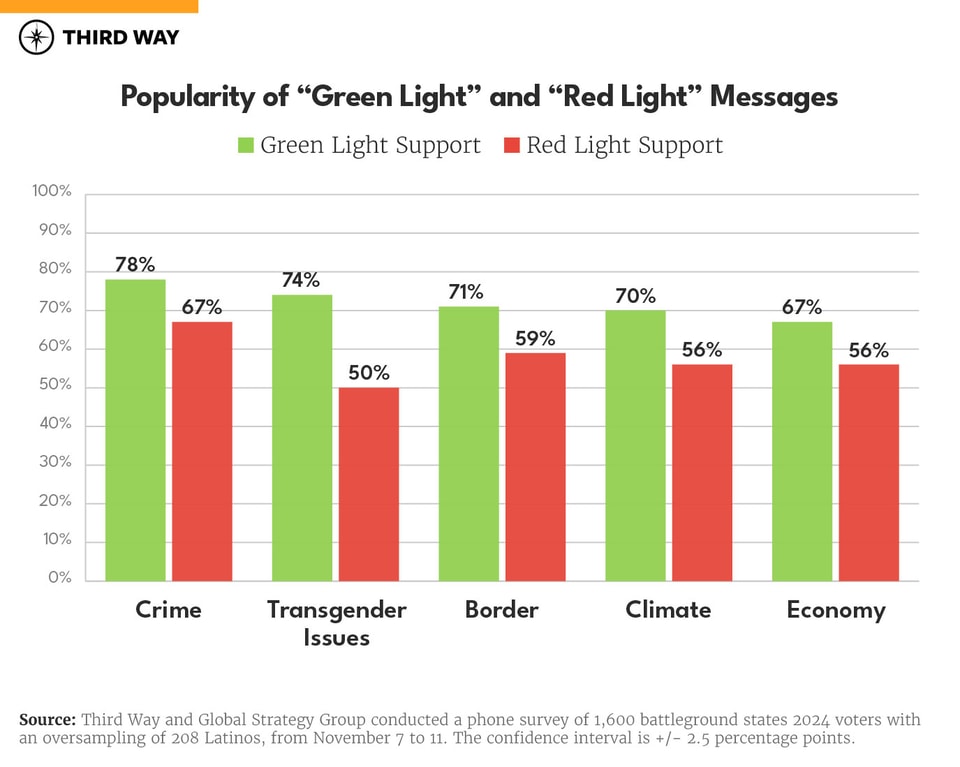
In our poll, we tested “green light” stances, which were center-left positions and messages advocated by Harris, as well as “red light” positions, which were far left ones that Trump paid communication highlighted, sometimes with archival footage of Kamala Harris from her time in 2019 running for President in a Democratic primary. Since each of these messages were only offered in a positive light with no pushback, all polled above 50%, but the range spanned 28 points from a low of 50% to a high of 78%, and results should be read with that context, meaning bare majority support is a middling result, at best. In every single instance, on all five issues we tested, the moderate message garnered significantly stronger support than that of the far left.

The most popular message overall was the crime “green light” message, which had 78% support for “holding violent criminals accountable, keeping guns out of criminals' hands, and ensuring law enforcement has the resources and training they need to keep communities safe.” White voters with a college degree gave this 86% compared to 73% for non-college white voters, which is a substantial gap, but it is still incredibly high marks across the board for crime-conscious demographics.
The “green light’ climate message we tested talked about becoming “more energy independent by continuing to produce more oil than any country in history and exploring clean energy opportunities that will create more jobs and stimulate the economy.” This polled at 73% and was popular with white voters regardless of educational attainment. The “red light” climate message, which focused on “banning fracking” and the need for “transformative change” garnered 56% support overall even without any message pushback. A majority (50%) of non-college whites opposed the “red light” climate message, and even 41% of college-educated white voters felt it clanged. Latinos were skeptical of the “red light” climate message, and among persuadable voters, the climate “green light” messaging had 74% support compared to the “red light” at 50% support.
On border, which as a reminder was Trump’s strongest issue among Latinos, the “green light” message emphasizing the need to restore order at the border had a 71% support rating among Latinos. College-educated whites were also big fans of the “green light” border message, with 74% in support. Among persuadable voters, the “green light” immigration position dominated at 74%, with the “red light” message clocking in 23 points lower at 51%.
Again, most of these messages performed well in a positive vacuum, but the “red light” message around transgender issues was the exception. Only 36% of persuadable voters supported transgender rights when framed this way. However, there is evidence that strong positive communication on these issues works, as the “green light” message had 66% support. This version referenced parental rights, stating “they recognize the importance of parents having a say in what goes on in their kids' lives. When it comes to transgender youth, they believe decisions should be left up to parents and families because we all deserve the freedom to make personal choices about our lives without the government telling us what to do.” When articulated thoughtfully, these messages appealed to voters across the ideological and demographic spectrum.
Importantly, the moderate-coded “green light” messages performed well with self-described Democrats as well, with each garnering 85% or more support. The “red light” messages didn’t do better even with this base group, and in fact they even garnered slightly lower support numbers with Democrats on some of the issues we tested.
Conclusion
Ultimately, the last-hundred-day push to the middle by VP Harris was not sufficient to counter the weight of the party brand, despite the policies and messages she touted being popular. Down-ballot Democrats who had longer runways to execute campaigns centered on moderation and popular mainstream policies fared better, because they created their own brand, and down-ballot Republicans could not match Trump’s strengths. While it is extremely unlikely that Trump will ever be on a ballot again, Democrats will still need a long-term plan to rebrand the party as one of sensible ideas that can be trusted to handle voters’ highest priority issues, particularly economic and safety concerns. If the party has any hope of defeating the MAGA forces now at the helm of government in the midterms and beyond, it needs to swiftly execute this shift to the center.

