One-Pager Published January 24, 2024 · 3 minute read
Who Owns America's Franchise Businesses?
Imani Augustus

One of the greatest challenges at the start of any entrepreneurial journey is establishing a strong customer base. That’s why thousands of small business owners are operating franchise businesses, which afford them structure, brand recognition, and ongoing support from a franchisor on day one. In this brief, we examine the Census Bureau’s Annual Business Survey to uncover who owns America’s franchise businesses. The data, spanning the years 2019 to 2021, breaks down the number of minority and non-minority employer franchises among other key variables. Below, we unpack four key findings:
1-in-4 franchise businesses are owned by a person of color.
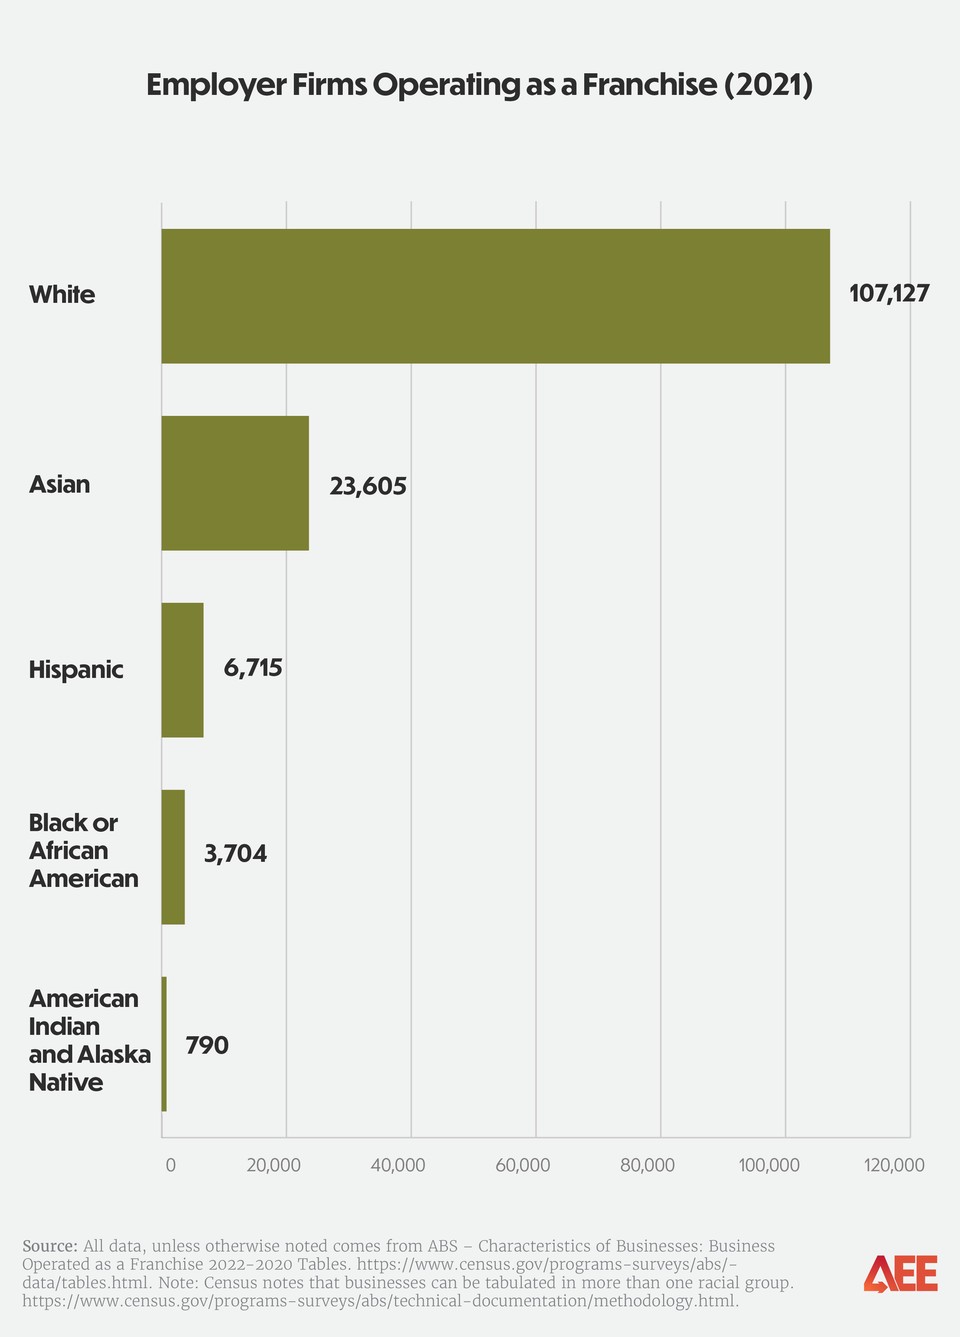
In 2021, there were 138,914 employer firms operating all or part of their business as a franchise. Of those, more than three-quarters were white-owned businesses. White-owned businesses outnumbered Asian Americans, the second largest demographic of franchise owners, by 4.5-to-1. Hispanic business owners accounted for close to 5% of all franchise firms while Black businesses made up less than 3% of total firms.
Notably, American Indian and Alaska Native-owned businesses have shown the highest growth rate among franchise employer businesses from 2019 to 2021, followed by Black-owned businesses. Asian-owned businesses, however, experienced a slight decrease during this period with a loss of 1,548 businesses.

Retail and food service franchise businesses rebounded by more than 10% after COVID-19.
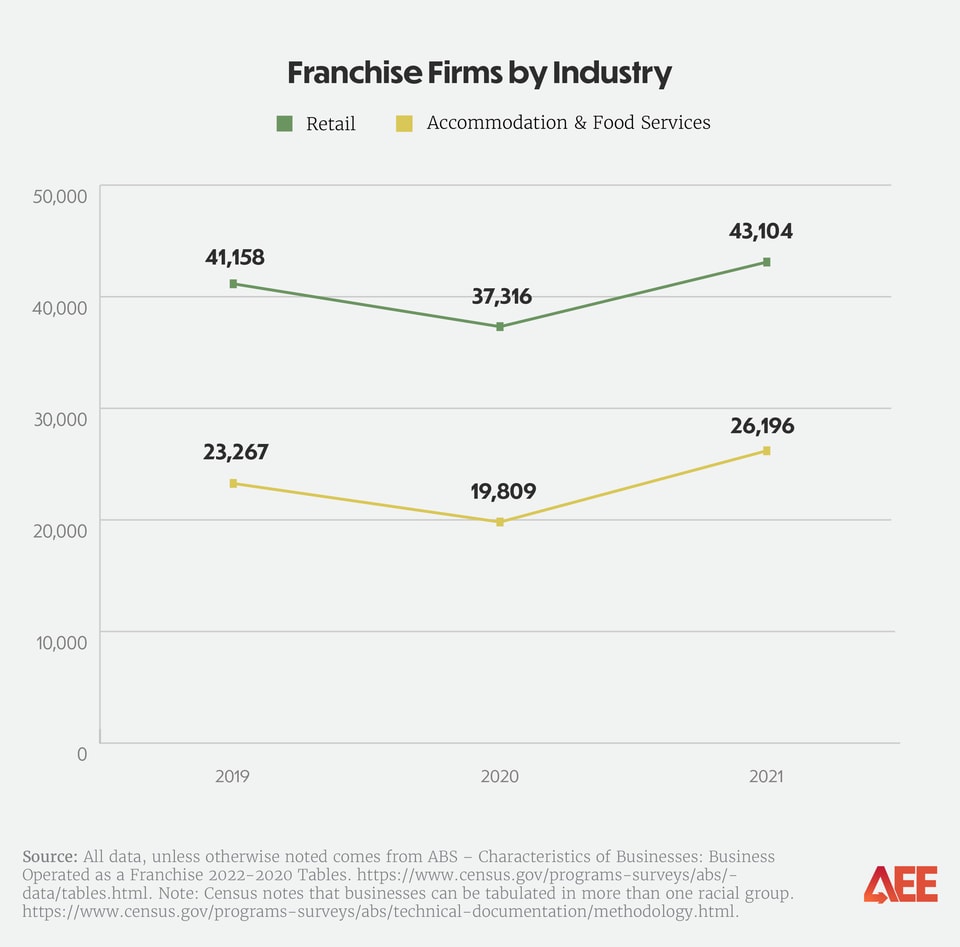
Food and retail businesses were among the industries most heavily impacted by the coronavirus. More than 3,800 food service franchises and over 3,400 retail franchise businesses shuttered in 2020. In the first year following the pandemic, the retail trade industry experienced a significant rebound, with a 32% increase in the number of franchise firms. The accommodation and food service industry exhibited a notable, albeit more modest, increase with 15% more franchises returning in 2021.

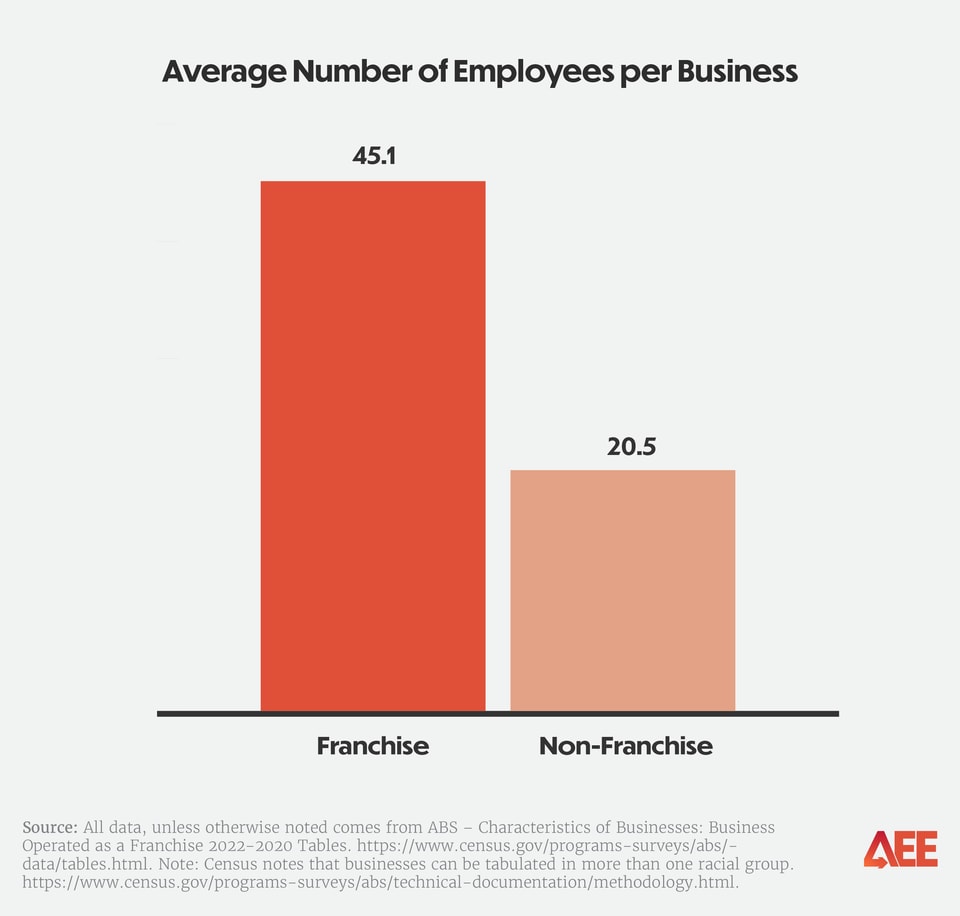
Franchise businesses create 2.2 times as many jobs as non-franchise businesses.
Franchises have an outsized economic impact by creating twice the number of jobs than non-franchise businesses. In 2021, franchises had about 45 employees per business. Non-franchise firms, on the other hand, averaged about 21 employees per business.

Veteran- and Black-owned franchises perform 2+ times better than non-franchise businesses.
Franchise firms produced approximately $11.6 million in sales per business compared to $8.4 million produced by non-franchise firms. However, franchises owned by veterans earn twice as much as veteran-owned non-franchise firms. Specifically, the franchise model allowed veterans to bring in an average of $6.5 million per business compared to $2.8 million by the veteran-owned non-franchise companies in 2021.
Business owners of color also benefit from the support of the franchise model. But Black business owners gain the most when they switch to a franchising model, earning 2.4 times more than other Black-owned businesses. Hispanic franchises earn 1.7 times more and Asian businesses 1.1 times more.
