Report Published December 20, 2023 · 6 minute read
2023 Price-to-Earnings Premium for Low-Income Students
Emily Rounds

Earlier this year, Third Way updated the Price-to-Earnings Premium (PEP) for four-year colleges, which tells us how many years it takes students to recoup their educational investment at a given school. Our report found encouraging data about students’ ability to recoup the cost of tuition at public and private non-profit schools in a reasonable period. While calculating the return on investment (ROI) for all students at an institution tells us about the “typical” student’s ability to pay for college and their post-enrollment earnings, it is especially important to understand the ROI received by students with the highest financial need and lowest ability to pay. This is why we also calculate the PEP metric for low-income students whose annual family income is less than or equal to $30,000.
Low-income students often have different costs of attendance based on their financial aid package and may also have different experiences in the job market than the median college student. Calculating the PEP for an institution’s low-income students sheds light on whether institutions are serving students who have the highest need equitably. The PEP for low-income students offers an accessible metric that provides insight into how quickly a four-year college delivers a return to its students from low-income backgrounds and how strong that return is.
The low-income PEP is calculated using the same formula as the overall PEP but uses adjusted College Scorecard variables for students in the lowest income tercile:
Most Public and Private Non-Profit Colleges Prepare Low-Income Students to Recoup Tuition Within 10 Years
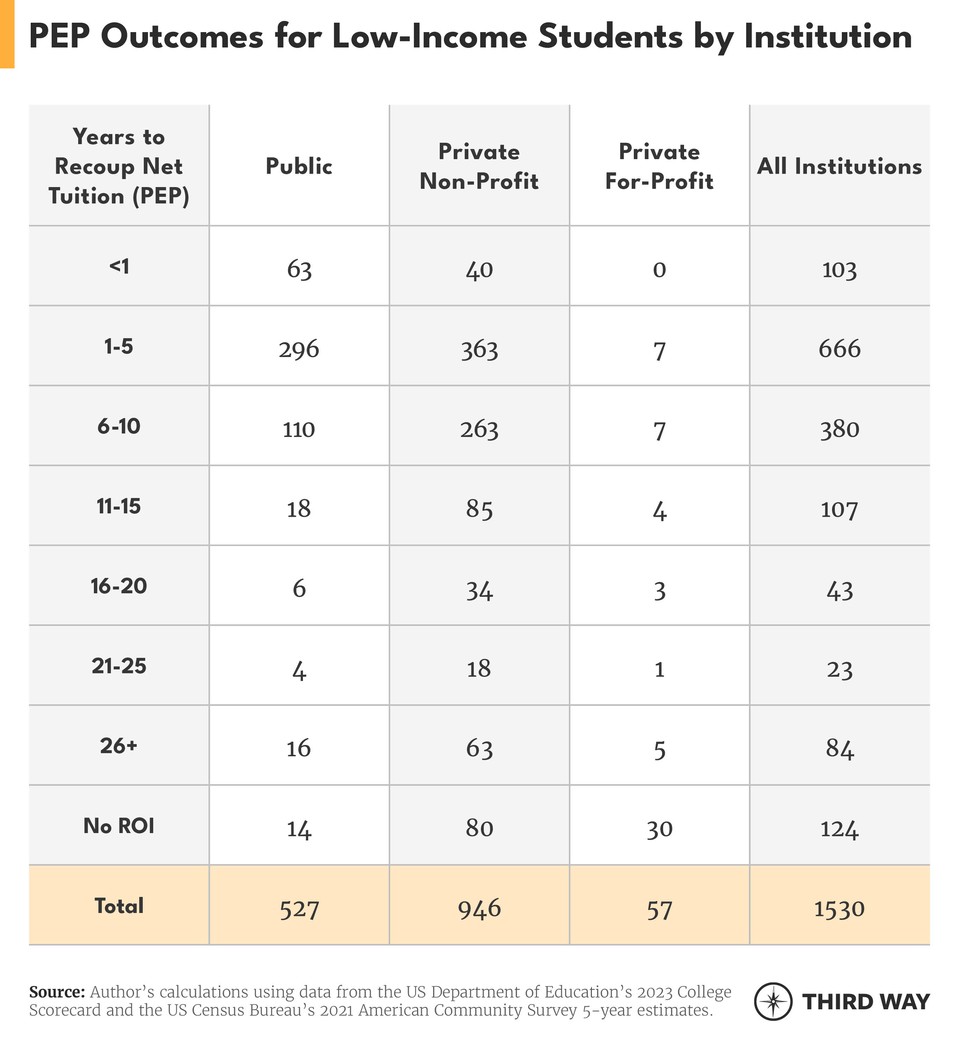
The PEP for low-income students reflects some similar patterns when compared to the overall PEP analysis. Yet, outcomes for low-income students are more polarized than they are for the typical collegegoer. There are notable divides by sector. Most public and private non-profit institutions equip low-income students with strong returns on their educational investment (as many also do for the typical student), while most private for-profits leave low-income students worse off than the typical student, with long periods to recoup their costs, if they see any return at all.
Eighty-nine percent of public institutions equip their low-income students to recoup their investment within 10 years, and 68% equip low-income students to do so within five years. At 70% of private non-profit institutions, low-income students recoup their tuition within 10 years, and at 43% of schools, they do so within five. Many institutions in these sectors are meeting their students’ financial need by offering lower tuition rates, providing strong post-enrollment earnings to allow them to quickly see ROI, or both—in some cases helping their low-income students receive almost an immediate return. At 7% of public and private non-profit colleges, low-income students recoup their net tuition within a year, a fantastic return, while 2% equip the median student to recoup their investment within a year.
On the flip side, for-profit schools deliver worse returns for low-income students than for the median student. Sixty-one percent of for-profit colleges leave their low-income students unable to recoup their costs 26 or more years after enrollment or never receiving a return. In comparison, 45% of for-profits leave the median student with those dismal outcomes. For-profit colleges are a very risky financial bet for low-income students, as most do not deliver returns even two decades after enrolling. These institutions need to make significant progress to help low-income students achieve equitable outcomes with the full student body.

Top Institutions on the PEP for Low-Income Students Enroll Few Pell Grant Recipients
The top-performing institutions on the PEP for low-income students provide them with an excellent ROI, but it is crucial to consider the number of students for which they deliver those strong returns. Generally, high-performing institutions on this metric enroll fewer federal Pell Grant recipients (which we use here as a proxy for low-income student enrollment given that most Pell students come from households earning less than $40,000 annually).1
For example, at the University of Pennsylvania, the top institution on this metric, only 14% of the student population receive Pell Grants. That’s the smallest percentage of Pell recipients among the top 10 schools, but the others don’t enroll significantly more. There is one outlier in the top 10: Hunter College in the City University of New York (CUNY) system, which enrolls 46% Pell Grant recipients. Hunter College’s PEP value for low-income students is 0.03, meaning low-income students recoup their net tuition very shortly after graduation, due to low upfront costs, high post-completion earnings, or both. Hunter College is also a top 10 institution on the overall PEP, indicating that the school equitably serves students across income brackets.
That pattern holds across the top 50 performing schools on the PEP for low-income students. Institutions that perform exceptionally well on this metric have the resources to charge low-income students little or no tuition, they prepare those students to go on to experience strong post-enrollment earnings, or both, but they enroll few low-income students. Only seven schools in the top 50 enroll 50% or more Pell Grant recipients, and all are public institutions, predominantly located in California and New York: the University of California, Los Angeles; California State University, San Bernardino; Baptist Health Sciences University in Memphis, Tennessee; and four CUNY schools—John Jay College of Criminal Justice, Brooklyn College, Lehman College, and City College.
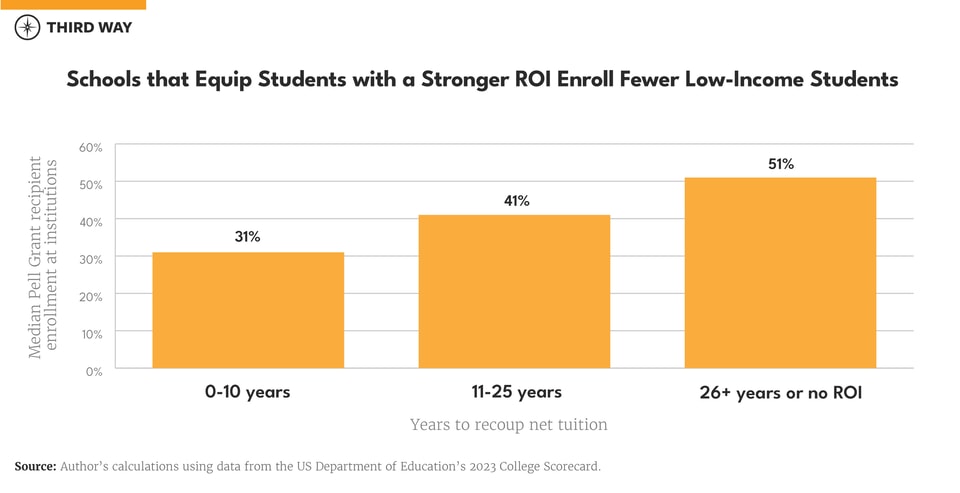
Institutions offering quicker returns with a PEP between 0 and 10 years enroll a median 31% Pell Grant recipients. On the other hand, institutions at which students take longer to recoup net tuition enroll more Pell recipients. Those with a PEP between 11 and 25 years enroll a median 41% Pell students and those with a PEP of 26 or more years or that never provide ROI enroll a median 51% Pell students. These outcomes are problematic, especially as Pell Grant recipients enter college with greater financial need.

Conclusion
Low-income students are not guaranteed the same price-to-earnings premium as the rest of an institution’s student body. While most public and private non-profit schools equip low-income students with strong outcomes, most for-profits saddle them with even worse returns than they do the typical student. Many institutions that deliver a strong ROI also enroll the smallest percentages of Pell Grant recipients, limiting their impact on economic mobility.2 The top earnings premiums from four-year colleges should not be limited to higher-income collegegoers, while too many schools continue to fail their low-income student population. Federal higher education funding should seek to prioritize strong economic outcomes for all students, especially those with the highest financial need.


