Report Published September 27, 2012 · Updated September 27, 2012 · 13 minute read
Death by a Thousand Cuts: Why Spending Cuts Alone Won’t Fix the Deficit
David Kendall, David Brown, & Gabe Horwitz
In this paper we debunk the view that spending cuts alone will solve our long-term budget problem. Fixing the deficit with a cuts-only strategy would threaten our ability to invest in public infrastructure, support innovation, care for the vulnerable, and train a next-generation workforce. While significant spending cuts are a necessary part of a balanced budget solution, they simply can’t carry the full burden without compromising safety, security, and economic growth.
This is the second in a pair of papers that demonstrate that purely ideological fixes will not sufficiently address our fiscal issues. Our other report, Necessary but Not Sufficient: Why Taxing the Wealthy Can’t Fix the Deficit, shattered the myth that taxing the wealthy alone can come close to solving our budget woes. Together, these papers make the case that a big and balanced fiscal package is the preferred way to avoid the fiscal cliff, prevent deficits from exploding in the future, and allow our economy to grow.
Most mainstream economists agree that to stabilize the debt and create a positive economic climate for U.S. growth, annual deficits should typically be no larger than 3% of GDP. But as we have asked before: how do we get there?
In order to demonstrate that cuts alone cannot reasonably solve our impending fiscal crisis, we explore three scenarios, all of which rely solely on spending cuts and use some variation of the pledges that most GOP congressional members, as well as the GOP ticket, have made.*
See Appendix I for a full explanation of spending and revenue baselines.
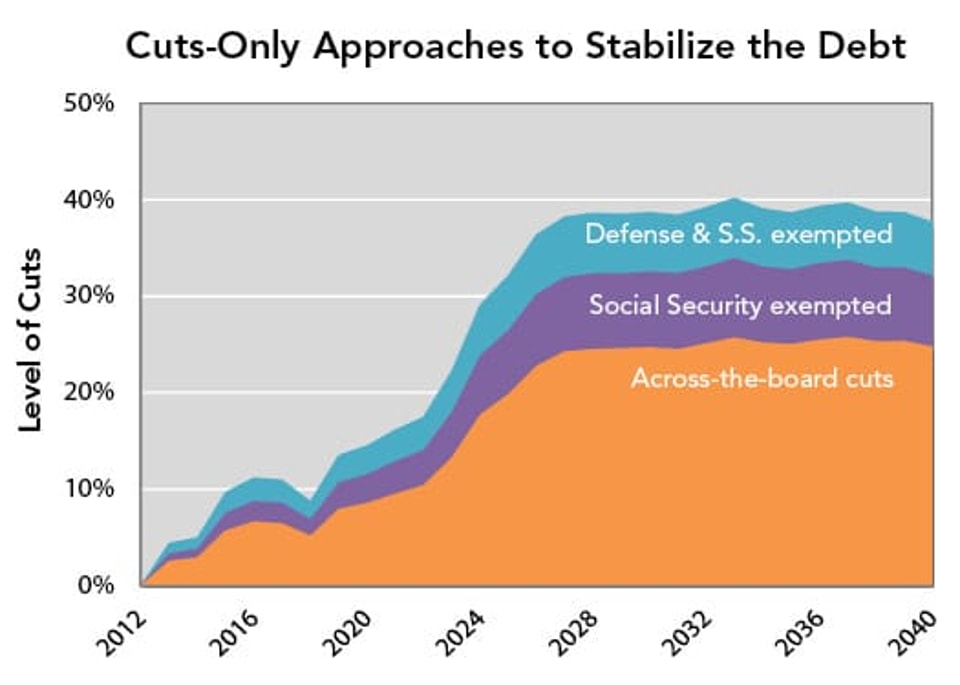
- Scenario I puts all spending on the table and cuts all federal programs evenly across-the-board. To reach deficit targets, annual cuts rise to 20% in 2025 and eventually reach 25%, hitting everything from FBI agents to schools to Social Security to highways.
- Scenario II takes politicians at their word and exempts Social Security from harm in a cuts-only approach (as the House-passed GOP budget does). Sparing Social Security benefit reductions leads to annual cuts in other areas of 26% in 2025 that eventually surpass 30% in subsequent years, leaving gaping holes in key government services.
- Scenario III most closely follows Romney’s position and exempts both national defense and Social Security.1 Annual across-the-board cuts would reach 32% in 2025 and eventually rise to 40%, eliminating two-fifths of non-defense government.
As we have argued previously, we are an aging society whose demographics threaten to burden the working-age middle class with an overwhelming entitlement bill. And the cost of this bill means a cuts-only solution would be catastrophic for basic government services. An all-of-the-above grand bargain on the budget is, in our view, vital to keep entitlements solvent, public investments strong, government services competent, and future middle class taxes reasonable.
Scenario I
Cut all spending across-the-board.
Two pledges define the prevailing position of virtually all Congressional Republicans: contain deficits and forgo new revenue. In this first scenario, we put that position to the test in the most reasonable way. We limit deficits to 3% of GDP (as opposed to a balanced budget that many Republicans support), and we maintain tax rates where they are (2012 levels).
We find that there is a way to control long-term deficits with spending cuts alone. But, in order to do that and reduce deficits to 3% of GDP by 2017, spending cuts must be deep.
In this scenario, we treat all areas of the budget the same—that is, by cutting across the board. With this approach, nothing is spared and pain is equally distributed among the FBI, highway repair, Social Security, food inspection, Arlington Cemetery maintenance, air traffic control—everything the government does.
For the first decade, the annual cuts would average 7%—which may seem modest at first blush, but the total amount of these would actually be $2.9 trillion. By comparison, the highly controversial sequestration cuts, which will take effect at the beginning of 2013 as part of the fiscal cliff, will be $1.2 trillion unless Congress acts.2
After the first decade, cuts would rise quickly to 20% in 2025 and reach 25% in 2029, leaving key national priorities starved.

But what would this mean for government services? Predicting how agencies will respond to budget cuts inevitably involves making assumptions, especially when looking years down the road. Our method, which is spelled out in Appendix II, looks at the difference between projected spending levels under current policies and the levels of cuts needed to achieve sustainable deficits without any new revenues.
Our findings show that a cuts-only budget fix would be devastating for the nation: 13,000 fewer FBI agents and other federal law enforcement officers as well as 3 million fewer patients treated at community health centers. Food inspectors would be laid off, and special education teachers will see withering support. The chart below illustrates what these cuts could mean.
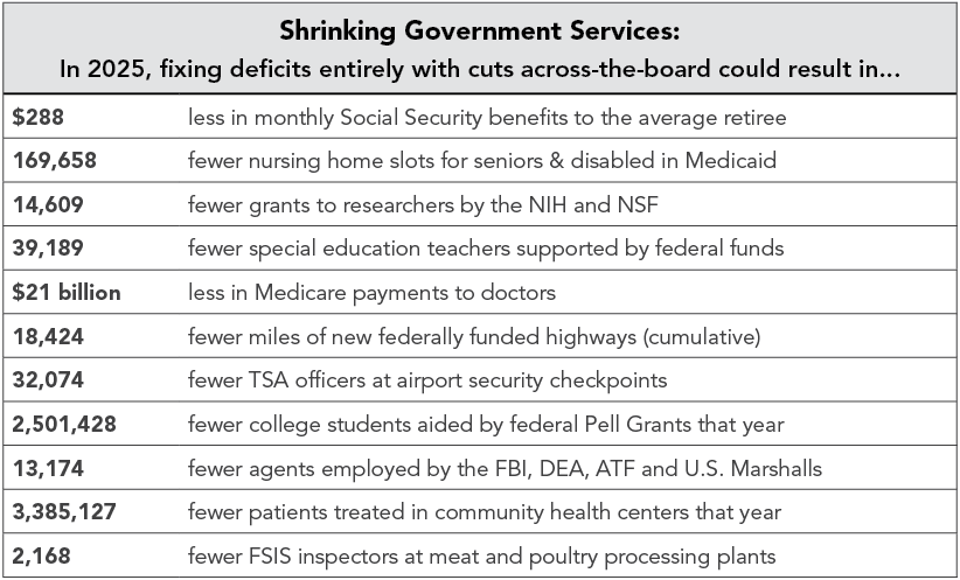
Note: Cuts are relative to government service levels we project in 2025 under current policy.
A Bite Out of Crime Fighting
A cuts-only approach would have one very enthusiastic group of supporters: criminals. While state and local police arrest most criminals, some of the most dangerous lawbreakers fall under federal jurisdiction. Terrorism, drug trafficking, organized crime, and Internet fraud are among the crimes that must be investigated and prosecuted at the federal level. The FBI, Drug Enforcement Agency, the Department of Justice, and other federal law enforcement agencies depend on Congressional funding to fight and prosecute these crimes.
If agency budgets are cut across the board, there would be more criminals on the streets. In 2025, the FBI, DEA, ATF and U.S. Marshalls would arrest 93,534 fewer criminals and land 43,961 fewer convictions, by our estimate.3 By comparison, that would be half of the number of total convictions in 2009.4
Scenario II
Hold Social Security harmless.
This scenario adds another common Republican pledge—contain deficits, forgo new revenue, and ensure Social Security will not be touched. Republicans, the chief advocates of a cuts-only approach, avoid Social Security with the House-passed Ryan budget, for example, exempting the program from any cuts.
Exempting Social Security, however, would only make the cuts to the rest of the budget more severe. Scenario II shows that if Social Security is exempted, cuts across other areas of the budget hit 26% in 2025 and surpass 30% in 2026, leaving gaping holes in key government services.
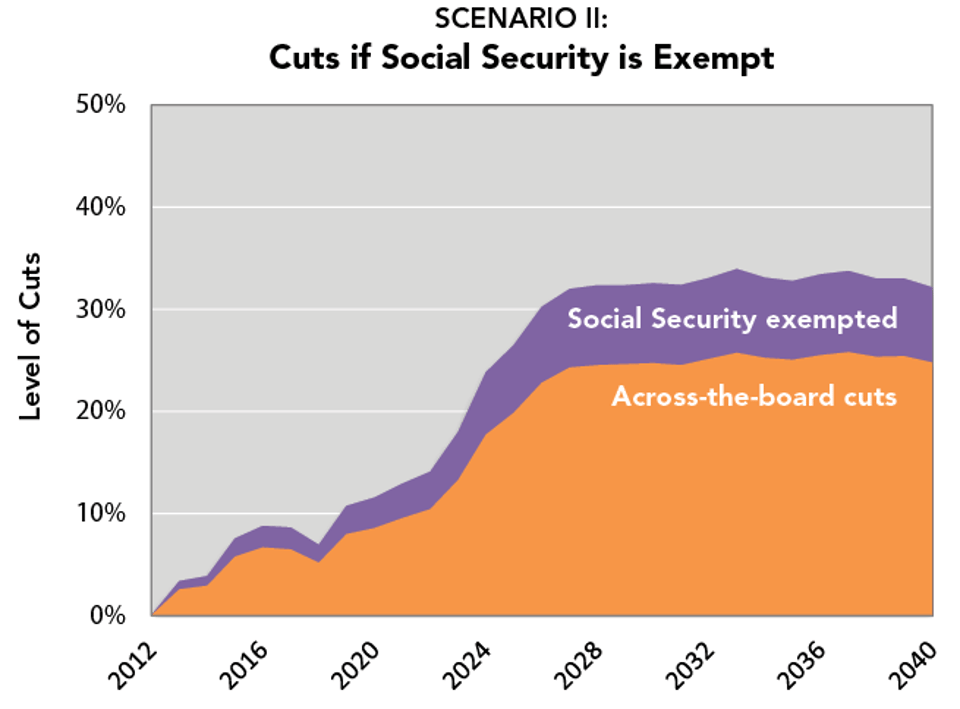
So what would this mean? With a higher level of cuts on a smaller share of the budget, the consequences would be even more severe. Medicaid nursing home coverage would be provided to fewer seniors, TSA officers protecting air passengers would be slashed, and far fewer college students would benefit from Pell Grants. The following chart illustrates what these cuts could mean.
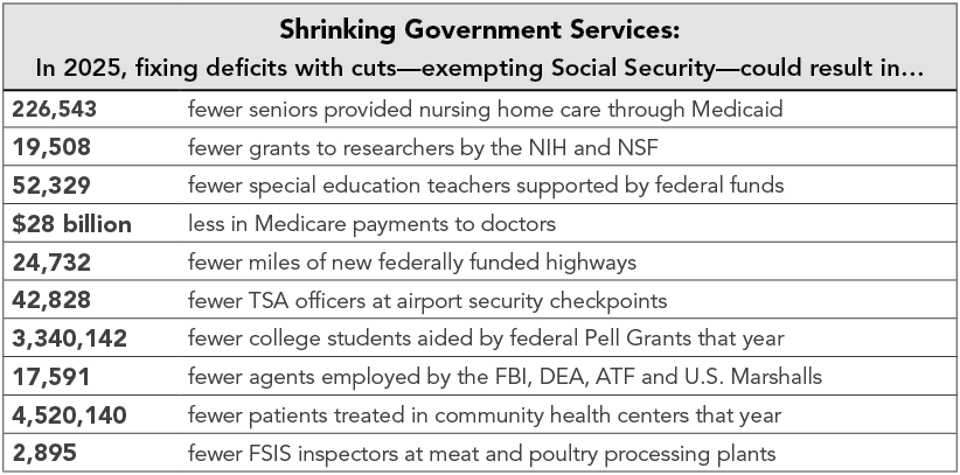
Note: Cuts are relative to government service levels we project in 2025 under current policy.
Is That Burger Safe to Eat?
In 2007, sicknesses in 11 states resulted from E. coli-tainted beef, prompting a recall of 5.7 million pounds of meat.5 In 2010, nearly 2,000 people contracted Salmonella, leading to a recall of 500 million eggs.6
Outbreaks of food-borne illnesses get lots of press, but rarely do we hear about how the government prevents such outbreaks. The Department of Agriculture’s Food Safety and Inspection Service (FSIS) enforces laws every day that regulate meat, poultry and egg production. More than 7,600 FSIS inspectors and veterinarians monitor slaughterhouses and meat processing plants—and train workers in these facilities. More than 100 other FSIS employees monitor meat, poultry and egg import facilities, like loading docks. The FSIS also responds to contamination outbreaks and works to prevent them by monitoring data to pinpoint high risk sources of contamination.7
A recent study shows that the FSIS is already vastly understaffed. Make Our Food Safe, a coalition of public health and consumer groups, found that contaminated food kills 5,000 Americans annually.8 And further cuts would make our food even less safe. In 2025, cuts at the level of Scenario II could mean 2,895 fewer FSIS inspectors. A proportional drop in productivity could mean 169,600 more Americans could contract salmonella, E. coli or other meat and egg-related illnesses.
Scenario III
Hold Social Security and defense harmless.
This scenario adds a final common Republican pledge—contain deficits, forgo new revenue, ensure Social Security will not be touched, and exempt defense. This is similar to a position Governor Romney has supported. In this scenario, defense spending grows at the same rate as the economy.
We find that if defense and Social Security are exempt, cuts across other areas of the budget reach 32% in 2025 and rise to 40% in 2033, crippling the basic functions of government.
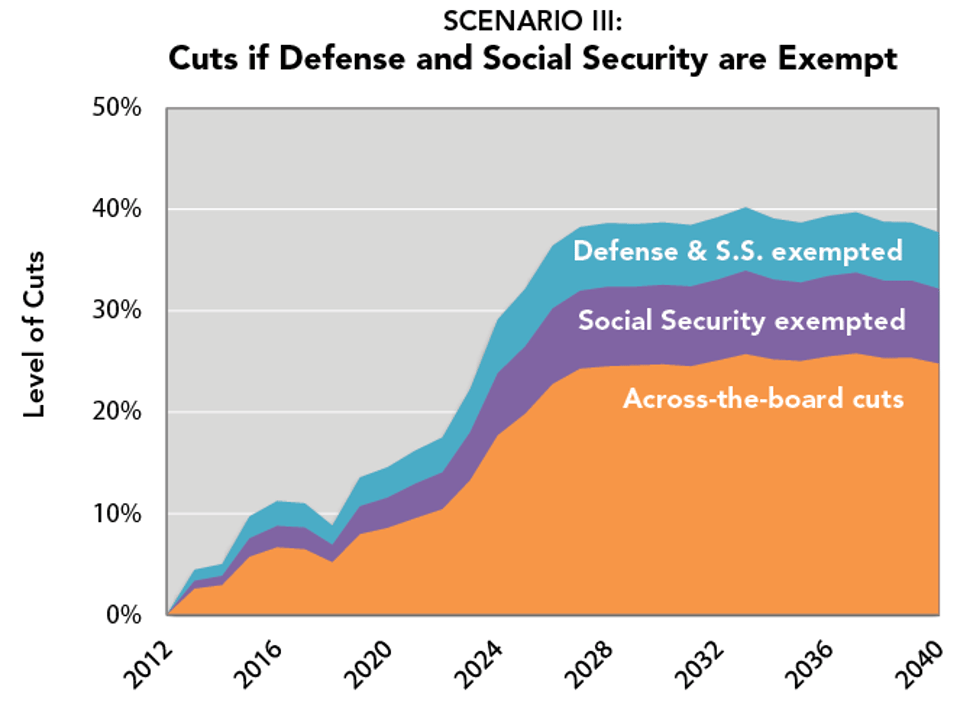
So what would this mean? From investments to law enforcement, Americans’ relationship with government would be fundamentally altered. The following chart illustrates the effects of these cuts.
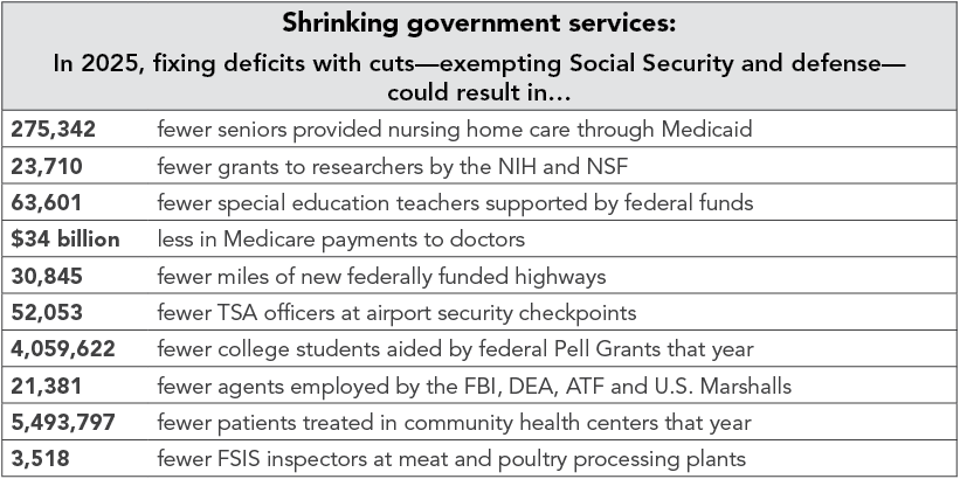
Note: Cuts are relative to government service levels we project in 2025 under current policy.
Eating Our Seed Corn
Since 1963, R&D Magazine has published a list of the year’s top-100 innovations, also known as the “Oscars of Innovation.” The list is full of critical American inventions that created new products, supported new jobs, and improved people’s lives. Prominent examples include Taxol, a drug that slows the spread of cancer cells (1993); Green Destiny, a hyper-efficient supercomputer which pioneered computing efficiency (2003); and RFinity, a cell phone technology that allows secure mobile transactions (2009).
What do these award-winning inventions have to do with federal spending? Everything. Taxol was developed by scientists at the National Cancer Institute, in collaboration with Bristol-Myers Squibb.9 Green Destiny was invented by engineers at the Los Alamos National Laboratory.10 And RFinity was a public-private collaboration that included the Idaho National Laboratory.11 In fact, over the last ten years, an average of 45 of the R&D top-100 inventions has been attributable to federal funding.12
A cuts-only approach that exempts Social Security and defense would imperil the National Science Foundation, the National Institutes of Health and the Department of Energy, all of which support labs that consistently receive R&D 100 awards. If federally supported innovations were to fall proportionally with funding, we could expect 14 fewer top innovations in 2025, compromising critical advances in healthcare, education, and commerce.
Conclusion
Staunch partisans on both sides of the political spectrum agree that our fiscal path is unsustainable. But the long-term budget gap requires more than one-sided, silver-bullet solutions.
Entitlement solvency from meaningful spending reductions, more tax revenue that comes predominantly from the wealthy, reasonable reductions in defense spending, the elimination of government redundancies, and adequate levels of spending are all necessary to ensure that our economy can grow and the middle class can prosper. And to ensure that we remain competitive in the 21st Century, all must be part of a balanced deficit deal.
A cuts-only approach cannot work just as a tax-only approach cannot work. The real question now is whether policymakers will have the will to use this now or never moment to set our nation on a course of fiscal stability and economic growth.
Appendix I
Baselines and economic assumptions
Each scenario depicts a combination of spending cuts that reduces the total budget deficit to 3% by the year 2017 and maintains 3% deficits through 2040.
The baseline for spending is current policy, as defined by the Congressional Budget Office’s (CBO) Alternative Fiscal Scenario (AFS).13 Under each scenario, interest payments on the debt are adjusted according to projected deficits each year. To project each year’s net interest and change in total debt, we use a model that emulates the projections in the CBO’s Extended Baseline Scenario (EBS) and AFS. Thus, our assumptions about future interest rates are the same as the CBO’s.
Our revenue baseline is also current policy. We assume that all expiring income tax and estate tax provisions are extended and that Alternative Minimum Tax relief is extended. We do not, however, assume the extension of any other temporary tax provisions, such as the current payroll tax cut. This baseline uses the CBO’s “Variant 2” assumptions for individual income tax revenue, CBO’s Expiring Tax Provisions assumptions for the estate tax, and the Extended Baseline Scenario assumptions for all other revenue sources.14
GDP growth estimates are those from the CBO’s 2012 Long-Term Budget Outlook.
Appendix II
Forecased cuts to government services
The cuts to government services that we estimate under each scenario are not relative to the quantity of those services provided today; rather, they are cuts relative to the quantity of services that would be provided in the future, if current policies remained in place.
Most of our projections begin with data, published by the House Committee on Appropriations, on the likely impact of sequestration on various federal programs in 2013.15 For example, the committee estimated that under sequestration—a budget cut of 7.8%—the National Institute of Health would provide about 2,500 to 2,700 fewer research grants, and the National Science Foundation would provide about 1,500 fewer research grants. That’s a total of about 4,100 fewer grants between the two agencies.
Next, we assume that a cut of a different size would produce a proportional cut in grants. For example, a cut twice as large (15.6%) would reduce the number of grants twice as much, by 8,200.
To project what the size of these cuts would look like years beyond 2013, we make several assumptions.
- For spending on troop levels, we assume spending growth identical to the CBO AFS projection for defense spending. For non-defense discretionary programs, we assume spending growth identical to the AFS projection for “other spending” (not including Defense). For Social Security, Medicare and Medicaid we assume spending growth identical to the CBO’s March 2012 Baseline, through 2022, and we use our own projection—based on the March 2012 Baseline—for years after 2022.
- Second, we assume that in future years, the impact of a cut, as projected by the Appropriations Committee for 2013, grows to reflect higher real spending levels projected by the CBO. For example, real spending on non-defense discretionary programs in 2025 is expected to be 40.2% higher than today’s level. So in 2025, a 7.8% cut to NIH and NSF would be 40.2% larger, resulting in 5,748 fewer research grants than would be otherwise provided.
- Third, we apply the estimated level of cuts, in future years, as prescribed by our three scenarios. Scenario I, for example, forecasts a 19.8% cut to all government programs in the year 2025. Therefore, we project that NIH and NSF that year will provide 14,609 fewer grants under Scenario I funding than they would under the AFS.
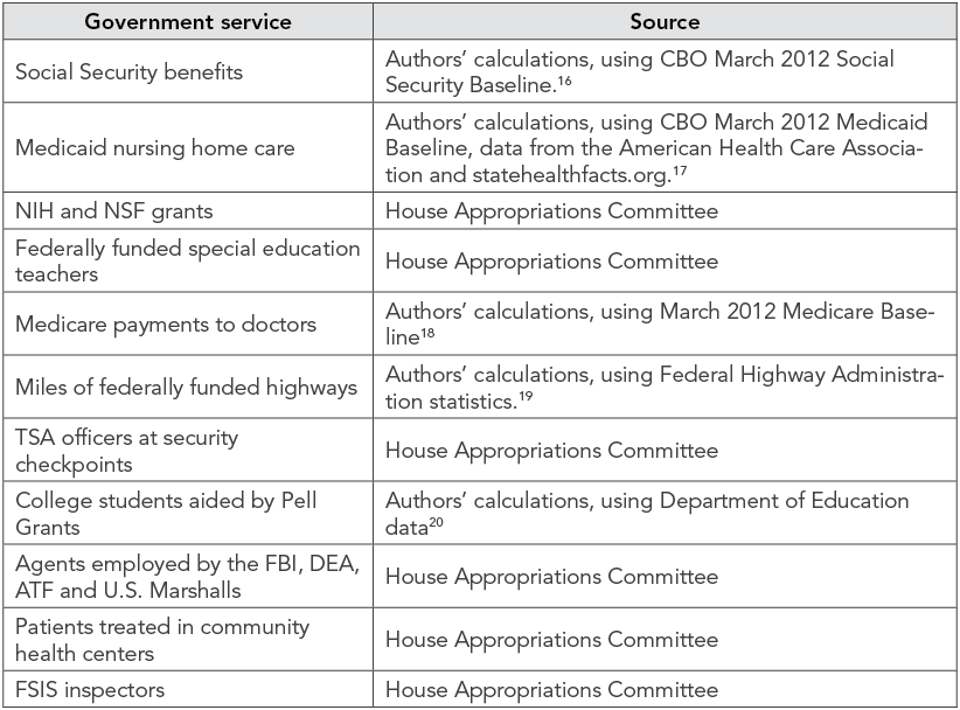
Sources for Government Service Cut Projections 16 17 18 19 20
Please also see Necessary but Not Sufficient: Why Taxing the Wealthy Can’t Fix the Deficit which explodes the myth that our long term deficit can be solved mainly by taxing the rich.


