Report Published July 23, 2013 · Updated July 23, 2013 · 11 minute read
Is Social Security Regressive?
Jim Kessler & David Brown
Marcia is doing well. Beginning with restaurant work to get through college, she’s been employed since 1980. In 1997, at the age of 37, Marcia’s salary reached the FICA maximum of $65,400 and has continued to reach and exceed the limit (now $113,700).
Marcia knows that Social Security will be close to insolvent by the time she reaches the full retirement age of 67 in 2027. To keep it solvent, she is willing to contribute more to the Trust Fund. After all, she can afford to kick in more for the benefit of all. But Marcia is puzzled by an argument made by her sister: that Marcia is getting a better deal on Social Security than her less affluent siblings because the program is regressive—that is, wealthier people get a better deal than poorer people. Marcia thought that while some may say the payroll tax is regressive, if you look at what it pays for in benefits, she was sure that poor and middle class people do better. Who’s right?
Over Easter dinner, Marcia’s sister announced that Social Security benefits the wealthy more than ordinary workers—not only because a portion of their wages goes untouched by Social Security, but also because the wealthy retire later and live longer. Marcia responded that while she earns more and would be willing to pay more, the Social Security benefit formula is tilted toward lower income workers and therefore they do the best.
As luck would have it, the three siblings were perfectly suited for an experiment. Stepbrothers Greg and Peter began working the same year as Marcia. Greg (an assistant in Marcia’s architecture firm where she is a partner) has earned exactly half the amount of Marcia’s taxable Social Security income every single year. And Peter (who works as a butcher) has earned a salary exactly one-fourth of Marcia’s taxable Social Security income every year.
So, who gets the best deal on Social Security: upper middle class Marcia, solidly middle class Greg, or working class Peter? Marcia gave her math savant sister Cindy an assignment to find out.
What is the Social Security Payroll Tax?
Social Security is financed by a payroll tax that is levied on the paychecks of all American workers. The tax is applied to the first $113,700 in wages earned each year. It consists of:
- 5.3% for Old-Age and Survivors Insurance (OASI)
- 0.9% for Disability Insurance (DI)
Employees and employers each pay the 6.2% tax, for a combined Social Security payroll tax rate of 12.4%.
Cindy’s Basic Facts
Cindy started out by gathering the facts: the actual salaries of Marcia, Greg, and Peter from 1980 through 2012, their contributions to Social Security, and their estimated benefits upon retirement according to the Social Security Administration (SSA). Cindy put all of those figures into 2013 inflation-adjusted dollars. (Cindy’s assumptions are detailed in Appendix II.)
Yearly Social Security Benefits for Marcia, Greg, and Peter at Full Retirement in 2027 (All figures in 2013 dollars)
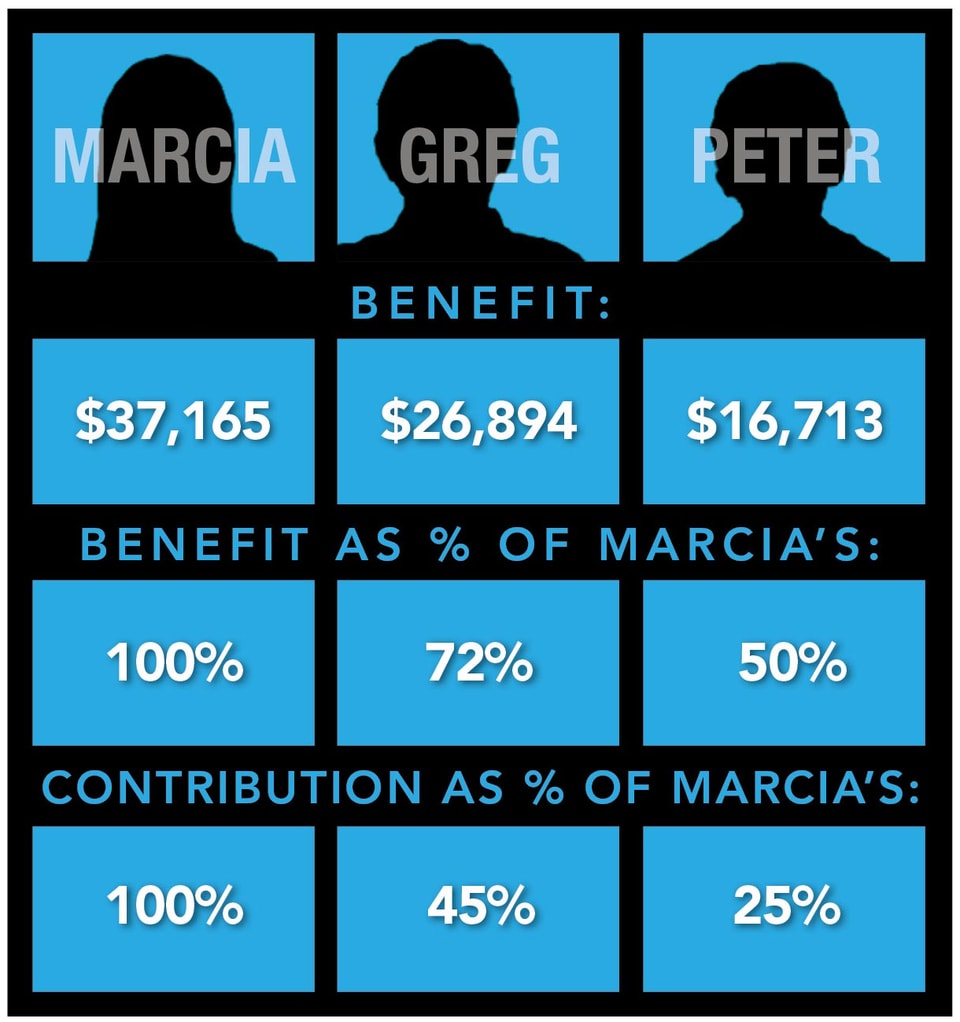
What she found surprised her. Cindy saw that Marcia’s yearly Social Security benefit upon full retirement would be $37,165 in 2013 dollars. Greg, who put in exactly half as much, would get $26,894. And Peter, who put in exactly one-fourth as much, would get $16,713.
Thus, even though Greg contributed exactly 50% as much in Social Security taxes as Marcia, his yearly benefit at age 67 would be 72% of his stepsister’s. And even though Peter contributed exactly 25% as much in Social Security taxes, his yearly benefit would be 45% of Marcia’s.
Cindy’s Four Scenarios
Marcia supports Social Security because it provides a safety net for her in retirement, for her children if she passes away early, and for her family members who have had different careers and salaries. But Cindy wanted to put these Social Security values aside and ask: to what extent is the program a good deal for each sibling, from a pure investment standpoint? To be thorough, Cindy took the basic facts above and ran four scenarios, each looking at the question a little differently.
How Did Cindy Calculate the Rate of Return?
Cindy added up all of the contributions that each sibling made to Social Security from 1980 through 2012 and estimated what each would contribute annually until they retire in 2027, as well as the benefits they expect to earn until their death, which Social Security’s actuaries expect will occur at age 85¼ (assuming they all make it to 65).1 Cindy then calculated the expected real rate of return of each of the siblings’ participation in Social Security—that is, what interest rate would each of the siblings have had to earn on their FICA contributions to get their expected lifetime benefit?
Scenario #1: Employer contribution not included
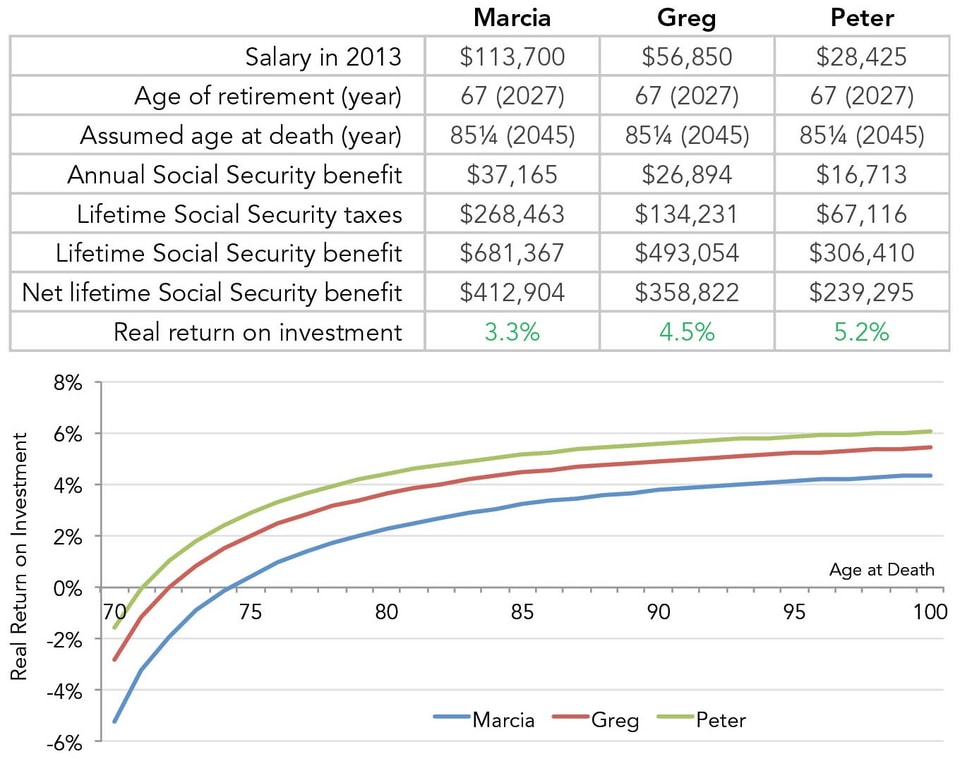
For the first scenario, Cindy decided to only count the contributions employees make to Social Security, and not those that employers make. Cindy calculated that Marcia, during her working years from 1980 to 2027, will contribute $268,463 to Social Security (in 2013 dollars). Greg will contribute exactly half at $134,231 and Peter one-fourth at $67,116. As Cindy put it to the gang, “This is the money that comes out of your paycheck every two weeks, adjusted for inflation.” During their retirement, Marcia will collect a total of $681,367, Greg $493,054, and Peter $306,410. This assumes they all retire at the age of 67 and live to 85¼.
Net Benefit of Social Security Scenario 1: Employer contribution not included (All figures in 2013 dollars)
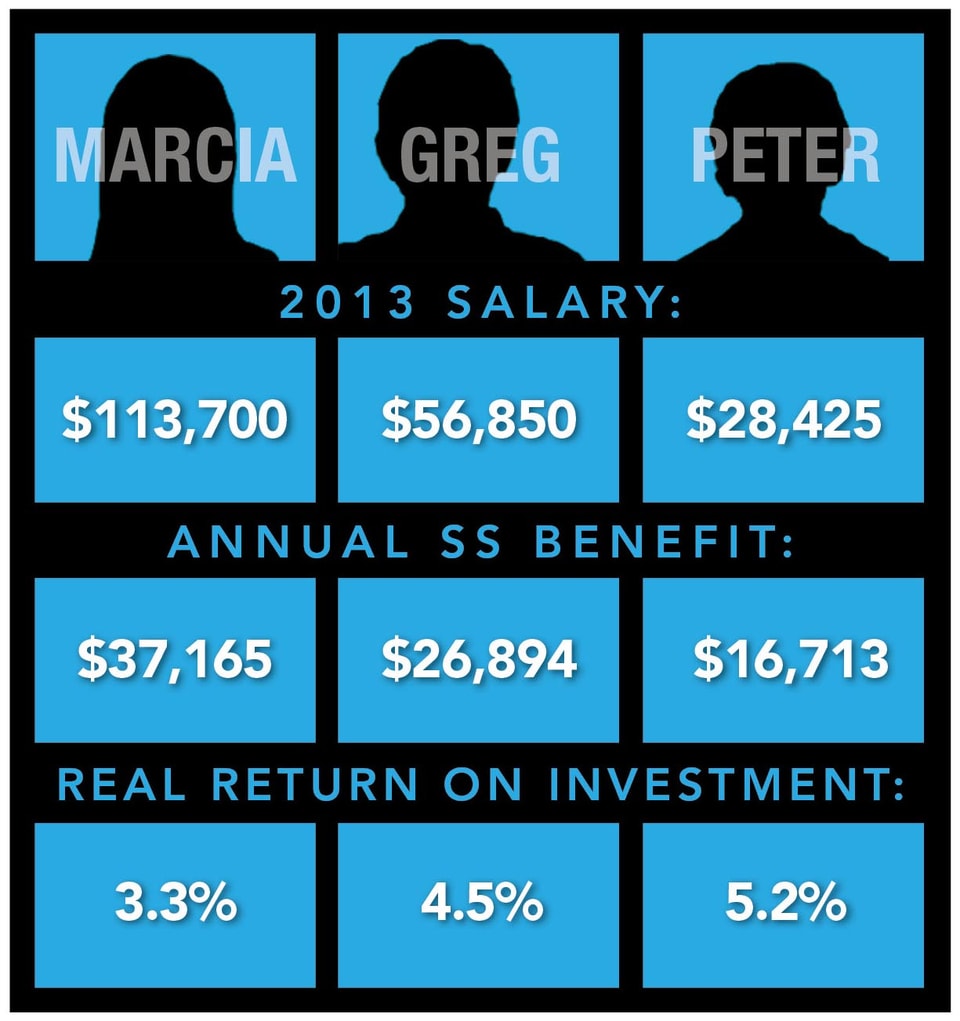
For Marcia, her Social Security taxes and retirement benefits—excluding any disability, spousal or survivor benefit she might also collect—are the equivalent of making a market investment that earns the yearly rate of inflation plus 3.3%. Greg receives a better return at inflation plus 4.5%, and Peter’s is even better at inflation plus 5.2%. Viewed this way, Cindy concludes, Social Security’s retirement program is best for working class Peter, next best for middle class Greg, and third best (but still good) for higher income Marcia.
Scenario #2: Employer Contribution Included
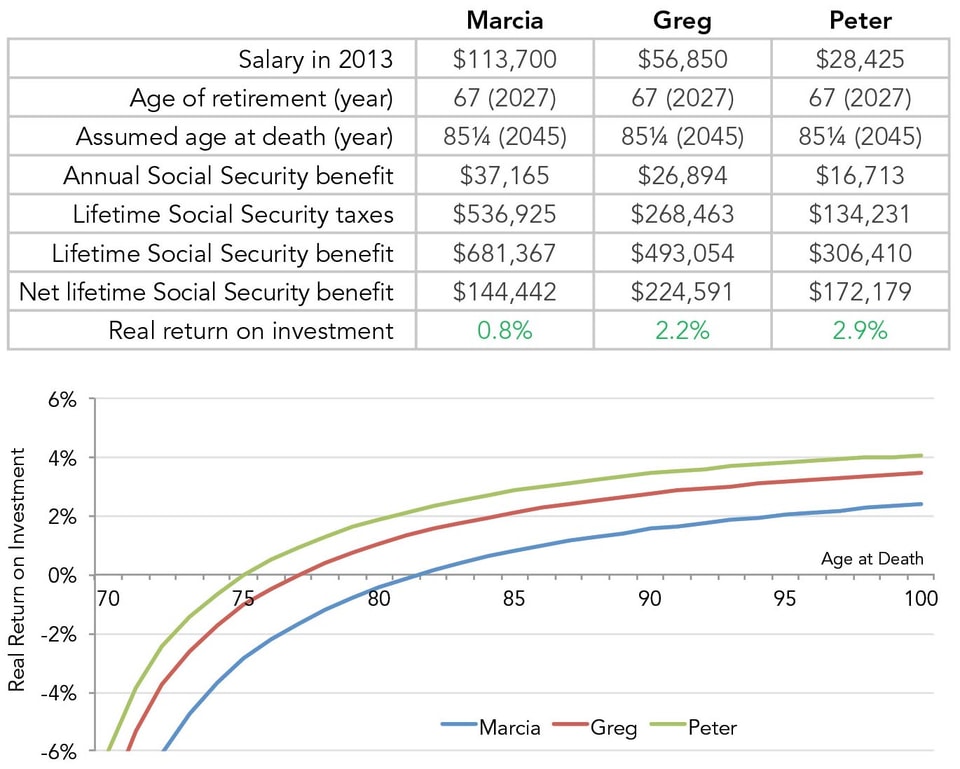
Cindy wanted to do another calculation—this time by including the taxes that employers pay into the system on behalf of each employee. While Marcia, Greg, and Peter technically don’t pay this portion of the payroll tax, many economists believe the burden of this tax falls on employees.
Net Benefit of Social Security Scenario 2: Employer contribution included (All figures in 2013 dollars)
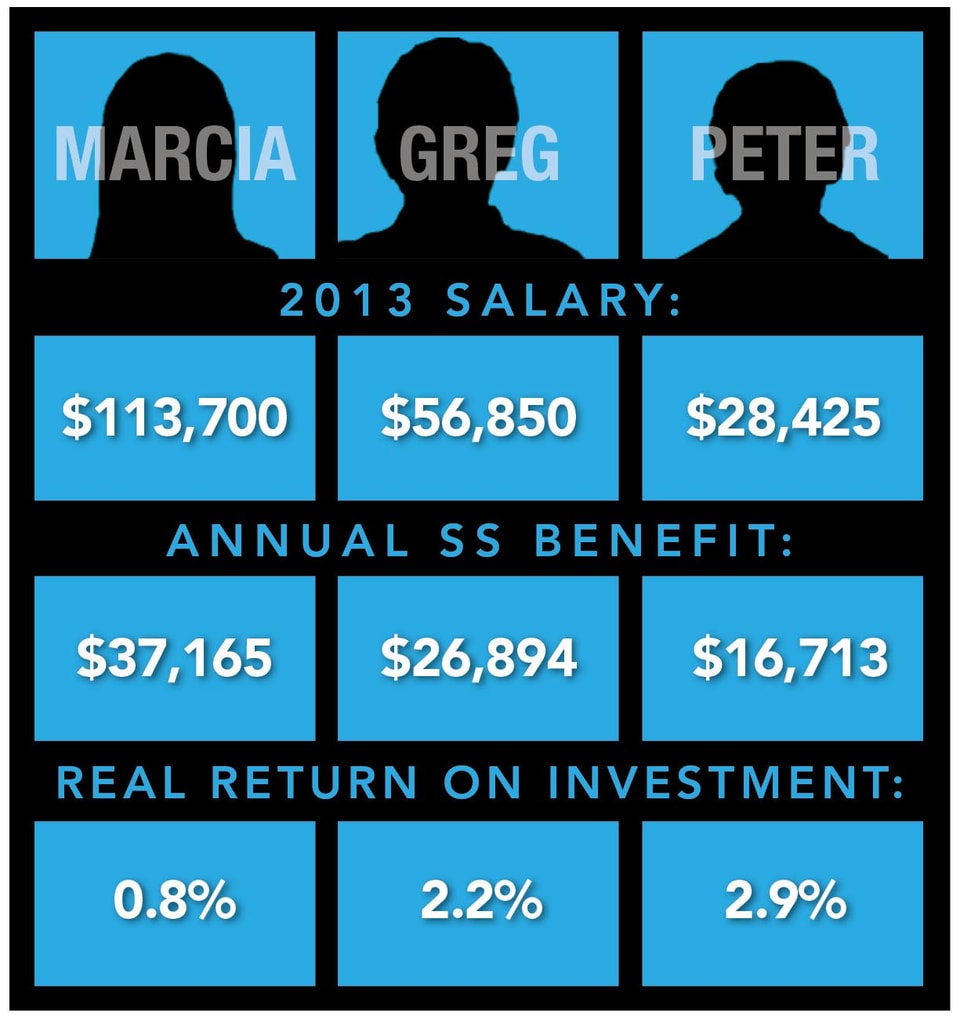
If the employer contribution is in fact born by workers, Social Security becomes less of a good deal for all three siblings. But it still remains true that the lower-income workers get the better deal. Under these assumptions, Marcia gets an annual return of inflation plus 0.8%, Greg gets inflation plus 2.2% and Peter inflation plus 2.9%.
Scenario #3: Employer contribution included; different retirement ages
Cindy still wasn’t satisfied. She’s known Peter forever, and she is certain that as soon as he is able to collect Social Security benefits, he will retire because the work is too physically demanding. Should Peter retire as expected at 62, he will receive a smaller Social Security benefit as a result. “Marcia will work until they put her in a box,” sister Jan once said, so Cindy decided to have Marcia put off collecting Social Security until she’s 70. Greg will likely work until 67, she thought.
Net Benefit of Social Security Scenario 3: Employer contribution included; different retirement ages
(All figures in 2013 dollars)
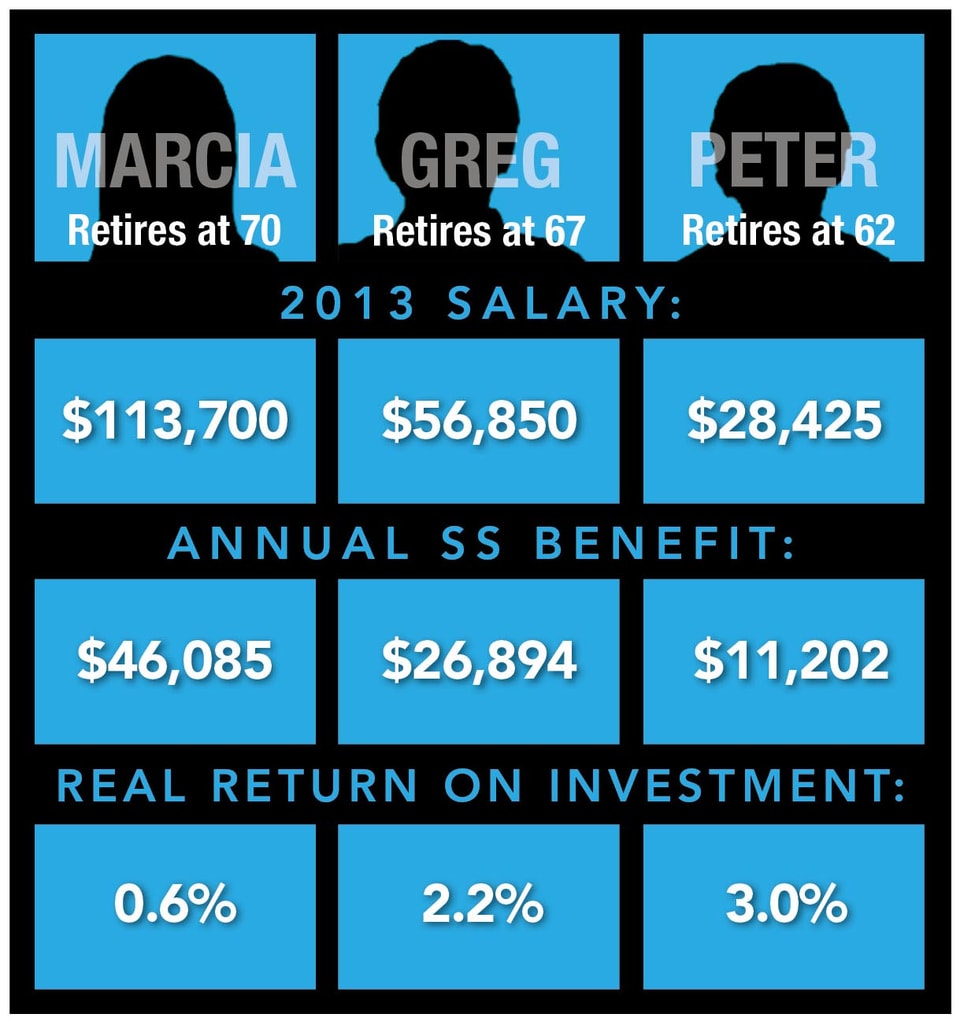
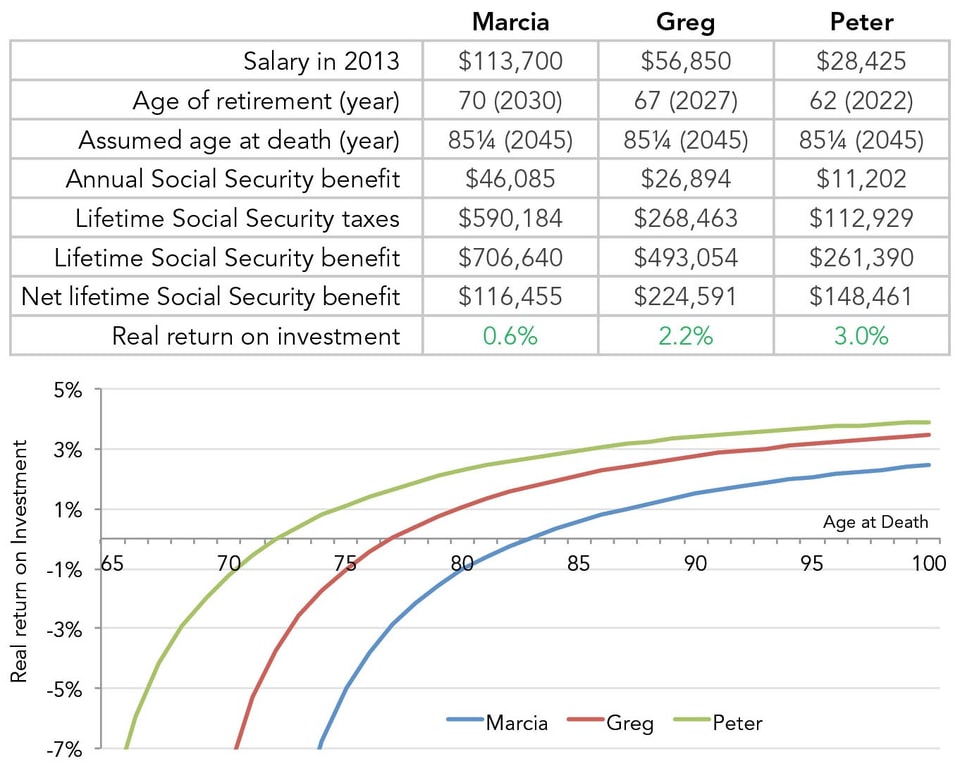
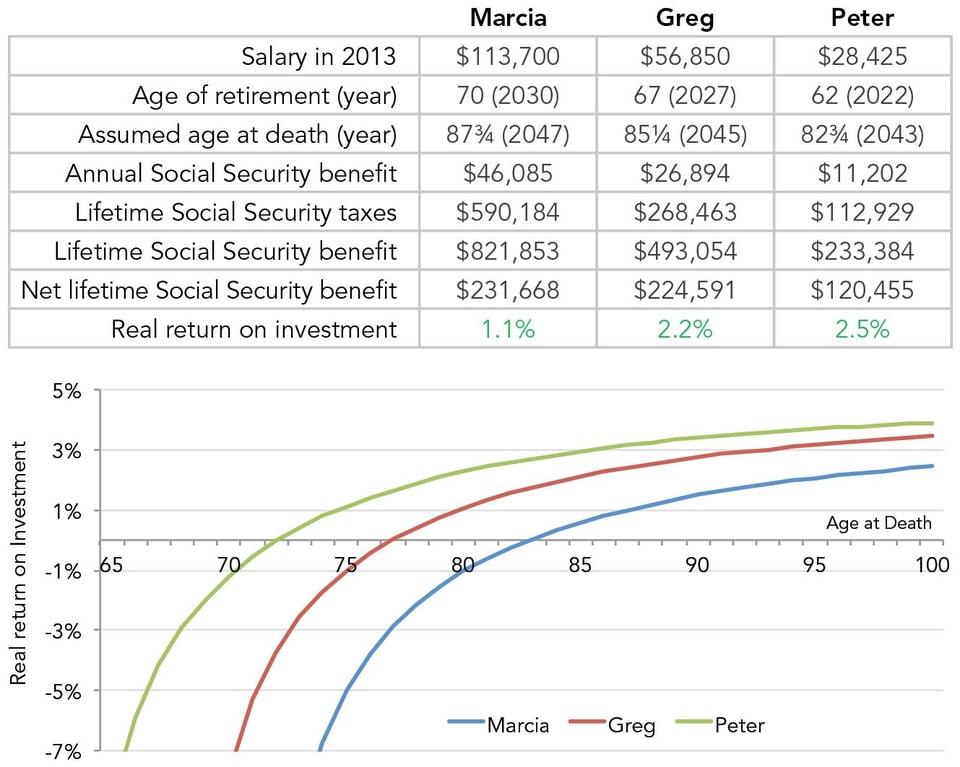
Cindy re-ran the calculations under the assumption that the three siblings will retire at different ages. She looked to see how the results would change if Peter retires at 62, Marcia retires at 70, and Greg still retires at the normal retirement age of 67.
Cindy determined that Peter’s retirement benefit at age 62 would be $11,202 per year in 2013 dollars—that’s $5,511 less than his full retirement benefit at age 67. Marcia’s retirement benefit at age 70 would be $46,085—$8,920 more than the benefit she’d receive at age 67. Greg’s benefit remains the same at $26,894 at age 67.
It turns out that by collecting benefits at 62, Peter earns a slightly better return (3.0%) than claiming at 67 (2.9%). And Marcia, by delaying retirement until 70, earns a slightly worse return (0.6% instead of 0.8%). Assuming retirement at different ages, Cindy concludes, does not change her original conclusion—lower income workers do better.
Scenario #4: Employer contribution included; different retirement ages; different life expectancies
In her final scenario, Cindy tackled the issue of mortality. “Poorer people die earlier. I read that,” said youngest brother Bobby. Cindy looked at several recent studies to make an estimation of life expectancy for her siblings. The SSA suggests a 5.3 year difference in life expectancy between the top and bottom income halves.2 The Congressional Budget Office suggests the life expectancy gap between the wealthy and poor is 4.5 years.3 Cindy decided to roughly split the difference and assume Marcia will live five years longer than Peter, with Greg’s death falling right in the middle. So, Cindy’s new life expectancies for her three siblings are 87¾ for Marcia, 85¼ for Greg, and 82¾ for Peter.*
* Of course, Marcia is also likely to live longer because she’s a woman, but no one is suggesting men and women receive different treatment under Social Security, so Cindy put that consideration aside.
Net Benefit of Social Security Scenario 4: Employer contribution included; different retirement ages;
different life expectancies (All figures in 2013 dollars)
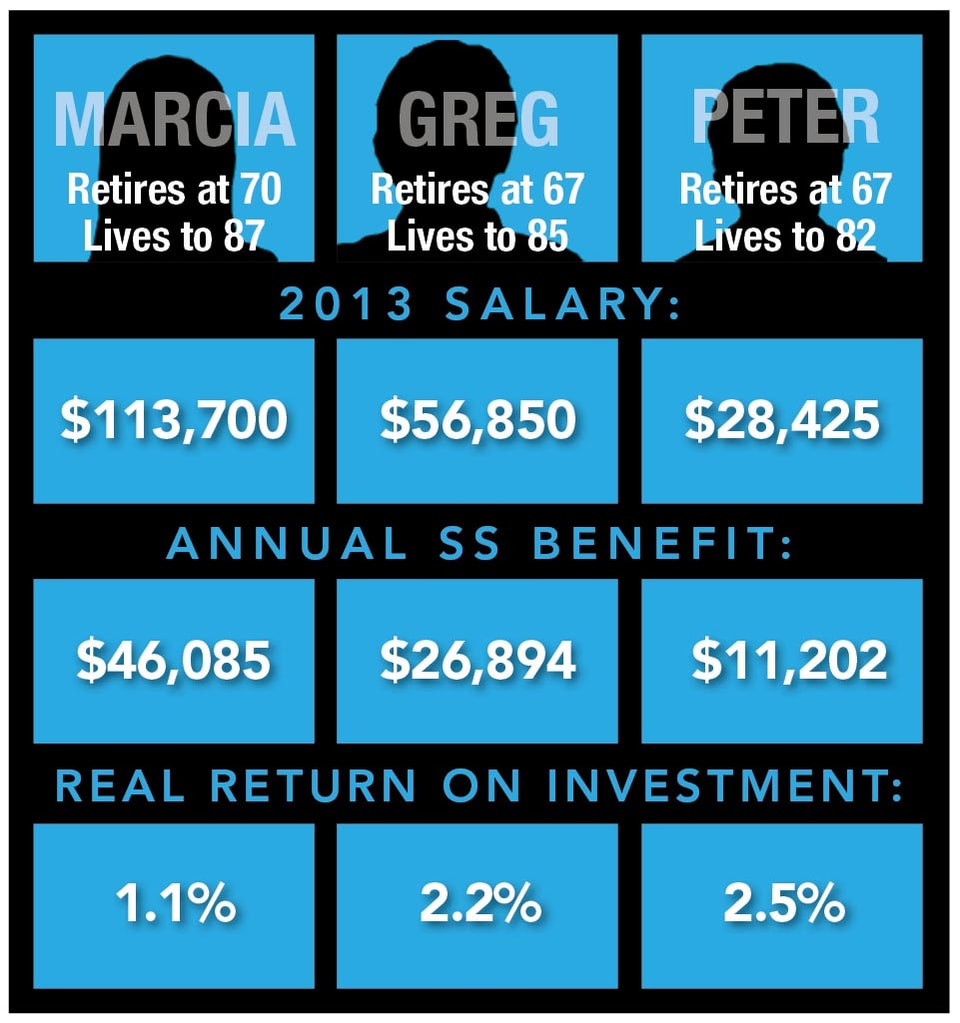
Again, Cindy found the basic results to be the same. By living longer, Marcia’s return improves to inflation plus 1.1%. By dying sooner, Peter’s return falls to inflation plus 2.5%. Greg’s stays the same at inflation plus 2.2%. But the basic finding remains: the less a worker earns over the course of his lifetime, the better a return he can expect from Social Security.
Conclusion
At Mother’s Day dinner, Cindy presented her findings to the entire family. Social Security only favors high-income workers, she stated, if one only counts the contributions individuals make to the Trust Fund and completely ignores the benefits. “That’s just dumb,” said Bobby. “How can you not count the benefits?”
Cindy agreed and rattled off the reasons for the progressivity of the program—from how the initial benefit amount is calculated, to the rate of return each can expect, to the fact that wealthier people have to pay taxes on some of their benefits (something she didn’t even consider in her calculations). Jan interrupted to also point out other benefits: married couples get special benefits because when one passes, the other continues collecting benefits. And lower life expectancies for lower income workers, like Peter, may be offset by benefits going to spouses. Mike and Carol agreed. Carol noted that she barely contributed to Social Security at all, but is guaranteed a good benefit for life.
Marcia concluded that with Social Security someday running short of funds, she’d be willing to pay taxes on some of her earnings currently above the FICA cap. She’s also willing for people like Peter to get larger benefits to have greater security in retirement, so long as care is taken to keep the Trust Fund solvent. But Marcia wished people would stop claiming that she’s getting a sweeter deal than others. It just isn’t accurate. Alice wished out loud that Sam the Butcher had popped the question and also wished that the Bradys had contributed to Social Security during her five decades as a housekeeper. Everyone laughed as Alice brought out her world-famous apple pie.
Appendix I: Graphs of Results
Scenario 1: Employee only, same retirement ages
Scenario 2: Employee plus employer, same retirement ages
Scenario 3: Employee plus employer, different retirement ages
Scenario 4: Employee plus employer, different retirement ages, different life expectancies
Appendix II: Methodology
The lifetime earnings of Marcia, Greg and Peter are based on the taxable lifetime wages of a real Social Security participant. This real-life participant (whose name is withheld), was born in 1960, began working in 1980, and will reach the normal retirement age in 2027. Marcia is assumed to have the exact same lifetime earnings as the real participant. For each year of their careers, Greg’s earnings are precisely one-half of the real participant’s, and Peter’s are precisely one-fourth. For years after 2012, Marcia’s salary is assumed to be equal to, or greater than, the projected FICA taxable maximum. Future FICA maximum levels are assumed to be the same as the intermediate projection presented in the SSA’s Detailed Calculator.4 Greg’s earnings are assumed to remain one-half, and Peter’s one-fourth of Marcia’s taxable earnings for Social Security. The table to the right shows each sibling’s assumed lifetime earnings, in inflation-adjusted 2013 dollars.
Lifetime contributions for each sibling assume the full OASDI tax rate in existence for all previous years and the rate mandated under current law for future years. The primary benefit amount for each sibling—under normal, early and late retirement scenarios—was calculated using the SSA’s Detailed Calculator. Benefits are assumed to continue at their scheduled, not payable levels. Rate of return calculations represent the real (above inflation) interest rate received for an investment (payroll tax contributions) yielding income (Social Security benefits). In other words, the rate of return is the interest rate corresponding to a zero net present value.
All figures converted to real 2013 dollars. Future inflation assumptions are those of the SSA.5 Benefit projections are based on scheduled, not payable, benefit levels.
Year | Marcia’s Earnings | Greg’s Earnings | Peter’s Earnings |
1980 | 7,871 | 3,935 | 1,968 |
1981 | 9,300 | 4,650 | 2,325 |
1982 | 8,428 | 4,214 | 2,107 |
1983 | 10,179 | 5,090 | 2,545 |
1984 | 17,013 | 8,506 | 4,253 |
1985 | 21,419 | 10,709 | 5,355 |
1986 | 35,404 | 17,702 | 8,851 |
1987 | 20,295 | 10,148 | 5,074 |
1988 | 42,454 | 21,227 | 10,613 |
1989 | 70,782 | 35,391 | 17,696 |
1990 | 70,324 | 35,162 | 17,581 |
1991 | 72,774 | 36,387 | 18,194 |
1992 | 86,757 | 43,378 | 21,689 |
1993 | 88,420 | 44,210 | 22,105 |
1994 | 88,554 | 44,277 | 22,139 |
1995 | 88,738 | 44,369 | 22,185 |
1996 | 91,575 | 45,788 | 22,894 |
1997 | 94,830 | 47,415 | 23,708 |
1998 | 97,812 | 48,906 | 24,453 |
1999 | 101,640 | 50,820 | 25,410 |
2000 | 102,870 | 51,435 | 25,718 |
2001 | 105,324 | 52,662 | 26,331 |
2002 | 109,521 | 54,761 | 27,380 |
2003 | 110,490 | 55,245 | 27,623 |
2004 | 108,117 | 54,059 | 27,029 |
2005 | 107,100 | 53,550 | 26,775 |
2006 | 108,330 | 54,165 | 27,083 |
2007 | 109,200 | 54,600 | 27,300 |
2008 | 110,160 | 55,080 | 27,540 |
2009 | 116,412 | 58,206 | 29,103 |
2010 | 114,276 | 57,138 | 28,569 |
2011 | 110,004 | 55,002 | 27,501 |
2012 | 111,201 | 55,601 | 27,800 |
2013 | 113,700 | 56,850 | 28,425 |
2014 | 115,588 | 57,794 | 28,897 |
2015 | 117,935 | 58,968 | 29,484 |
2016 | 120,757 | 60,379 | 30,189 |
2017 | 123,438 | 61,719 | 30,859 |
2018 | 125,949 | 62,975 | 31,487 |
2019 | 128,788 | 64,394 | 32,197 |
2020 | 131,379 | 65,690 | 32,845 |
2021 | 132,992 | 66,496 | 33,248 |
2022 | 134,660 | 67,330 | 33,665 |
2023 | 136,138 | 68,069 | 34,035 |
2024 | 137,436 | 68,718 | 34,359 |
2025 | 138,784 | 69,392 | 34,696 |
2026 | 140,171 | 70,086 | 35,043 |
All Figures are 2013 $

