Report Published October 29, 2018 · Updated January 25, 2019 · 28 minute read
Lessons Learned: A Case Study of Performance Funding in Higher Education

Over the past decade, policymakers at different levels of government have experimented with ways to incentivize institutions of higher education to improve student outcomes. Yet as middling graduation rates and post-graduation outcomes still persist across our higher education system, what can we learn from what these laboratories of democracy have already tried? And as Congress considers another major overhaul of the Higher Education Act, what are the implications of those lessons for federal policy? The purpose of this report is to survey the national landscape of performance funding policies in higher education. This report explains the theory behind performance funding and examines the most recent empirical research on whether these policies have led to improved student outcomes. Finally, it proposes recommendations for designing effective performance funding policies, with a focus on implications for access and equity. Ultimately, this research on existing performance funding systems can provide important lessons for moving toward a federal system that holds institutions or academic programs more accountable for the outcomes they are providing to their students.
Background on Performance Funding for Higher Education
What is Performance Funding?
Performance funding, also known as performance-based funding and outcomes-based funding, is a policy that has been implemented in various states across the country. The policy uses a formula to allocate state funding to public colleges and universities based on student outcomes.1 Historically, public institutions were funded by state tax dollars primarily based on the number of students enrolled. Performance funding shifts a portion of these dollars from an enrollment-based model to an outcomes-based model. Commonly used outcomes include student retention rates, transfer rates from two- to four-year institutions, credit hours earned, graduation rates, degrees conferred, and job placement rates. Institutions earn funds by graduating, not simply enrolling, students. A primary goal of performance funding is to better align states’ goals with institutions to increase postsecondary educational attainment.
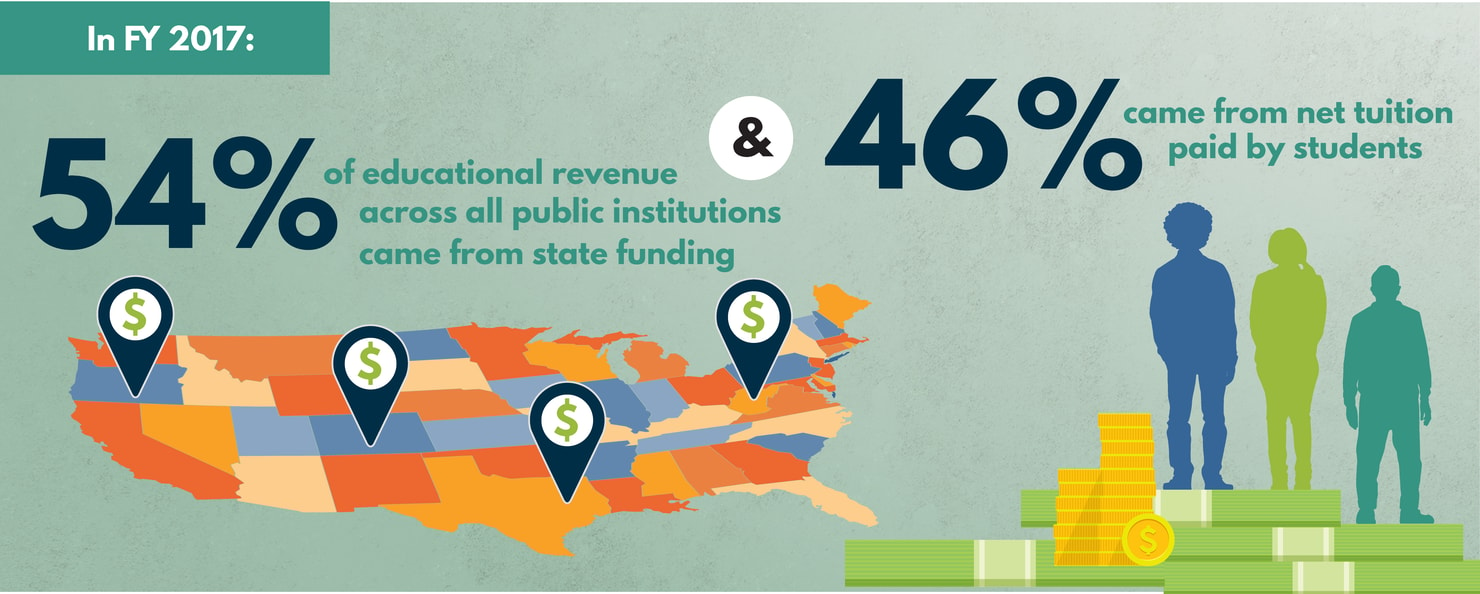
In its current iteration, performance funding only affects state funding for higher education in the form of direct appropriations to institutions. In FY 2017, 54% of educational revenue across all public institutions came from state funding and 46% came from net tuition paid by students (gross tuition and fees minus institutional and state financial aid, tuition waivers, and discounts).23
In FY 2016, public institutions received an average of 26% of their total revenue from state sources, 8% from local sources, and 23% from tuition.4 While states directly appropriate funding for public institutions, federal programs primarily target students. Federal financial aid programs, including Pell Grants and subsidized and unsubsidized loans, provide aid directly to students and are a completely separate mechanism, unaffected by the performance funding policies currently on the books.
How Prevalent are Performance Funding Policies?
We found 29 states in 2018 that operated performance funding policies, with 4 more states in the process of developing a policy. Another source from July 2015 counted as many as 35 states that have performance funding and an additional 5 states that are developing a policy.5 The exact numbers are unclear. While experts disagree on a precise definition of performance funding, there is no publicly-available database that tracks performance funding legislation in real time, and new proposals get introduced in states during each legislative session. Recent academic literature estimates that 46 states are considering, transitioning to, or operating performance funding, with the number of active state policies hovering around 35.67
In 2016-17, the federal government provided over $122 billion in taxpayer revenue to institutions in the form of financial aid, and states and localities provided over $97 billion in higher education support.
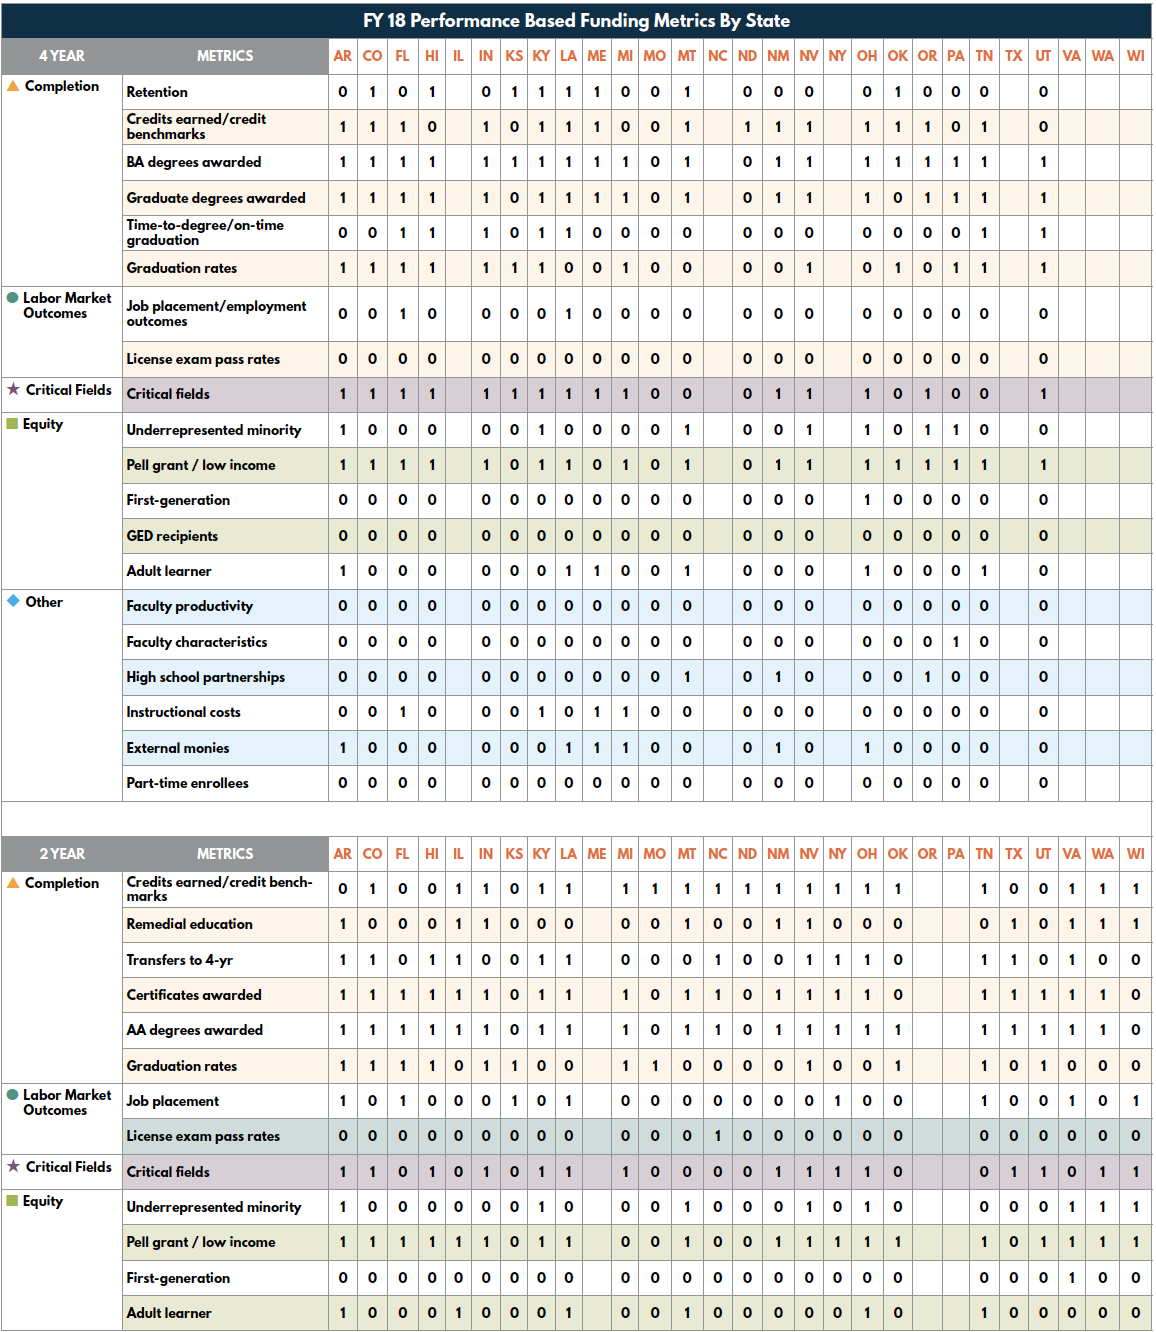
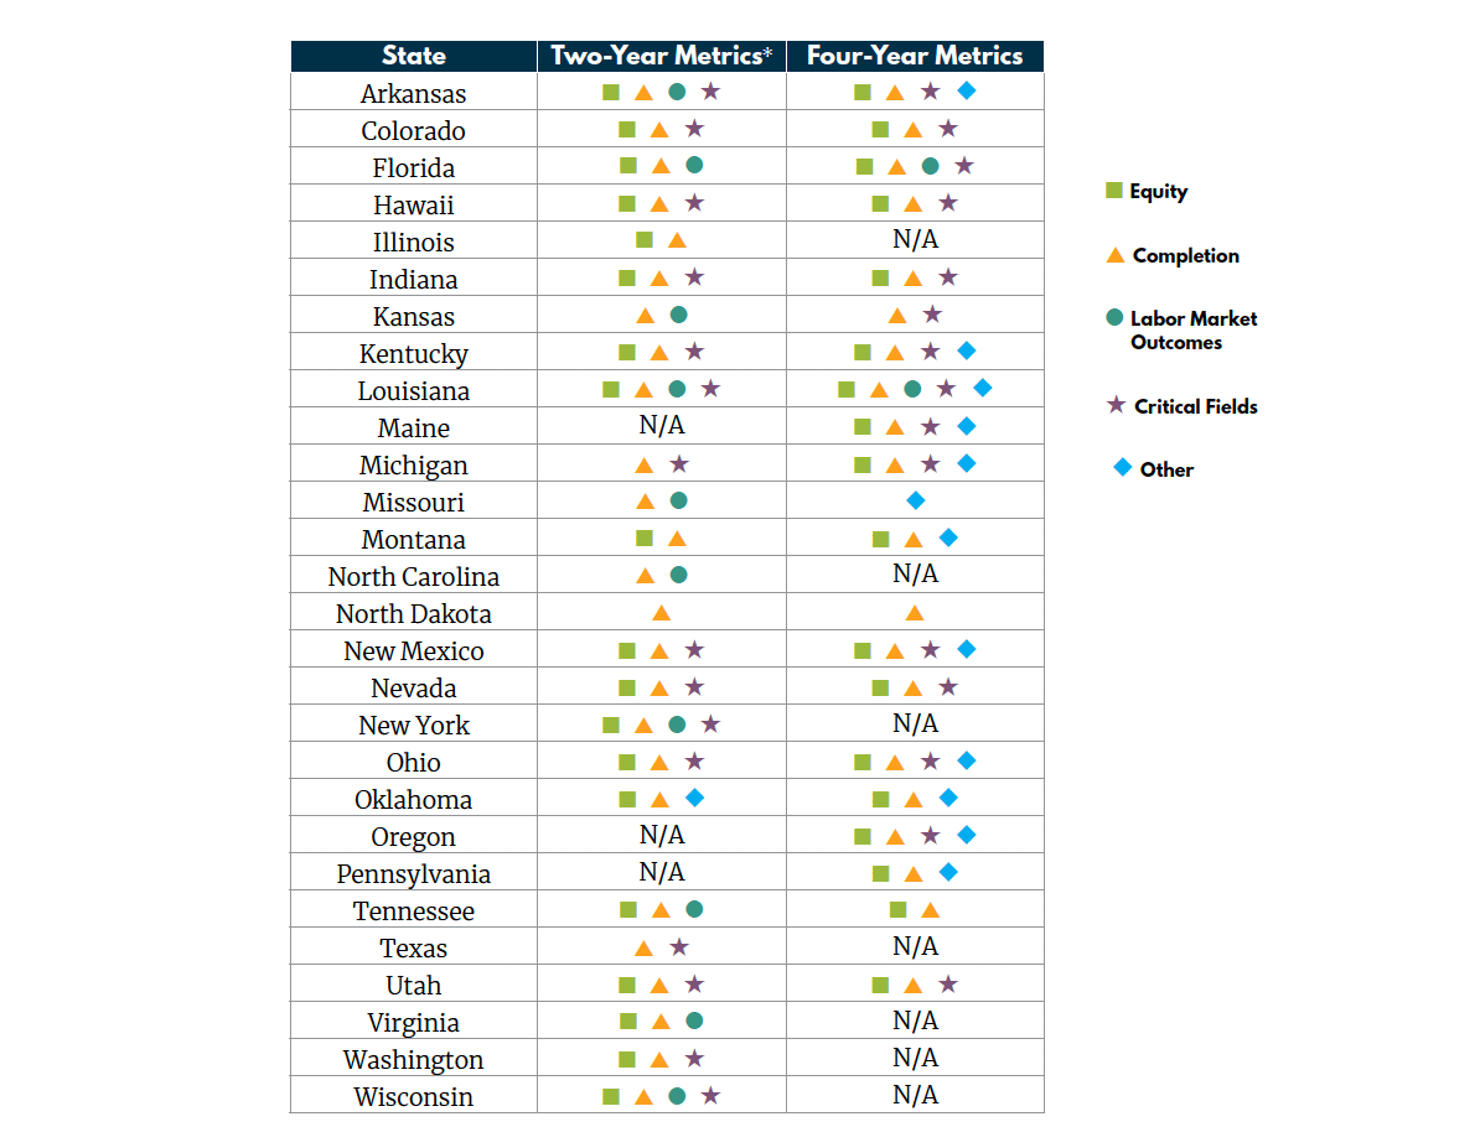
The map displays the most recent data on performance funding policies across states. Its legend indicates whether each state operates a policy for the two- and four-year sector, the four-year sector only, the two-year sector only, or that a policy is in development. The table shows the proportion of funding (dosage) of all state higher education appropriations tied to performance based outcomes. The legend indicates categories of metrics used: Equity (e.g., extra incentives for students of color, lower-income, and first-generation students who graduate); Completion (e.g.,degree completion, retention); Labor Market Outcomes (e.g., job placement, licensure); Critical Fields (e.g., incentives for degrees granted in STEM fields); and, Other (e.g., instructional costs,faculty productivity). For more details on what metrics each state uses and the categories they fall under, see the appendix.
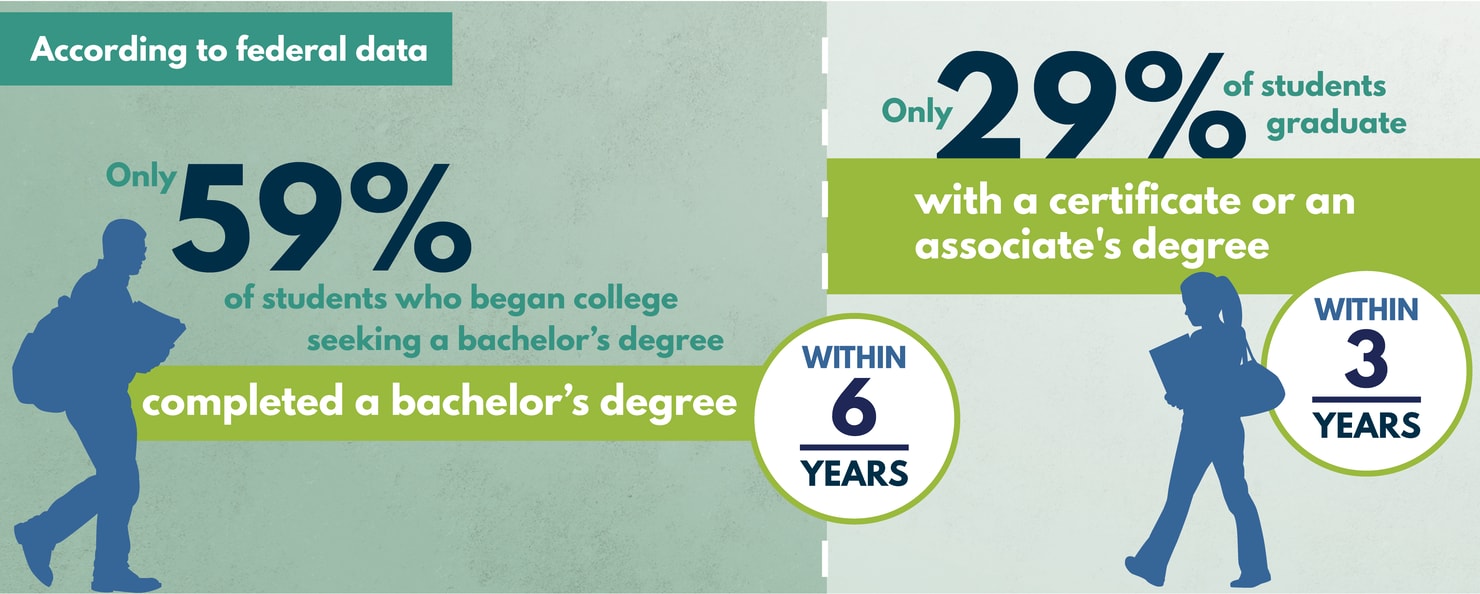
Why have many states shifted at least some of their investment in higher education from an enrollment-based to a performance-based funding model? The first reason is a national focus on college completion. According to the US Department of Education, 59% of students who began college seeking a bachelor’s degree completed a bachelor’s degree within 6 years. 8 For associate degree and certificate programs, 29% of students graduate within 3 years. These numbers even inflate graduation rates, because they only consider first-time, full-time students (who make up only 47% of attendees)—and we know transfer and part-time students are even less likely to graduate. 9 Postsecondary education is increasingly necessary to earn a living wage. Between 2014 and 2024, jobs requiring at least a postsecondary credential are projected to rise more rapidly than jobs requiring no college education. 10 Public colleges, therefore, are seen as vehicles to increase educational attainment and prepare the workforce that states need in the 21 st century. Skeptics of enrollment-based funding were concerned that this strategy incentivized college entry but not college completion. Colleges would readily accept state funding based on “seats in the classroom,” but face no consequences if students failed or withdrew from the class or dropped out completely. Performance funding was deemed the solution to a funding mechanism that failed to reward colleges for actually graduating students. In particular, states with lower rates of postsecondary educational attainment are more likely to pursue performance funding to try and increase those rates. 11 12
Performance funding also emerged in a broader environment of discussions around accountability in higher education. Rising tuition prices in the advent of deep cuts to state support for higher education during the Great Recession and higher levels of student loan debt have paved the way for greater oversight of public institutions.13 Colleges are increasingly being asked to demonstrate the value they provide to students and the public at large. Published annual rates of tuition and fees for full-time students in 2017-18 was $3,570 at public two-year colleges, $9,970 at public four-year colleges, and $34,740 at non-profit private colleges.14 Students only pay a fraction of these sticker prices after receiving institutional, state, and federal aid, but sticker prices continue to rise. In 2016-17, the federal government provided over $122 billion in taxpayer revenue to institutions in the form of financial aid, and states and localities provided over $97 billion in higher education support.15 It seems only natural to require institutions to show that they are spending these resources efficiently and delivering desired results.
How do Performance Funding Policies Differ Between States?
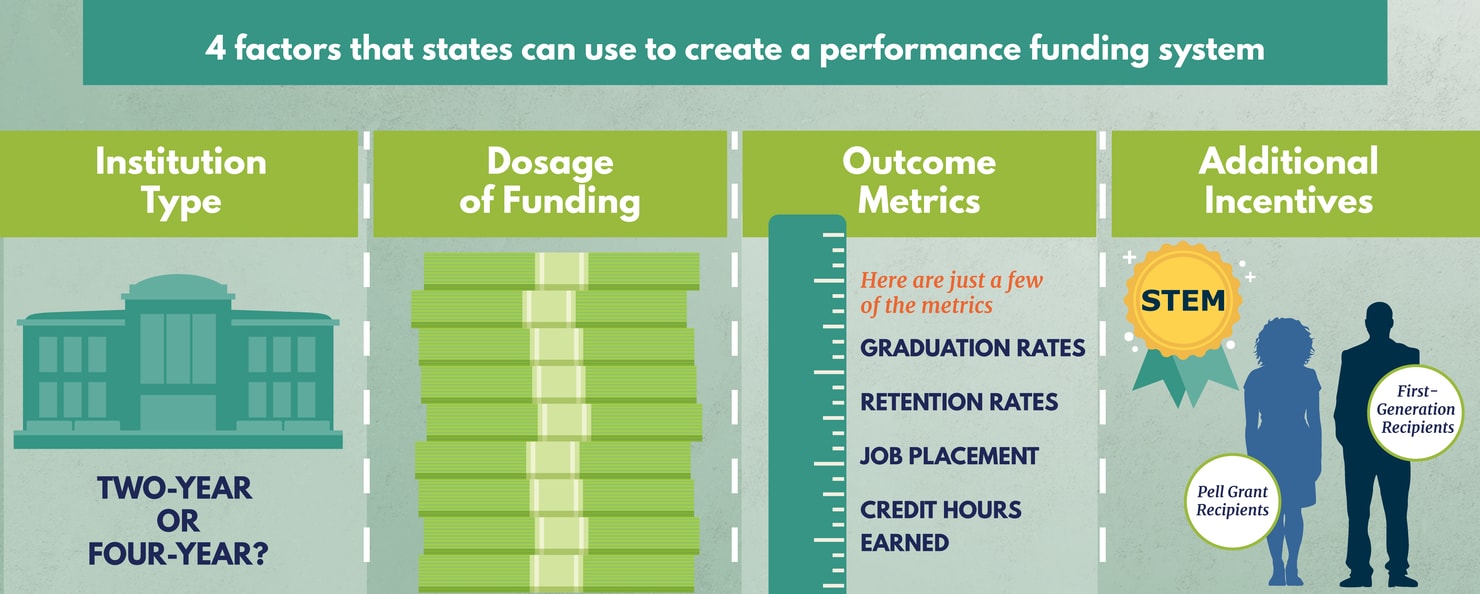
Institution Type
States vary substantially in the design of their performance funding policies. One difference is the type of institutions affected by the policy. Some states use performance funding for two-year institutions only (e.g. Washington), four-year institutions only (e.g. Oregon), four-year institutions in a specific higher education system (e.g. Pennsylvania), or both two- and four-year institutions (e.g. Ohio, Tennessee).16
Dosage of Funding
Another important distinction is the percentage of funding that states allocate based on performance. If performance funding can be a metaphor for taking a medicine for the treatment of a condition, the percentage of funding can be thought of as the “dosage” of medicine. Nationally, the dosage ranges from 1% to virtually 100%. For example, Washington State allocates 5% of all higher education funding to its two-year colleges based on performance; Indiana allocates 5%; Ohio allocates 100% for four-year colleges and 100% for two-year colleges; and Tennessee allocates approximately 80% based on performance. Yet high dosages are still outliers. 17
Outcome Metrics
The outcomes that states use to measure institutional performance also differ. All performance funding policies include retention and/or degree completion metrics. Some states also provide additional funding if institutions serve underrepresented students. These groups include students of color (most often defined as Black/African American and Hispanic/Latino students, and rarely includes Asian Americans or Pacific Islanders), Pell Grant recipients (lower-income students), first-generation students, and adult students (age 25 and older).18 The purpose of these special incentives (also called premiums, equity metrics, or bonus funding) is to reward institutions for enrolling and graduating students who historically face more roadblocks entering and completing college.
Additional Incentives
Some states also provide special incentives for institutions that award degrees in “high-need” fields, specifically in STEM (science, technology, engineering, and mathematics). There are concerns that the U.S. has a shortage of STEM college graduates, which affects the economic and global competitiveness of the country.19 Consequently, a number of states give extra funding to institutions for degrees completed by students majoring in STEM fields in the hopes of increasing their supply of qualified workers in these fields.20
Evidence on Performance Funding
Does Performance Funding Improve Degree Completion?
Much effort has gone into evaluating whether performance funding works. Beyond the pursuit of performance funding regimes for purely political reasons, the ultimate goal of these policies is to increase postsecondary educational attainment. This can be measured by the number of students in a state who earn associate’s and bachelor’s degrees. It can also be measured by graduation rates or the percentage of students who graduate within 150% of the typical degree completion time. The academic literature attempts to use methods aimed at drawing a causal link between performance funding and degree outcomes—asking whether the current policies are achieving their goal of improving student outcomes.
Overwhelmingly, the empirical research on performance funding suggests that in most current iterations at the state level, the policy fails to improve degree completions and graduation rates. At four-year institutions subject to performance funding, bachelor’s degree completions and graduation rates did not improve after the introduction of a performance funding policy. This result has been supported by research on performance funding systems in Pennsylvania, Tennessee, and Ohio.21 A number of multi-state studies conducted in recent and earlier years find that performance funding does not increase bachelor’s degree completions or graduation rates at institutions subject to the policy.22 One report finds that in Tennessee, bachelor’s degree completion within four years improved among full-time students from 2011 to 2013.23 A different report on Indiana’s performance funding policy using data from 2005 through 2011 suggests that among full-time students, positive impacts were observed on bachelor’s degree completions, declaration of a “high need” major (including but not limited to STEM), and completions in “high need” bachelor’s degrees. While degree completions were not seen for full-time Pell recipient students, the same study found that there was no evidence of a growing achievement gap after Indiana started performance funding.24 While the majority of peer-reviewed quantitative research on performance funding suggests that the policy does not increase degree completions, exceptions do exist. In particular, studies that present a series of statistical models have shown positive, significant impacts in select models, using lagged versions of the treatment variable and in single-year treatment variable interactions.
At two-year colleges, performance funding generally fails to produce increases in associate degree completions, and in some cases, the policy produces declines in degree attainment. This finding is consistent among studies of Washington, Ohio, and Tennessee.25 Multi-state studies also find no improvements in associate degree completion.26 Even among policies that give a higher “dose” of performance-based funds (defined as over 5%), the policy appears more likely to result in declines in associate degrees than increases.27
Does Performance Funding Change Institutional Practices?
Regardless of mixed evidence on whether performance funding increases college completion, other empirical works find encouraging changes at institutions exposed to performance funding. For one, the policy draws greater attention towards college completion goals and builds awareness of institutional performance.28 It also encourages better data collection and tracking efforts within institutions. Concrete institutional changes focus on two major areas: (1) Changes to academic policies and curriculum; and, (2) changes to student support services. Academic changes include easing the process for course articulation and transfer, placing in cohorts in efforts to improve retention, and reducing the number of excess credit hours required for a credential.29 Within STEM programs at four-year institutions subject to an extra state incentive for STEM, there are also instances of changes to instructional delivery methods and the facilitation of peer-to-peer mentorship.30
Among two-year colleges in Washington, Tennessee, Ohio, Florida, and North Carolina, improvements have also been made to developmental education (non-credit bearing pre-college courses also known as remedial, adult, or basic education).31 Passing developmental education courses in math, reading, and writing is positively associated with student retention.32 The changes sparked by performance funding have included accelerating programs and requiring fewer courses, adding tutoring or other supplementary instruction, and mandating new student orientation.
To some extent, inputs drive outputs, and colleges must play with "the hand they are dealt." However, we do know that this is only partially true, as some colleges with similar student populations experience different outcomes.
Research also suggests that performance funding initiates changes in student service policies, procedures, and programmatic offerings. Institutional changes include increasing academic advising, inviting faculty to engage in advising, using data analytics to predict dropout rates, and using “intrusive advising” to reach out to students who appear at risk of dropping out. Additional institutional responses consist of adding resources for in-person and online tutoring, improving upon first-year orientation programs and developing new first-year programming, eliminating fees for milestones such as applying for graduation, and increasing connections to employers to offer internships and improve job placement.33 Overall, performance funding catalyzes positive institutional actions to prioritize student outcomes, but these actions have not yet been enough to substantially move the needle on college completion.
Challenges in Determining the Impacts of Performance Funding
Of course, various factors can influence student retention and completion, some of which are outside the institution’s control. These include individual student characteristics, such as intrinsic motivation, academic preparation, family circumstances, and financial hardships faced. Performance funding relies on the assumption that colleges can make changes that can influence student behaviors and outcomes. To some extent, inputs drive outputs, and colleges must play with “the hand they are dealt.” However, we do know that this is only partially true, as some colleges with similar student populations experience different outcomes.34
Moreover, it is hard to pinpoint whether improvements in aggregate student outcomes can be credited to a specific college employee’s actions, such as a change in their teaching practice, course content, or advising style. For instance, in Washington State, even if an institution does earn more performance funds in one year, faculty and administrators say they have little way of knowing whether the changes they made in their day-to-day activities is the reason for better student performance.35
Performance funding draws greater attention towards college completion goals and builds awareness of institutional performance. It also encourages better data collection and tracking efforts within institutions.
There are also outside factors that are relevant to the question of whether performance funding works to increase college completion. The first is state disinvestment in higher education. In 2015-16, state and local appropriations per FTE (full-time equivalent) student were 11% lower in real dollars than ten years ago.36 States are more likely to pursue high-stakes performance funding when unemployment rates increase rapidly.37 Therefore, performance funding often gets adopted when the overall economy is poor, which coincides with even more disinvestment in higher education. Institutions’ lack of resources could explain their inability to improve college completion outcomes, despite good intentions.
A second external factor is changes in enrollment. Higher education enrollment runs countercyclical to economic conditions, especially at community colleges. Between 2007 and 2009, during the height of the Great Recession, enrollments at community colleges increased considerably but declined from 2011 to 2015 as the economy recovered.38 Shifts in enrollment and the demographics of college students impact the number of degrees earned. For instance, a state facing declining numbers of high school graduates will experience greater roadblocks to increasing the number of college graduates.
Unintended Consequences of Performance Funding
Performance funding policies are not without drawbacks. One can argue that although current policies have not increased college completion, they have catalyzed some important changes in behavior at the institution level that are not harmful to institutions or their students. However, evidence points to some negative implications of performance funding in certain iterations that should motivate policymakers to proceed with caution when designing state or even federal performance funding systems.
Increases in Short-Term Certificates
A major concern is that performance funding leads two-year colleges to graduate more students in certificate programs. Before policymakers realized this was an issue, they typically created policies that allocated the same amount of performance funds to institutions regardless of the type of postsecondary credential. Certificate programs require less than two years of full-time study to complete. Short-term programs require less than one year of study.39 When compared to associate degrees, certificates—especially short-term certificates—offer limited labor market benefits. This means that most graduates of certificate programs (with some exceptions in business, nursing, allied health, and protective services) do not experience wage increases or a higher likelihood of employment.40
Evidence in Washington State, Tennessee, and nationally suggest an increase in short-term certificates after performance funding.41 An increase in certificates overall is also seen in Tennessee and Ohio.42 The worry is that performance funding incentivizes colleges to route more students into short-term certificate programs at the expense of associate degree programs—especially if the funding reward is the same for both. This is detrimental for students if they end up earning certificates in fields that do not “pay off.” It is especially concerning if students are unaware of the economic value (or lack thereof) of their program of study. Yet, in many instances, colleges can count each certificate as a completion, which earns performance funds despite the lack of real value provided to their students.
To combat this issue, Tennessee revised its performance funding model for 2015-2020 to adjust the incentive for short-term certificates.43 Additional research is needed to see if this change helps boost associate degree completions. As more evidence of unintended consequences emerges, other states are likely to revise their performance metrics. Policymakers should consider matching performance incentives to the market value of the degrees. For example, the completion of a bachelor’s degree could earn performance funds based on the median starting salary of graduates in that field. While this idea certainly complicates the performance funding formula, it may be the route to take to ensure colleges are graduating students in marketable fields and with meaningful credentials.
Increases in Selectivity of Admissions Criteria
A second unintended consequence of performance funding is greater selectivity. Because performance funding emphasizes graduation outcomes, an institution can boost these outcomes by admitting students who are better academically prepared. Four-year institutions with admissions criteria can increase their selectivity by admitting students with higher GPAs and college entrance exam scores, as seen in Indiana after the start of performance funding.44 This practice is known as “creaming.” Even institutions that have open access admissions can focus their recruiting efforts on high school districts with wealthier and better academically prepared students. These practices disproportionally restrict admissions to higher education for students from disadvantaged backgrounds.45 When institutions raise their admissions criteria in the form of SAT/ACT scores, students of color and low-income students are especially likely to be denied admission.46
Evidence of increasing selectivity in response to performance funding is well-documented. Colleges institute new admissions criteria, raise existing criteria, target recruiting efforts at high schools with high achieving students, recruit out-of-state and international students, and offer more merit-based aid instead of need-based aid to attract better-prepared students.47 Policymakers should also be cognizant of this potential consequence and take steps to address it in policy design so that performance funding does not diminish access to higher education for the students who need it the most.
Lowering Academic Quality and Expectations
A third troubling unintended consequence of performance funding is the weakening of academic standards. Institutions need to graduate more students to earn performance funds. Faculty and administrators have raised concerns and observed instances of grade inflation in an attempt to reach those goals.48 This involves actions such as passing students who otherwise should have failed a class. Another concern is the reduction of credits necessary to earn a degree. While curbing “excess” credits is important, credits appear to be reduced without proper assessment of academic implications. These institutional responses run counter to academic rigor and quality. Performance funding incentivizes the number of degrees, yet current policies rarely include a mechanism to ensure the quality of those degrees. This too must be addressed if performance funding is going to achieve its desired effect—rather than incentivizing institutions to concentrate on degree production at the expense of academic rigor and student learning.
Policy Designs Matter
Premiums for Disadvantaged Students
Many state policies attempt to curtail the unintended consequence of rising selectivity criteria by adding incentives for institutions to serve historically disadvantaged students. Emerging evidence suggests that the inclusion of performance incentives for underrepresented students does help counteract the unintended consequence of creaming. Rather than not admit these students, institutions are incentivized to better serve these students, and choose to develop mentorship programs and create scholarships specifically for students of color and low-income students.49
For example, Tennessee provides an additional 40% of funding for each student who graduates if that student is eligible for Pell Grants (lower-income) or is considered an adult (25 and older).50 Ohio provides extra funding for Pell-eligible, adult, and students of color.51 Recent studies examining the impact of how these special incentives—also referred to as premiums, equity metrics, and bonus funding—affect student enrollment and completion have been mixed in part due to variations in policy design. For example, in response to performance funding, two-year colleges in Tennessee appeared to decrease both the number and the proportion of enrolled students who are age 25 and older, yet increase the number and proportion of low-income students.52
Emerging evidence suggests that the inclusion of performance incentives for underrepresented students does help counteract the unintended consequence of creaming.
Prioritizing some categories of students also has impacts on enrollment of other underrepresented groups. One national study examines the effect on student enrollment of performance funding premiums for low-income students, and of premiums for students of color.53 At four-year institutions in states with performance funding premiums for low-income students, enrollment numbers increased for low-income students, as well as for Hispanic, Asian, and White students, yet enrollment of Black students declined. Premiums for students of color did not change enrollments of Hispanic or Asian students but did decrease enrollments of Black and White students. As a practical explanation, institutions may be better equipped to recruit low-income students in response to the premium, yet less able to recruit students from specific racial groups.
Another recent study collectively explores the effect of three different types of performance funding premiums: low-income, students of color, and adults.54 A state is considered to have a premium, generally speaking, if it has one or more of these three types of premiums. In contrast to the previously noted study, this study finds that performance funding policies with any type of premium result in an increase in Black student enrollment at four-year institutions. Premiums also produce an increase in low-income students. Although, evidence for students from differing age groups is mixed, with less selective institutions experiencing declines in undergraduate students aged 24 or younger and more selective institutions experiencing rises.
Due to conflicting evidence on the effect of performance funding premiums on Black student enrollment, in particular, more research is needed to draw consistent policy recommendations on premiums for underserved students. Research is also needed on whether these premiums affect graduation outcomes, and not just enrollments, of underserved students—since ultimately completion is what these policies are intended to improve.
Even if states do not directly offer premiums for underrepresented students, performance funding policies that include developmental education outcomes can indirectly benefit colleges that have a special mission to serve particular groups of students of color, such as minority-serving institutions (MSIs). One study on two-year colleges in Texas and Washington finds that minority-serving institutions received similar levels of state appropriations after performance funding as institutions without the MSI designation. While MSIs tended to receive fewer performance funds for completion outcomes, they receive more funds for developmental education and gatekeeper course completions.55
While experts agree that the performance-based funding amount must be consequential, there is no defined threshold for how much funding is enough.
Incentives for STEM Degrees
The second focus of special incentives in performance funding policies is on STEM degrees. As of 2015, there were 13 states with a funding premium for STEM degrees earned or a separate performance outcome for STEM degrees. Evidence shows that compared to institutions under performance-based funding systems without a STEM incentive, institutions under performance funding with a STEM incentive increase STEM bachelor’s degrees by 11% to 12%. Compared to institutions without any performance funding, this difference is 16% to 20%, or an approximate 5% increase each year after performance funding STEM incentives begin.56 This positive impact remains even if states allocate relatively small proportions of funding based on performance (e.g. 5%). While research points to no overall increase in bachelor’s degree completion thanks to performance funding policies, the prioritization of STEM in such policies does improve attainment in the STEM fields. It is important to remember, however, that performance funding is only one of many initiatives aimed at increasing STEM graduates.
It is clear that differences in performance funding policy designs matter. The selection of which outcomes to fund and the inclusion of premium funding for disadvantaged students are notable examples. Policymakers can tinker with these design choices to better align policies with their postsecondary education goals.

Proportion of Performance-Based Funding
In addition to the wide range of policy design choices outlined above, questions remain on the “right dosage” of the performance funding medicine. Is there an ideal proportion of state funding that should be tied to institutional performance? How would that translate on the federal level? What is the minimum proportion of funding needed to get institutions to pay attention and make changes? These questions have not yet been answered. Perhaps no answer exists that would be suitable for all states—or to determine the precise right dosage for a federal performance funding policy. While experts agree that the performance-based funding amount must be consequential, there is no defined threshold for how much funding is enough.
Dosage does matter, however, for whether institutions respond to performance funding. For two-year colleges, policies that tie more than 5% of higher education funding to outcomes (Arkansas, Indiana, Nevada), and especially policies that tie over 25% (Ohio), are more likely to produce changes in credentials awarded.57 These stronger policies tend to increase short-term certificates and decrease associate degree completions (showing institutional behavior changes, but not necessarily ones that benefit students). Policies with 5% or less do not result in any credential completion changes. Ohio and Tennessee are two states that place more than 80% of funding based on outcomes. Institutions in these states saw declines in associate degree completions and no changes to bachelor’s degree completions.58 In these cases, it is difficult to make the argument that more money needs to be tied to stir institutional changes.
Lessons Learned
As this report describes, there is plenty of evidence that points to both the benefits and drawbacks of performance funding policies. This evidence is being used to put forth a number of recommendations to improve the design and function of performance funding at the state level. And many of the recommendations put forth are also applicable to conversations related to higher education accountability at the federal level.
Best Practices
Best practices recommend stability for performance funding policies. Policies that get abandoned during economic downturns lack the stability needed for institutions to want to improve their outcomes long-term. Stability in the outcomes incentivized and the amount of performance-based funding is necessary. Embedding performance funds into the base budget for higher education increases its sustainability.59
Simplicity is also important when it comes to designing performance funding policies. Having too many metrics is a surefire way to dilute institutions’ focus areas and make data collection and reporting more difficult. A smaller set of measurable outcomes is important for long-term political and institutional support for performance funding.60
The use of progression metrics, such as student credit hour milestones (completing 30 credits, 60 credits) is important, in addition to the final metric of degree completion. Policies should incentivize the steps that students take towards earning a degree and not just degree completion alone.
Formulas should also differentiate between different types of institutions. The performance outcomes incentivized should look different for research universities, comprehensive universities, and two-year colleges.61 Whereas two-year colleges have a transfer mission and should be rewarded for transfers, associate degrees, and certificates, research universities will be better served by a formula that rewards bachelor and graduate degree completions.
Performance funding should focus attention towards the academic programs that states deem important for the region. Providing special incentives and extra funding for STEM degrees recognizes that the cost of instruction in many STEM fields is high.62 Ideally, the performance incentive is above and beyond this level to give institutions that extra push needed to increase the number of STEM graduates. One recommendation is to fund student outcomes on the way to earning a STEM degree, such as the passage of gatekeeper courses (e.g., calculus, organic chemistry) and the declaration of a STEM major.63
Relatedly, performance funding models should incorporate additional incentives or premiums for historically disadvantaged students, who are born into families with lesser social capital, have faced historical barriers to higher education, and are consequently less likely to graduate. These students include low-income, first-generation, adult students, and students of color. Performance funding premiums are crucial for limiting the temptation to restrict admissions. Premiums also recognize the greater amount of resources and support needed for historically disadvantaged students to graduate.
Connections to Federal Policy
What are some ways that federal policymakers can incorporate ideas around performance funding to get the upsides of focusing on better student outcomes without spurring the downsides of unintended consequences? Certainly, at its most basic level, the policy aims to incentivize institutional behavior through its clear use of carrots and sticks. Existing federal mandates can be applied in ways to boost college completion. One example is the requirement for colleges that receive federal student aid to report annual data via IPEDS (Integrated Postsecondary Education Data System run by the Department of Education). A similar requirement related to performance accountability may be feasible.
If accountability in the form of a broader performance funding system is advanced at the federal level, it is important to keep in mind that “one size does not fit all.” Certainly, student retention and degree completion outcomes can be universally applied, for all institutional types and all state contexts. Yet, the “devil is in the details.” A federal performance funding system would be remiss if it did not include incentives for postsecondary attainment among students of color, first-generation students, students from lower income backgrounds, and working students. It may also be advisable to include incentives for decreasing achievement gaps between student subpopulations. In short, college completion mechanisms in the absence of access and equity goals would perpetuate the myth that higher education is the great equalizer of our society without putting our money where our mouth is.
In addition to a focus on college completion, policymakers may wish to consider other performance metrics. For example, the value of the academic credential earned is an important aspect of degree completion. “Value” here refers to increases in wages and increases in employment prospects that students gain when they graduate with a college degree. Institutions typically collect data on the starting salaries of graduates in each major. Median starting salaries, as well as the percent of graduates employed after 9 months, are two outcomes already being collected that illustrate the economic value of a degree. One idea is to vary the amount of performance funding allocated based on the field of the degree completed. This potentially controversial idea raises additional questions, such as the accuracy and representation of salary data, as well as the non-quantifiable benefits of attending college, yet is worth considering. Performance funding at the state level already integrates this idea by awarding greater funding for STEM degree completions. This adjustment could also protect against an increase in attainment of low-quality certificates that are quick to complete but have little value in the marketplace.
Federal policymakers should additionally keep in mind that any introduction of a performance accountability system will interact with existing policies at the local, state, and federal level. For instance, during reauthorizations of the Higher Education Act, Congress added requirements that institutions with high cohort default rates (the percent of student borrowers who default on student loans after leaving college) can no longer receive federal financial aid. Placing pressure on colleges to graduate more students via performance funding and to reduce loan default rates simultaneously may exacerbate unintended consequences such as colleges resorting to admitting fewer low-income students. The Senate Committee on Health, Education, Labor, and Pensions has pointed to cohort default rates and other federal accountability structures that are worth revising and refining.64 In considering performance funding at the federal level, one must be aware of other potentially complementary or competing accountability structures.
In conclusion, there is a myriad of information on the rationale for, impacts of, and best practices surrounding performance funding at the state level. Implementing a similar accountability system at the federal level which borrows insights learned from existing evidence presents a unique opportunity to improve national college access and completion. Lessons learned from state-level policies can certainly inform the development and implementation of a federal performance-based accountability approach.
Appendix