Report Published March 3, 2021 · 14 minute read
Paying More for Less? A New Classification System to Prioritize Outcomes in Higher Education
This policy brief is based on research supported by Arnold Ventures. The views expressed in this report are solely those of its authors and do not necessarily represent the views of our funders.
Colleges and universities in the United States have faced considerable financial challenges since the emergence of the COVID-19 pandemic. While the extent of this economic turmoil cannot yet be fully determined, policymakers can look to what happened in the higher education sector following the Great Recession for important lessons when responding to the current economic downturn. To this end, we examine enrollment patterns, labor market outcomes, and default rates among college students following the Great Recession to offer a national picture of who is typically helped and harmed following a major economic shock. Our analysis provides grounding for a new classification system for measuring college students’ ROI and seeks to inform targeted policies designed to protect students with the greatest need for support in response to the COVID-19 pandemic. The new classification system considers both relative net prices and repayment outcomes to identify (1) low-price, high-quality institutions, (2) low-price, low-quality institutions, (3) high-price, high-quality institutions, and (4) high-price, low-quality institutions.
Enrollment Trends Following the Great Recession
In response to the Great Recession, total enrollment at all types of colleges and universities increased from 18.3 million students in Fall 2007 to roughly 21 million students in Fall 2010, as a tight labor market led more students to enter or return to postsecondary education.1 Figure 1 shows enrollment trends among three specific subgroups of students—Black students, Hispanic students, and Pell Grant recipients (used as a proxy for low-income students)—at public, private non-profit, and for-profit institutions.2 Enrollment at both community colleges and for-profit four-year institutions increased following the Great Recession, particularly among Black students and Pell Grant recipients, but enrollment at community colleges and for-profit four-year institutions returned to pre-recession levels by 2015.
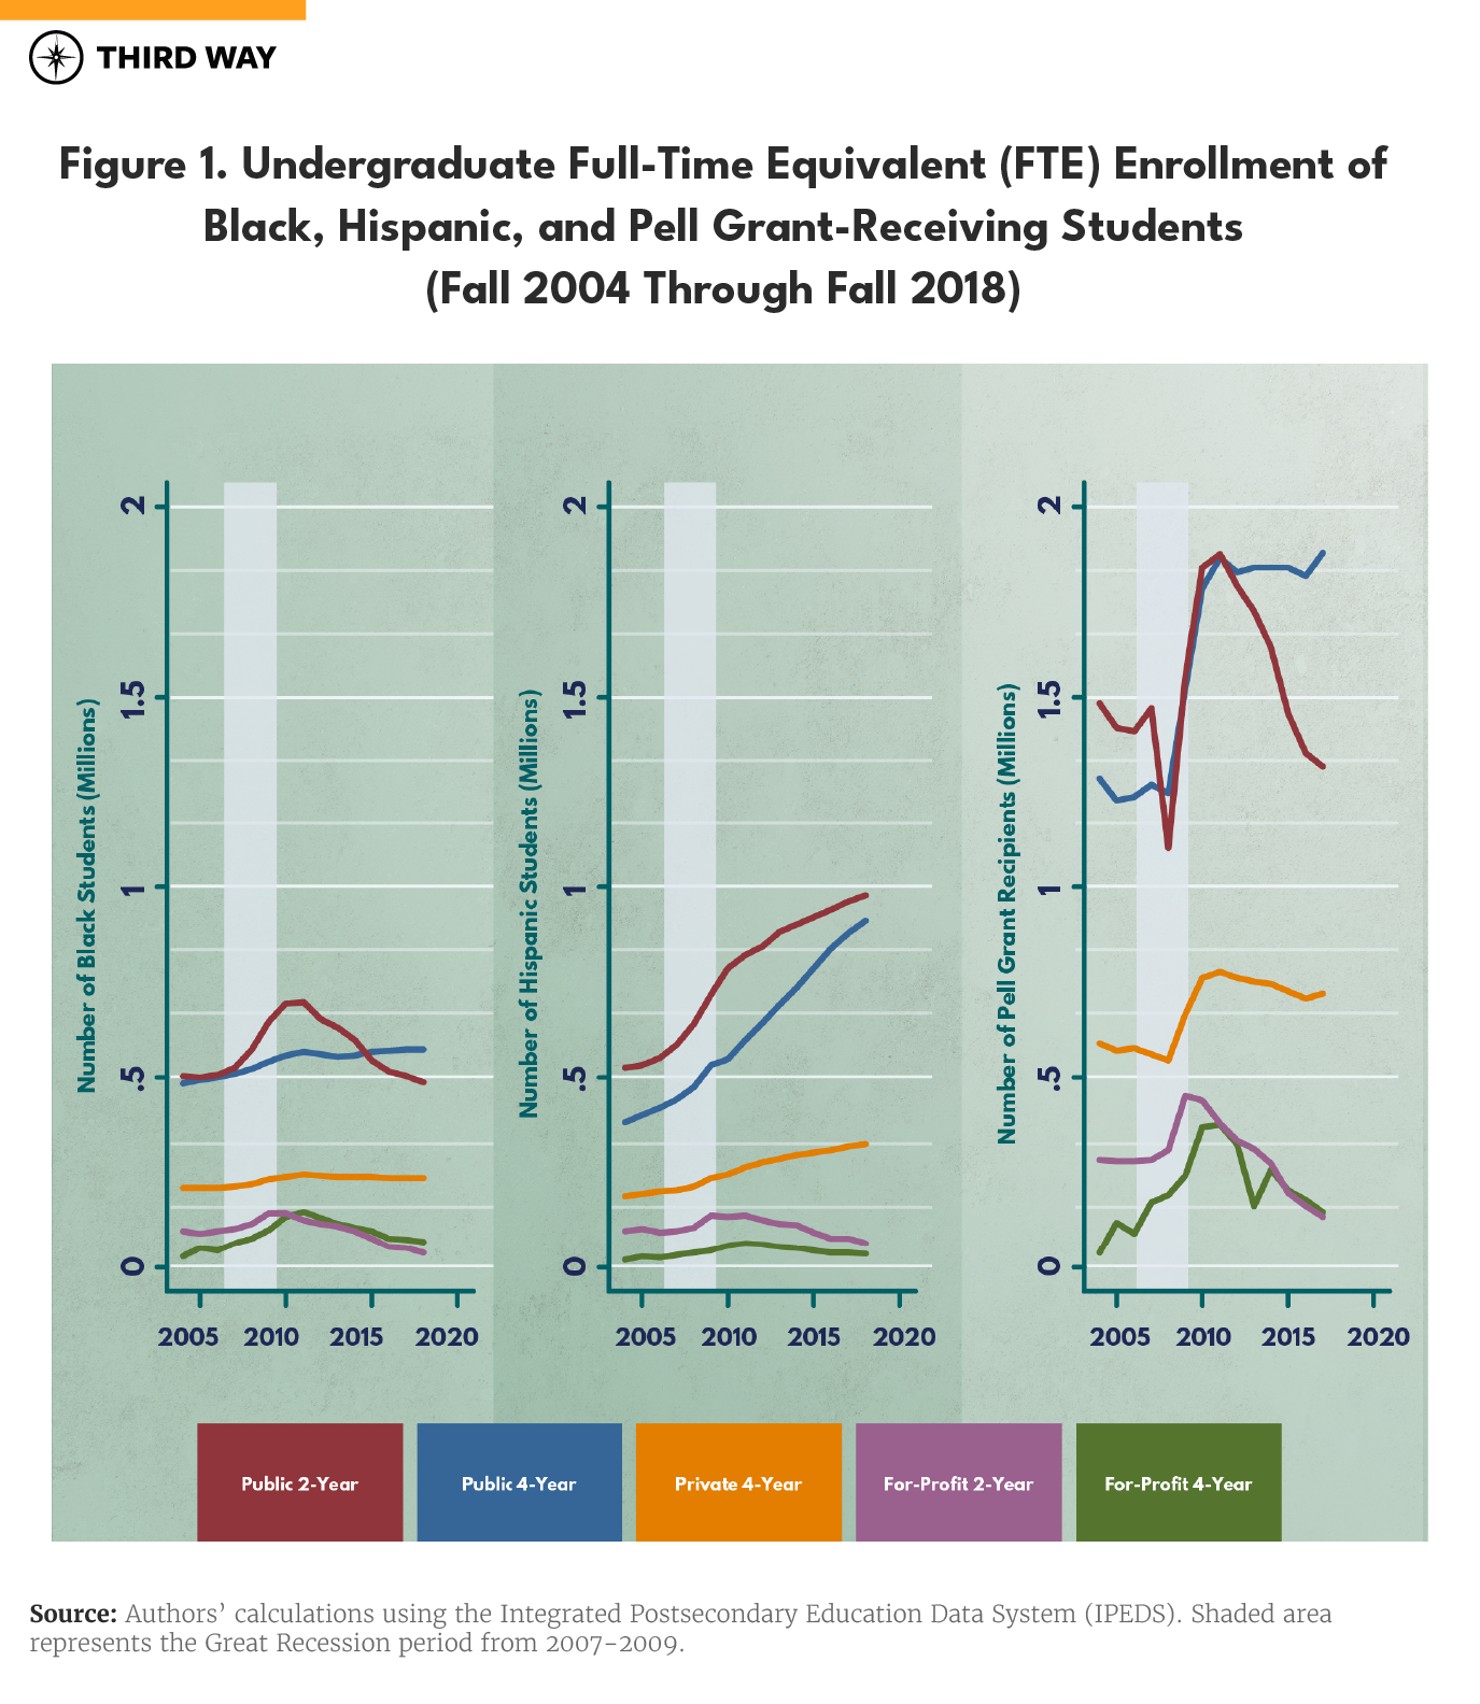
Although enrollment patterns offer important insights regarding the role of the higher education sector following the Great Recession, the most critical consideration is how students, particularly underserved subgroups of students, fared after they enrolled at a college or university. The proportion of students who completed their certificate or degree varied widely according to their background characteristics and the type of institution they attended. For example, the six-year graduation rate for Black students who entered higher education in Fall 2012 was 42.9% at public four-year universities and 45.5% at private non-profit four-year universities, but only 14.2% at for-profit four-year institutions. And while Hispanic students were more likely to graduate than their Black peers across all institution types, the general pattern of lower six-year graduation rates at for-profit four-year institutions remained the same, with 55.2% completing at public four-year institutions, 57.1% completing at private non-profit four-year institutions, and just 28.1% completing at for-profit four-year institutions.
Labor Market Outcomes Following the Great Recession
Labor market outcomes represent another important determinant of students’ ROI in pursuing higher education. Employment rates, measured as the percentage of students working after leaving their higher education institutions, and the average earnings of employed students are two key indicators of students’ success in the labor market. Given the variations in enrollment patterns and graduation rates across institution types, labor market outcomes may differ across sectors of higher education institutions. Documenting such outcomes for historically underserved student subgroups, especially students from lower-income households, is therefore essential for understanding institutional effectiveness in promoting students’ economic mobility.
Figure 2 presents the employment rates of degree-seeking college students six years after initial enrollment according to the type of institution they attended. Although students at for-profit four-year institutions had comparable employment rates to those attending other four-year institutions in the pre-recession period, we show that they had significantly lower (and consistently declining) employment rates after the Great Recession.
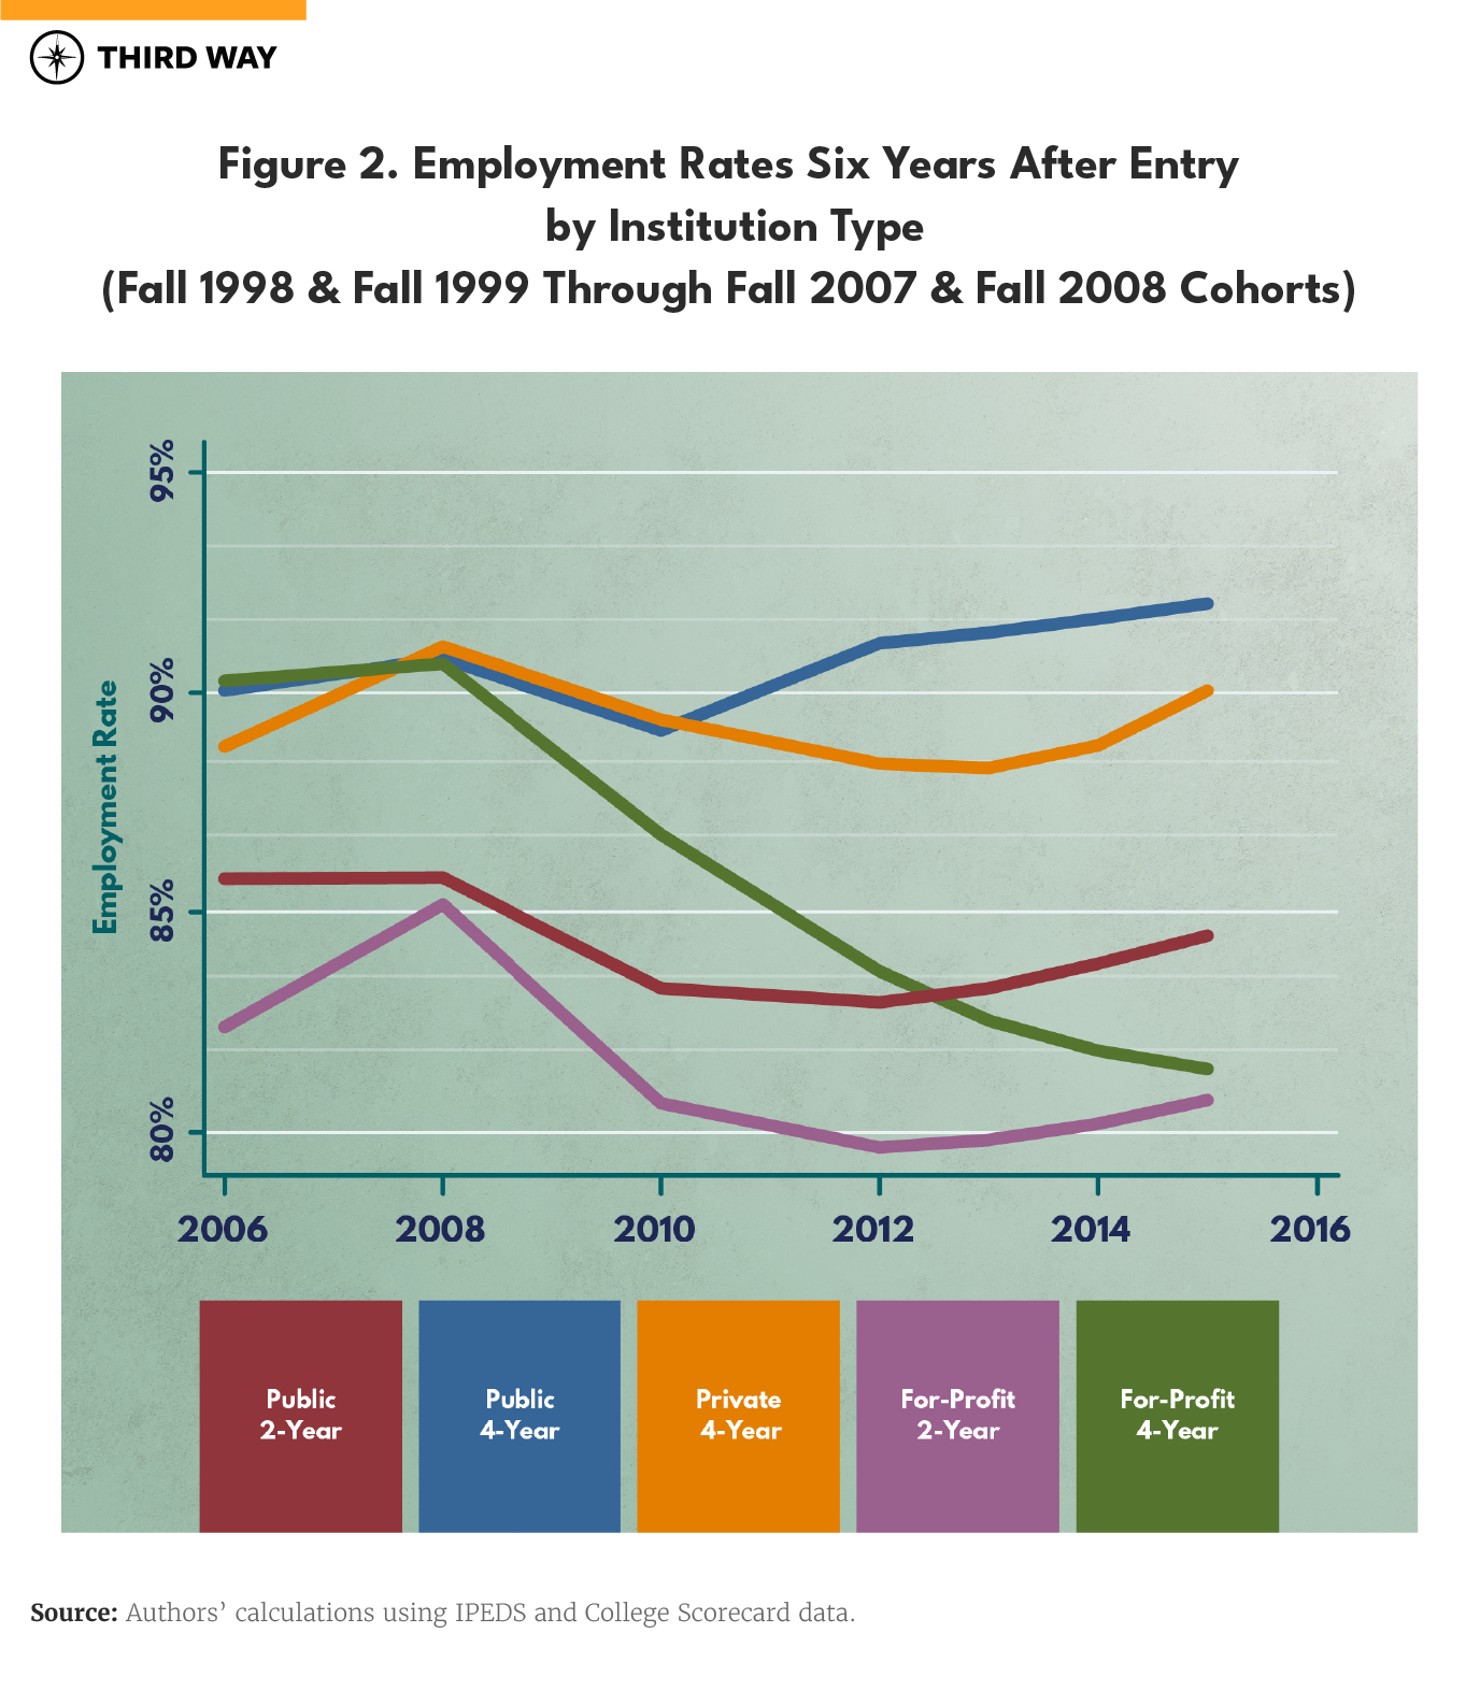
Figure 3 reveals similar patterns when examining low-income students’ average earnings six years after entering higher education.3 Low-income students at for-profit four-year institutions had similar average earnings when compared to students at other four-year institutions prior to the Great Recession, but for-profit students experienced sharp declines in earnings during the period following the Great Recession—the same period in which for-profit institutions proliferated.
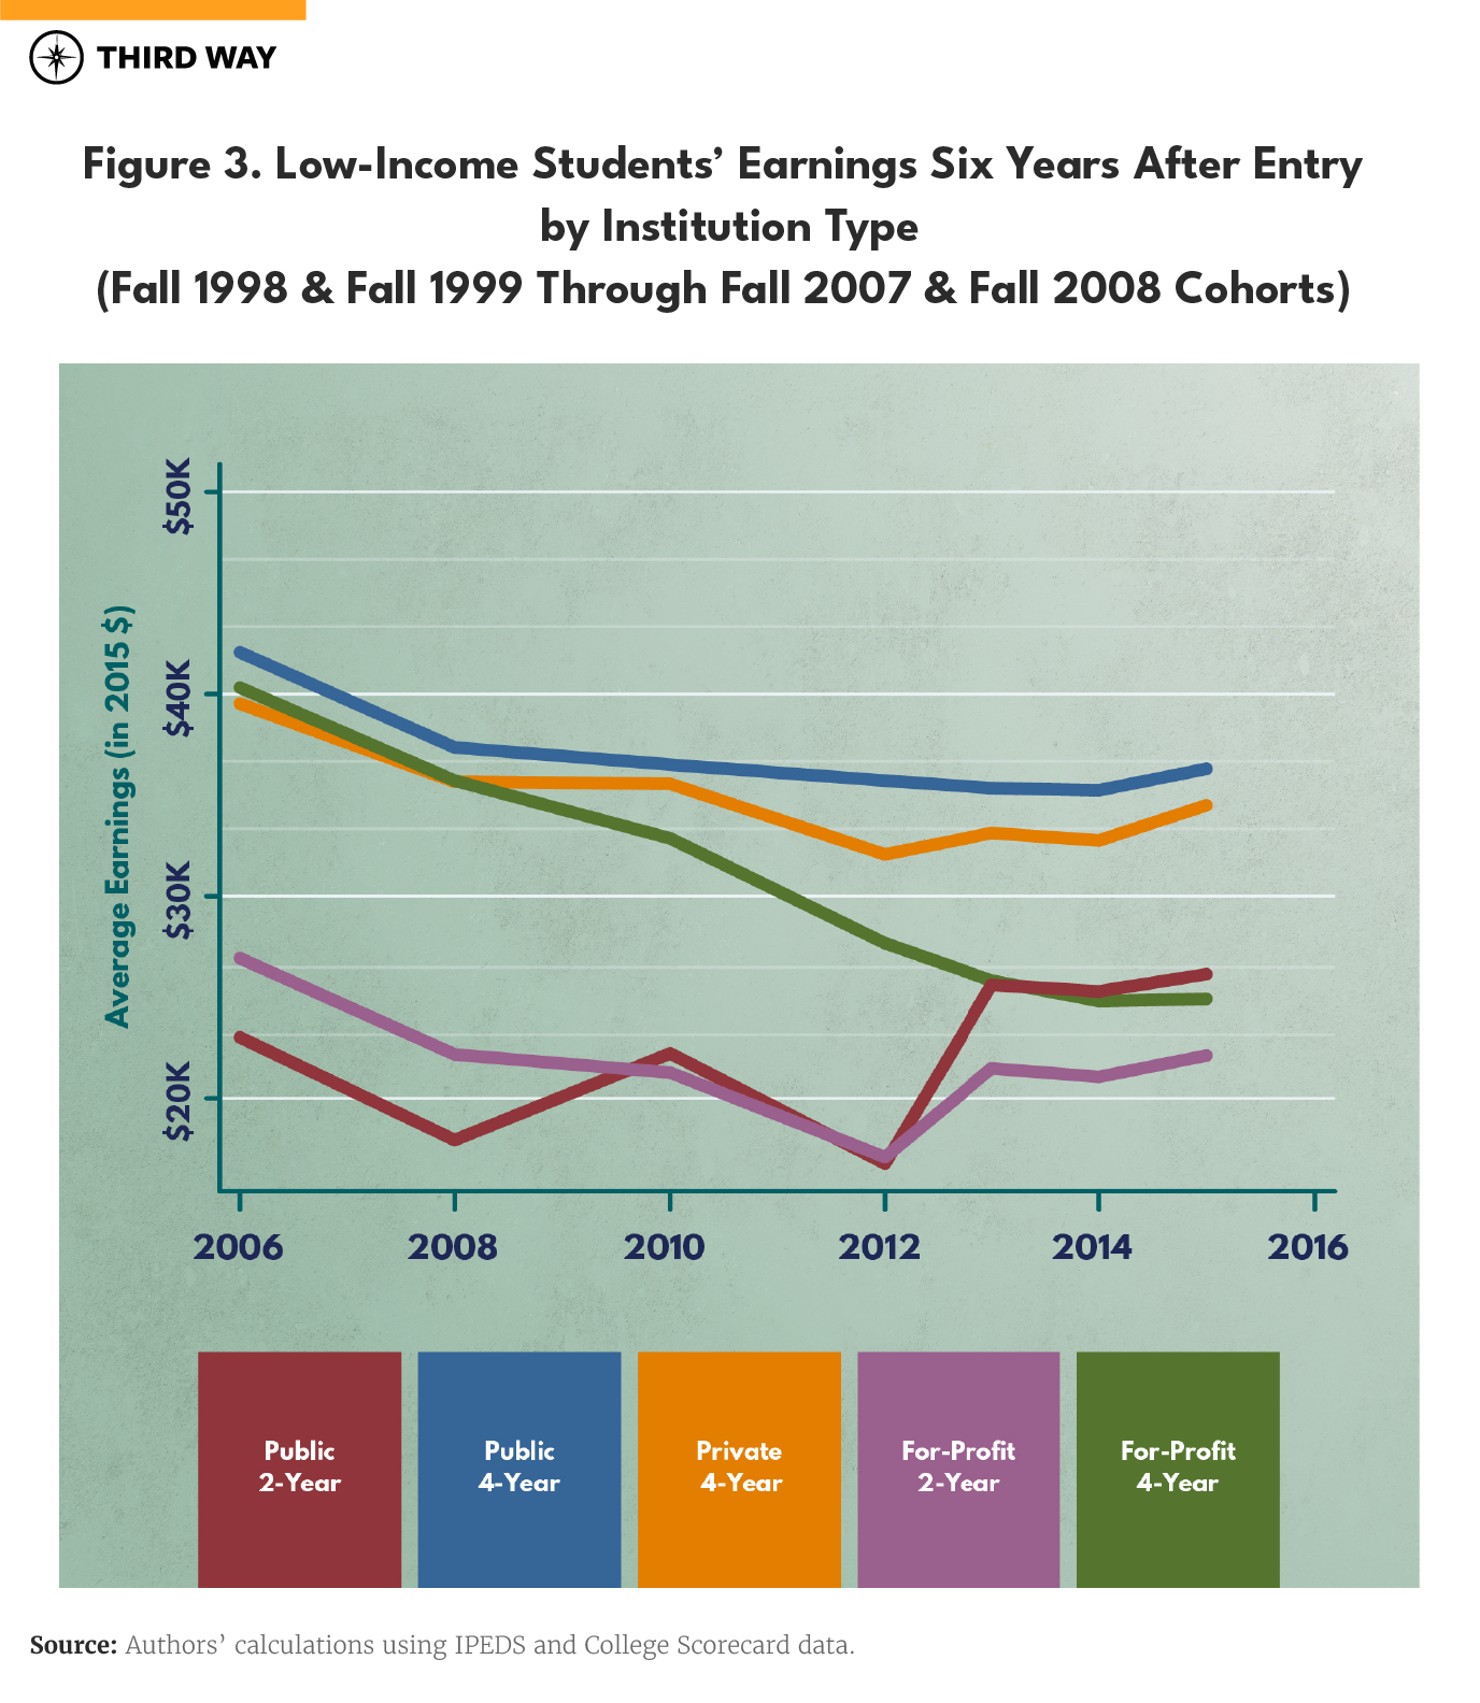
Several contextual factors can explain why for-profit students who entered in the late 1990s and early 2000s had significantly better labor market outcomes than later cohorts of for-profit students. Setting aside that for-profit institutions enrolled a larger share of working adults who may have started at a higher income level before entering higher education to begin with, the combination of deregulation of for-profit colleges and the proliferation of online education during the 2000s led to substantial increases in for-profit enrollment and the rapid decline of for-profit students’ labor market outcomes.
Student Loan Debt Outcomes Following the Great Recession
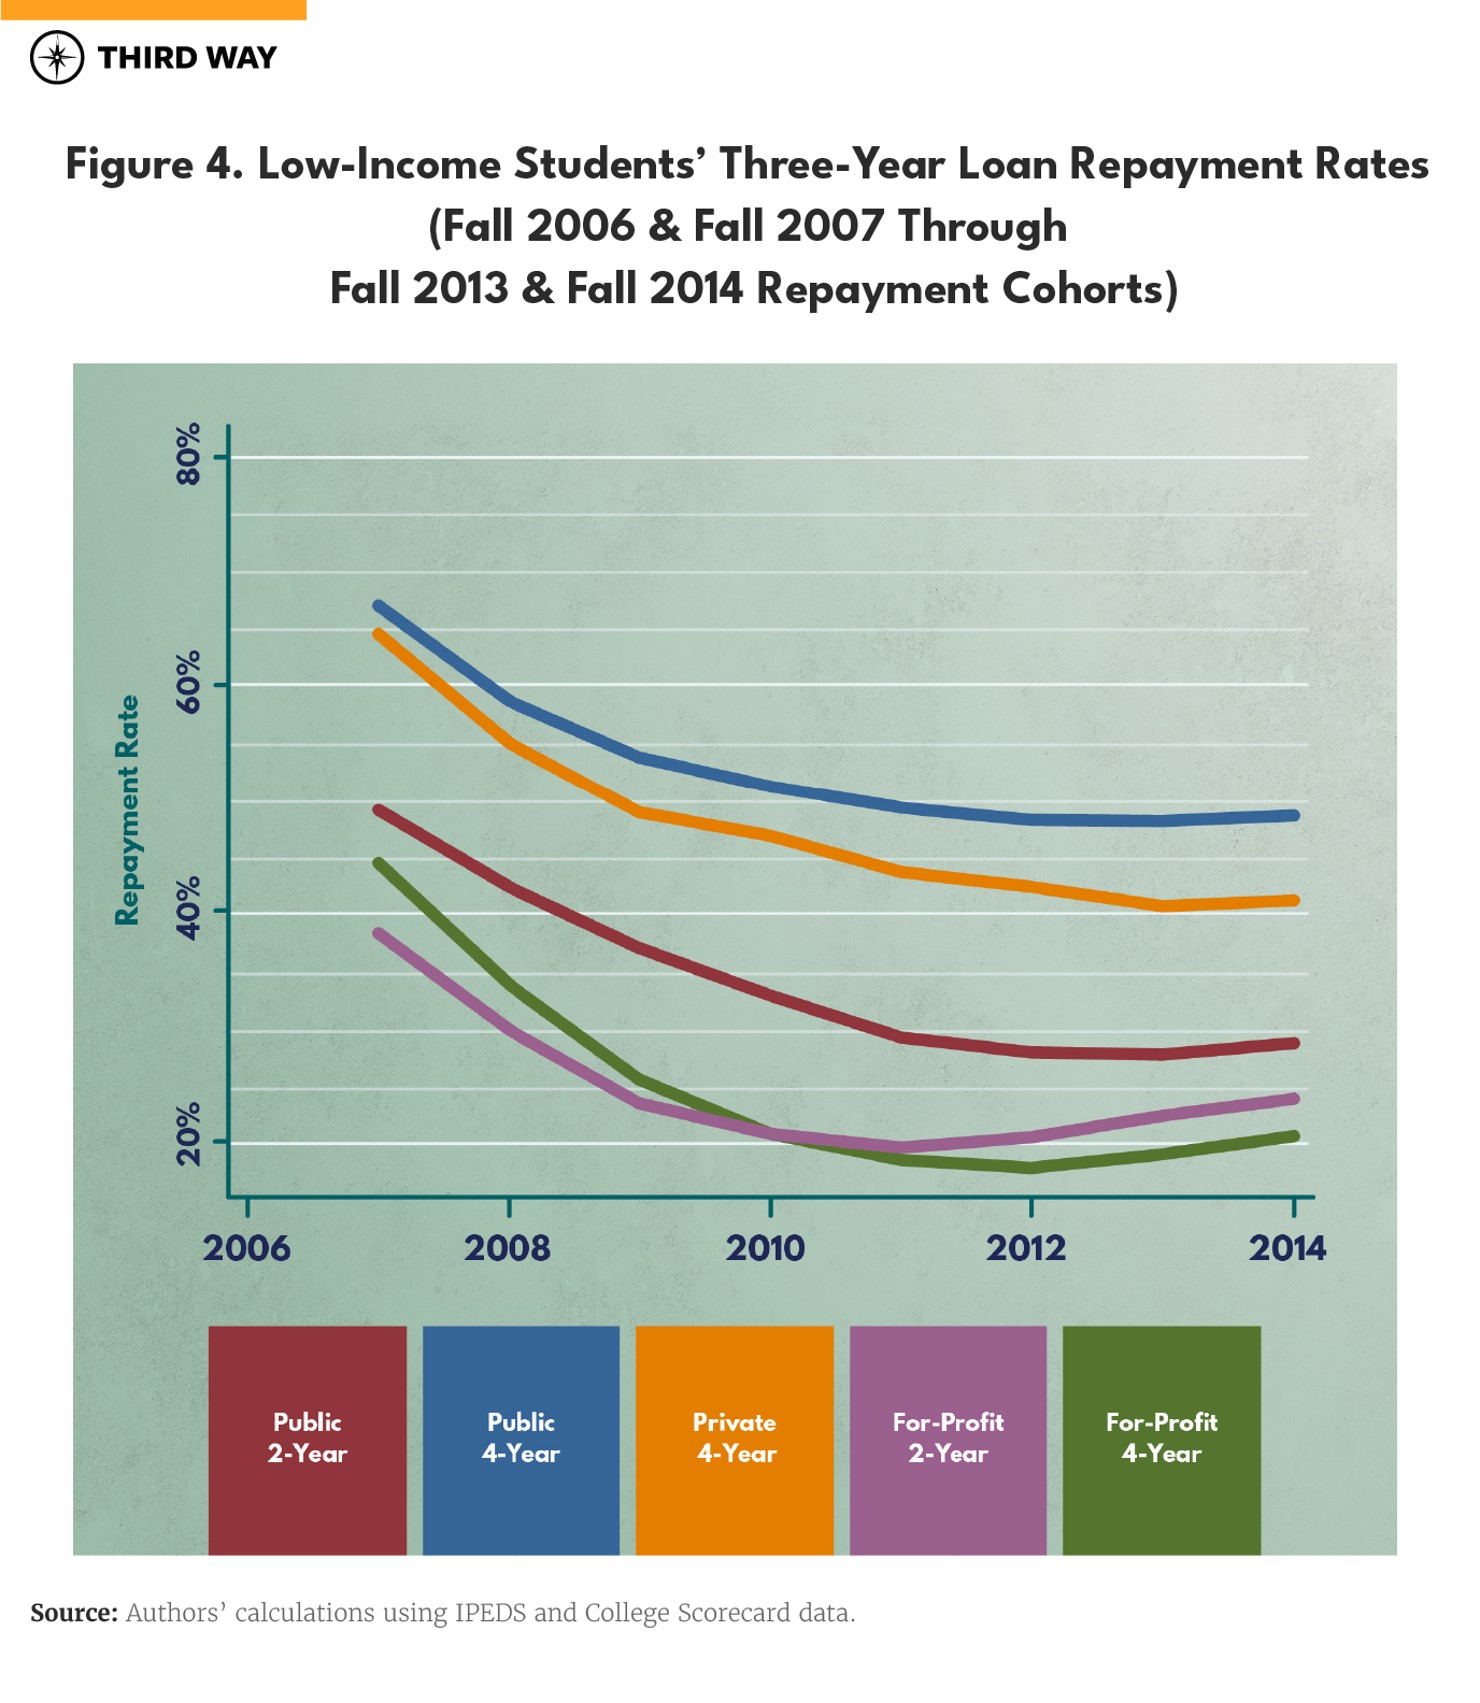
Another way to identify whether college students received a return on their postsecondary investment is to look at their ability to repay their student loan debt. Defaulting on student loan repayment represents a devastating outcome for borrowers that can lead to damaged credit scores, garnished wages, and withheld tax refunds.4 Figure 4 shows three-year repayment rates across institution types, focusing specifically on low-income student borrowers.5 Although repayment rates appeared to decline following the Great Recession across all institution types, the data once again show that low-income students at for-profit institutions faced the steepest declines and had the lowest repayment rates.
A New Classification System for College ROI
Building on these analyses, it is clear that underserved students enrolled disproportionately at for-profit institutions following the Great Recession and received a poor return on their educational investment after doing so.6 To better understand how well different types of institutions are really serving students, we propose a new classification system for higher education by outlining four types of four-year colleges and universities:
- Low-price, high-quality institutions (LPHQs)
- Low-price, low-quality institutions (LPLQs)
- High-price, high-quality institutions (HPHQs)
- High-price, low-quality institutions (HPLQs).7
For the purposes of these classifications, a high-price institution charges a higher-than-average net price, and a high-quality institution has above-average adjusted repayment rates after controlling for the proportion of Black students, Hispanic students, Pell Grant recipients, and full-time students at each institution.8 The same logic holds for both low-price and low-quality institution types.
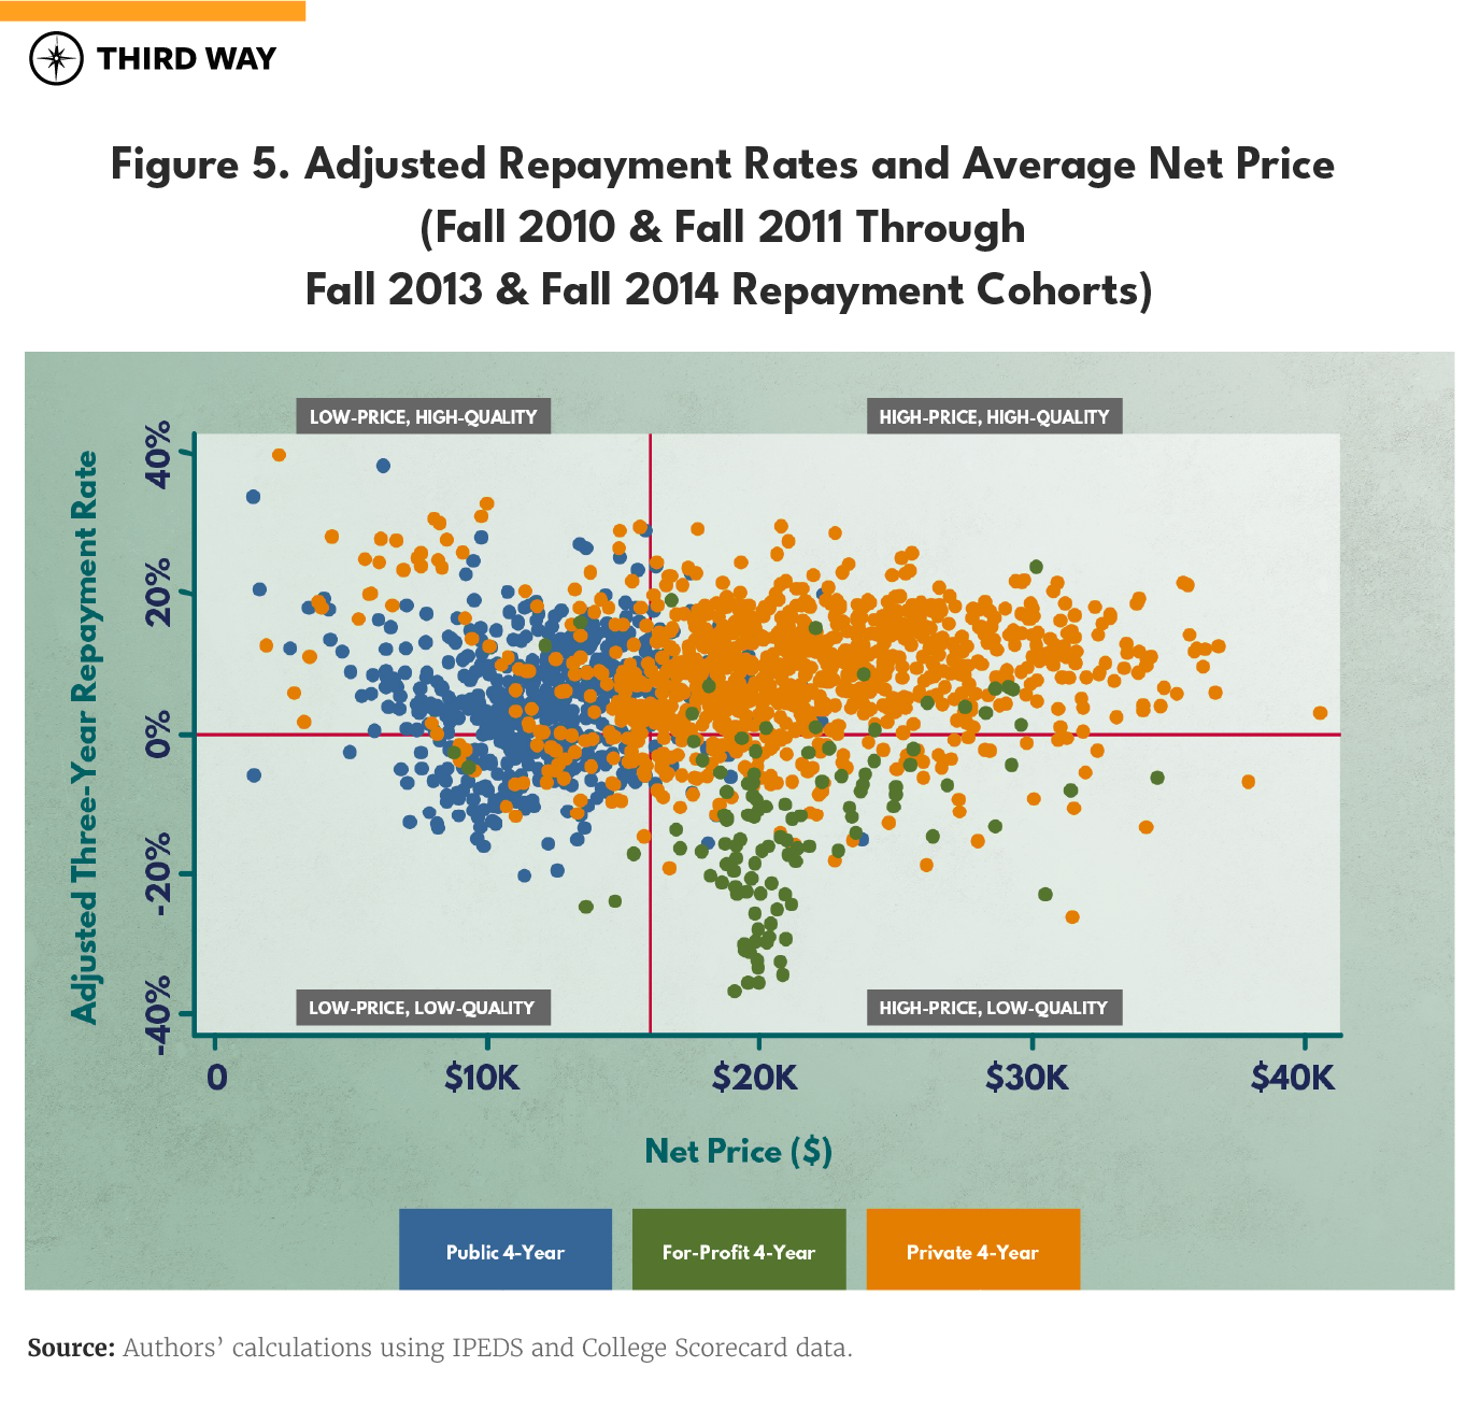
Figure 5 provides visual evidence to outline the specific institution types in each of the abovementioned categories and includes 531 public four-year institutions, 928 private non-profit four-year institutions, and 114 for-profit four-year institutions. These may include affiliated campuses or independent institutions within larger systems, and such systems are most prevalent among for-profits. Because of this, four-year schools in Figure 5 represent 504 unique public four-year institutions or systems, 906 unique private non-profit four-year institutions or systems, and only 50 unique for-profit four-year institutions or systems.
The four-year institutions depicted in Figure 5 are distributed across the four quadrants according to their relative prices and student loan repayment outcomes. So, what would we want to see in Figure 5? In an ideal system, all institution types would be distributed equally across the four quadrants, representing a relatively even distribution of institutions providing quality education at a relatively affordable price point. Here’s what the actual distribution shows:
- Most public four-year colleges (61.8%) are low-price, high-quality institutions. Concerningly, the next largest subset (27.9%) of public four-year institutions are low-price and low-quality; while 7.9% are high-price and high-quality and only 2.5% are high-price and low-quality institutions.
- Among private non-profit four-year institutions, 71.8% are high-price and high-quality, 11.9% are high-price and low-quality, 11.8% are low-price and high-quality, and just 4.6% are low-price and low-quality.
- In contrast, roughly four out of five for-profit four-year colleges (79.8%) are high-price, low-quality institutions. In this sector, 14.0% are high-price and high-quality, 4.4% are low-price and low-quality, and only 1.8% are low-price, high-quality institutions.9
The lower-right quadrant of Figure 5 shows the worst-offending institutions—the overwhelming majority of which are for-profit institutions—that not only charged higher-than-average net prices but also left a larger share of their students unable to repay their student loans. This point is especially problematic given what our prior analyses revealed about underserved students’ enrollment trends at for-profit institutions in past economic downturns. Following the Great Recession, the number of Black full-time equivalent (FTE) students and Pell Grant-receiving FTE students more than doubled at for-profit four-year institutions. The proportion of Black or Hispanic students at high-price, low-quality institutions was 43.9% higher relative to the proportion of Black or Hispanic students at all other institutions, and the proportion of low-income students at high-price, low-quality institutions was 23% higher when compared to the share of low-income students at other institution types. This should raise significant concern for policymakers and stakeholders invested in equity in higher education.
The Role of Instructional Spending in Outcomes
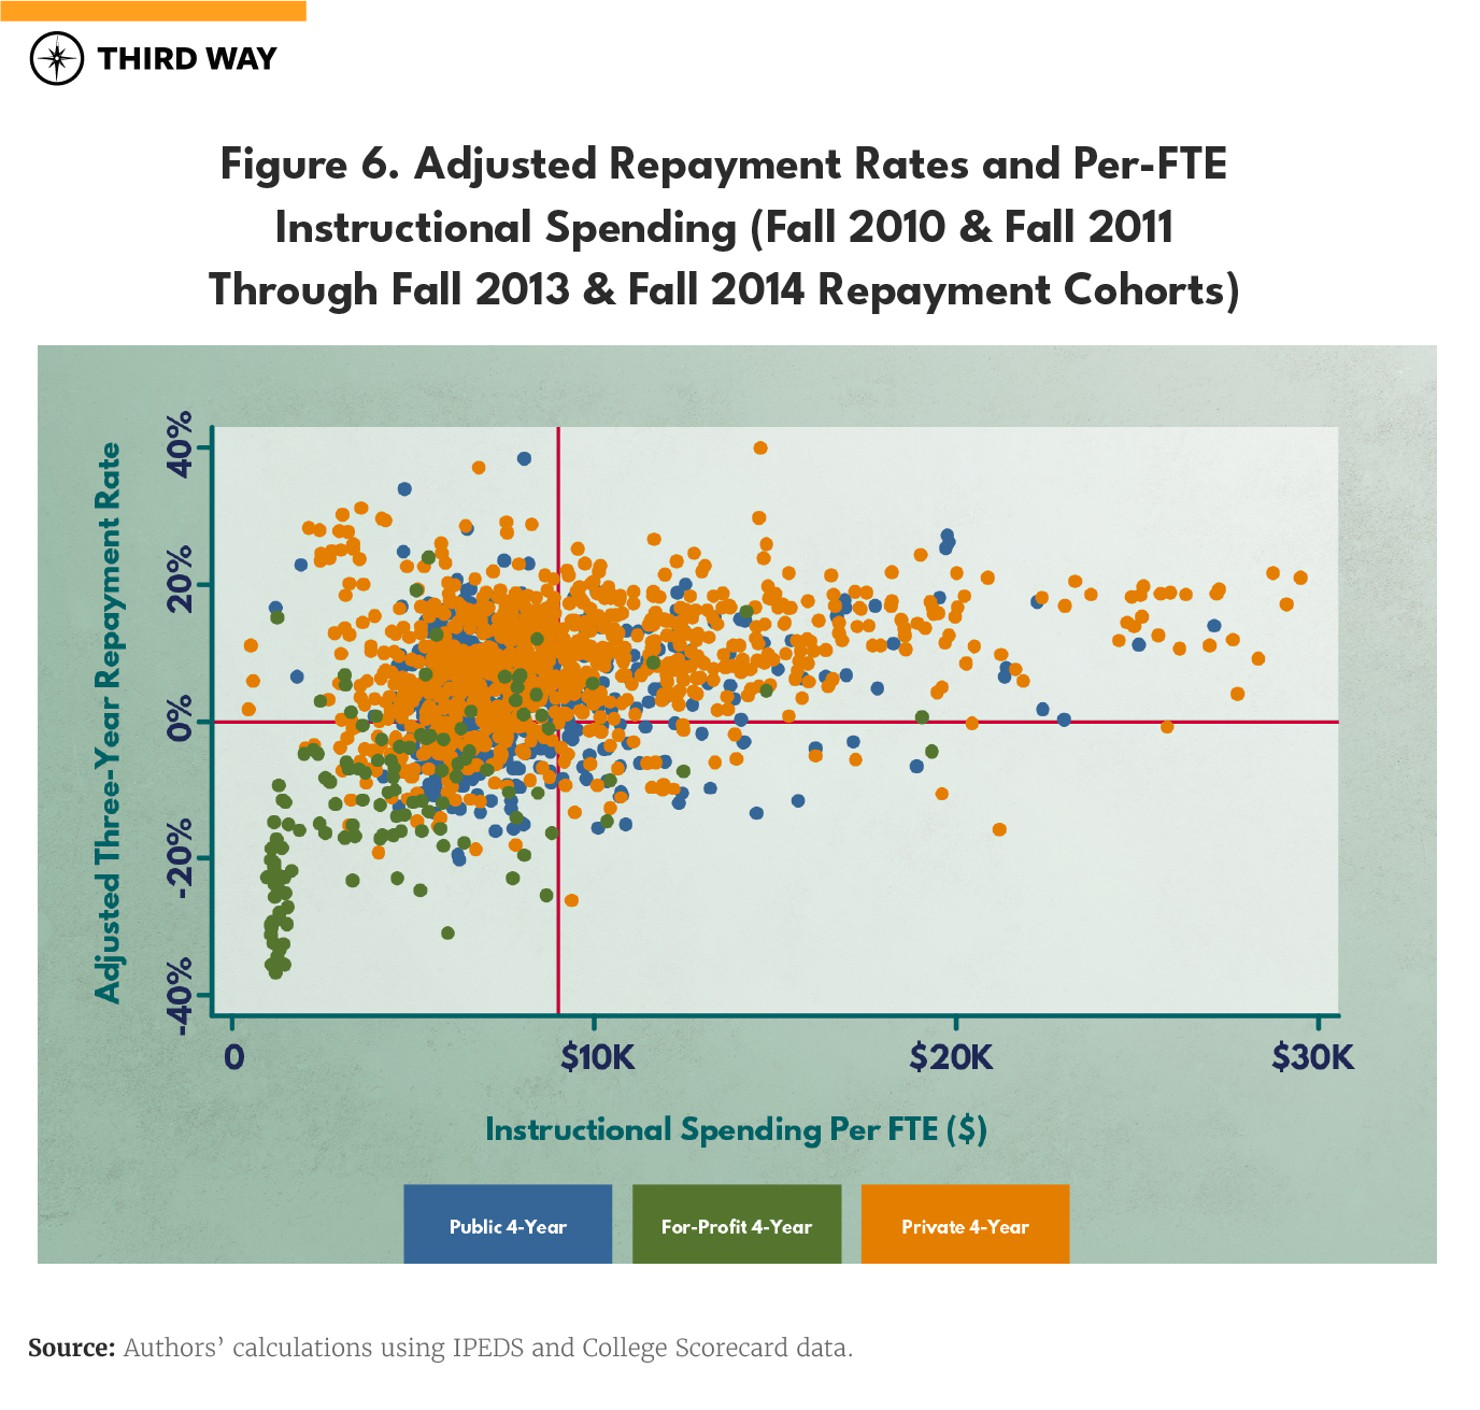
Figure 6 explores a potential mechanism driving the poor outcomes of high-price, low-quality (HPLQ) institutions: instructional spending per FTE student. Colleges and universities report instructional expenditures, including salaries and benefits, to IPEDS for numerous types of instruction: general academic instruction, vocational or technical instruction, community education (non-credit), and preparatory or remedial instruction.10 These spending data can strengthen our understanding of how institutions are investing resources in educating their students, as increased spending on instruction has been linked to better student outcomes.
Yet despite charging higher-than-average net prices, for-profit colleges do not typically invest in instructional spending in meaningful ways. Instead, for-profit institutions spend a larger share of their resources on advertising rather than on providing high-quality instruction. For-profit institutions account for roughly 40% of all spending on higher education advertising despite enrolling only about 6% of college students.11 The institutions in the bottom-left quadrant of Figure 6—many of which are identified as HPLQ institutions—spent an average of $5,510 on instructional spending per FTE student, whereas the institutions in the other three quadrants spent nearly double that amount, averaging $10,215 on instructional spending per FTE student.
For-profit institutions account for roughly 40% of all spending on higher education advertising despite enrolling only about 6% of college students.
For vulnerable college students, the only outcome worse than attending a HPLQ institution is to attend a HPLQ institution that closes suddenly. Sudden closures leave a disproportionate number of students of color and low-income students with crippling student loan debt and nowhere to complete their program of study.12 Nearly 22% of HPLQ four-year institutions closed by 2018, in contrast with only 1.9% of four-year institutions in the other three quadrants.13 Figure 7 shows that over 48% of for-profit four-year institutions identified as HPLQs closed by 2018, with over 21% of for-profit four-year institutions located in the other three quadrants closing by 2018.14 A majority of closures of for-profit four-year institutions in Figure 7 (22 institutions) reflect closures of University of Phoenix’s main campus locations in 2012, which created disruption by requiring students to switch from attending a physical campus to an exclusively online degree program or switch to another physical campus location if one was within commuting distance.15 Given that Figure 7 focuses solely on closures following the Great Recession, this analysis provides important context for considering institutional responses, particularly among for-profit institutions, to the financial uncertainty associated with a recessionary period.
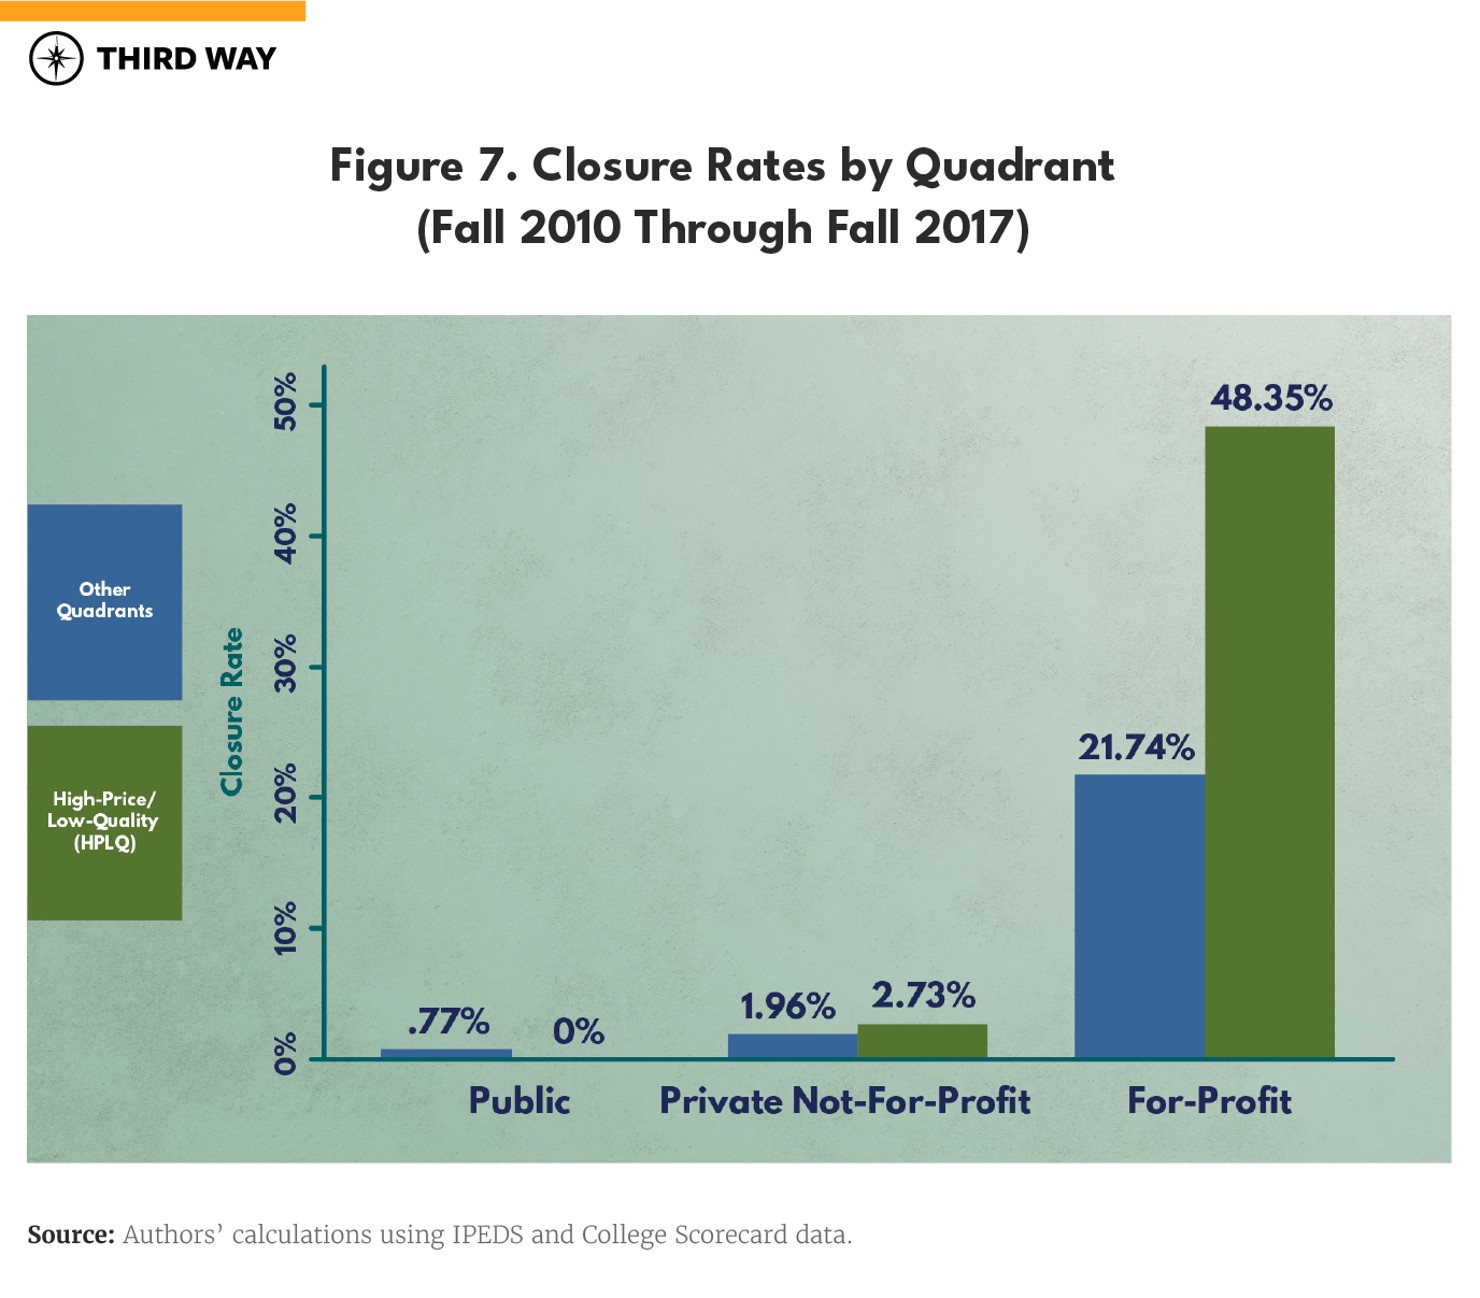
Nearly 22% of HPLQ four-year institutions closed by 2018, in contrast with only 1.9% of four-year institutions in the other three quadrants
Policy Implications
Future policy conversations surrounding how to prioritize return on investment and protect underserved students in higher education should be divided into two areas of focus—transparency and accountability. The new classification system we propose offers the federal government a method for implementing transparency-related regulations. Formally designating high-price, low-quality institutions through the provision of an HPLQ flag in the College Scorecard and Free Application for Federal Student Aid (FAFSA) would serve to ensure that prospective students can identify HPLQ institutions that charge a high premium for below-average student outcomes.
Further IPEDS reforms would also lead to improved transparency by giving researchers and policymakers the types of disaggregated data they need to be able to better understand the consequences of institutional spending decisions. As shown in Figure 6, a large number of for-profit four-year institutions are classified as HPLQs and fail to invest in instructional spending in meaningful ways. Although the majority of for-profit institutions receive more than 70% of their total revenue from public funding, those funds are spent disproportionately on advertising and marketing rather than instructional spending and student success initiatives.16 Importantly, the share of for-profit institutions that received more than 70% of total revenue from public funds increased substantially following the Great Recession—from 43.1% in Fall 2007 to 62.5% by Spring 2010. To better understand how institutions spend public funds and the implications of those financial decisions, researchers and policymakers need an accurate categorization of institutional expenditures. As an example, IPEDS currently reports advertising expenditures under the category of “student services” and fails to disaggregate important student success initiatives from advertising and marketing campaigns.17 To gain a clearer picture of the consequences of failing to invest in educational quality and protect vulnerable students, researchers and policymakers need to be able to distinguish between institutional investments that benefit students and those that do not.
In addition to the transparency-related regulations and amendments described above, this new classification system could be used to enhance federal accountability efforts. Numerous decisions by the Department of Education under the Trump Administration have loosened or repealed previous accountability efforts to prioritize return on investment and protect students from institutions or degree programs that leave them in a worse position than they were in before entering higher education, including the repeal of the Gainful Employment rule designed to close down career training programs that leave graduates with more debt than they can earn.18 When the majority of a college or university’s students are left in precarious financial positions and unable to pay back their student loans, the institution offering these HPLQ degree programs should be held accountable.
Specifically, the federal government could use the classification system highlighted here to determine Title IV aid eligibility by flagging colleges or universities classified as an HPLQ institution and eventually revoking access to Title IV aid if outcomes among HPLQs do not improve over time. The federal government could also consider providing capacity-building grants to institutions in the other three categories in an effort to increase the number of colleges and universities offering students access to a low-price, high-quality education. Our analysis identifies a potential mechanism of these poor outcomes—instructional spending per FTE student—and finds substantial overlap between institutions not investing in instruction and those categorized as HPLQ institutions. This new classification system provides a sector-neutral approach to identifying overpriced, low-quality institutions that do not offer students a reasonable return on their investment.
Given the high number of public colleges and universities in the low-price, high-quality quadrant, federal policymakers should consider these data and provide targeted support to public institutions to offset the forthcoming cuts to state funding for higher education. State revenues have already begun to decline for the first time since the Great Recession, and the worst cuts to state higher education funding have yet to come.19 For underserved students, public colleges and universities offer an affordable pathway to climb the socioeconomic ladder by allowing their students to avoid HPLQ institutions, keep educational debt relatively low, and pay back their student loans. Because for-profit students are typically forced to take out significantly larger loans than students at public institutions, the federal government should prioritize ensuring public institutions receive adequate support to educate students in the midst of the economic downturn caused by the COVID-19 pandemic.
Conclusion
Higher education can allow low-income students and students of color to alter the trajectory of their lives, but the public good provided by a college or university is contingent on its students being able to earn a livable wage and repay their student loan debt. Taxpayers, like students, have the right to know if certain taxpayer-subsidized institutions and degree programs provide high-price, low-quality offerings that are unlikely to see a return on their investment in higher education. Yet over the past few years, the Trump Administration has weakened accountability efforts designed to ensure that colleges and universities are responsible stewards of public funds and thereby enabled low-performing institutions to leave vulnerable students in untenable financial situations.
Although the past several months have been extremely challenging for the higher education sector, the coming years are likely to be even more difficult from an economic perspective. The new classification system proposed here can serve as a mechanism to promote a shared belief across higher education stakeholders that institutions must prioritize return on investment and protect underserved students, particularly during the upcoming period of economic uncertainty following the COVID-19 pandemic.
