Report Published July 25, 2022 · 29 minute read
Reducing the Red Tape around Supply Chains
Takeaways
Red tape throughout our supply chains isn’t a new problem, and countries have been working to ease the movement of goods and services for generations. These efforts, called trade facilitation, work to cut red tape through one of the following three ways: 1. Simplify border processes, 2. Embrace digitization, and 3. Focus on speed and security.
Reducing the red tape on trade has the potential to significantly reduce time and money needed to keep supply chains moving. New analysis finds that with more global trade facilitation measures:
- The United States could save $88 billion in export costs.
- The United States could gain 987,000 jobs.
- Every state in the nation would see job growth.
In early November, a record high 111 container ships were stuck off California’s coastline waiting to dock.1 Trains have been backed up for 25 miles trying to access a Chicago railyard.2 And 22% of agriculture export sales are being lost due to supply chain issues.3 The COVID pandemic and the subsequent economic crisis have wreaked havoc among global supply chains. But moving goods throughout the globe was difficult even before COVID. For generations, supply chains have been vulnerable to factors that slow shipments at borders, impacting the speed that businesses can reach their customers.
This isn’t just an American problem. In Vietnam, shoe factories were forced to reduce output because workers stayed home out of fear of COVID-19.4 The Port of Rotterdam, Europe’s busiest port, is experiencing problems and delays “at every handover point in the supply chain” and suffering from a shortage of pallets and truck drivers.5 In June 2021, Brazilian automakers reached a “production ceiling” after only the first five months of the year, below pre-pandemic levels, due to a semiconductor shortage.6
As the complexity around importing and exporting products has increased, there have been various efforts to ease the movement of goods. This effort, called trade facilitation, has been broadly embraced by the United States and many other countries, but it is far from ubiquitous around the world. But what if that changed? What would the impact be if more countries embraced simplified customs processes and made trading across borders easier? Based on new economic analysis from Trade Partnership Worldwide, the impact would be enormous: 987,000 new US jobs would be created and $88 billion would be saved in US export costs as a result. Notably, women would see 51% of the jobs created and small businesses would see 79% of the jobs.
In this report, we unpack issues facing shippers, especially small businesses with limited resources who are disproportionately impacted by costs at borders. We then examine what trade facilitation entails and how it impacts supply chains. Finally, we explore new data from Trade Partnership Worldwide, examining the cost savings and jobs impact at the national level as well as state-by-state and among key demographics.
The Problem: The Red Tape on Shipping
Shipping goods and services can be incredibly challenging—especially for small businesses grappling with how to start, run, and grow their business among myriad other issues.
Kavita Shukla, the Founder and CEO of The FRESHGLOW Co, started out marketing her invention FreshPaper—a patented paper insert infused with spices that keeps fruits and vegetables fresh for up to four times longer—at her local farmers’ market in Massachusetts. When she set up her online store for the first time, she went global “completely by accident,” enabling international sales on her e-commerce platform without even realizing it. When orders began to roll in from Europe, Africa, and Latin America, she found herself asking her intern to search to find out the most basic requirements for customs procedures. “At first,” Shukla recalls, “we went to the post office and filled out customs duties by hand. We spent about an hour for every two customs forms at the beginning.”7
Shukla is far from alone in dealing with these challenges. Dana Donofree, an entrepreneur in Philadelphia, founded AnaOno to create comfortable clothing for women with breast cancer. When Dana first launched the startup, she was surprised by the international demand that she received. “I quickly learned that our international access is so important to getting solutions to customers around the world, and that borders shouldn’t stop us from doing just that,” Dana said. Throughout this global journey, however, Dana has faced several challenges maneuvering regulatory red tape. “Navigating customs is very difficult for small businesses. Especially if you are new to this space, it can be very overwhelming,” she said. “You have your [Harmonized Tariff Schedule] identification codes, but what is not answered is everyone’s duty rates into every other country. That can change and shift depending on where the goods are made and who is exporting them. And it’s even more complicated to convey that to consumers,” Dana explained.8
The red tape around global supply chains can be expensive, complicated, and risky. For small, medium, and micro businesses without a compliance department, the barrier to entry can be too high, which keeps them from enjoying all the benefits of international customers, diversifying their customer base, and getting their goods into new and developing markets. Shipment seizures are typical of “at the border” issues. These can include delays, seizures, and failed inspections. However, “beyond the border” issues can be just as costly and intimidating to would-be exporters and importers. These can include paperwork delays, requirements for physical paper filings instead of digital submissions, and unscientific or opaque regulatory systems, among others. Altogether, the red tape on trade and our supply chains deters businesses from entering new markets and goods moving easily across borders.
The Solution: Cutting Red Tape
Red tape throughout our supply chains isn’t a new problem, and countries have been working to ease the movement of goods and services for decades. This effort, called trade facilitation, has been pursued in the United States and by our trading partners through both bilateral and multilateral trade agreements as well as domestic legislation. For example:
- In 2020, the United States-Mexico-Canada Agreement (USMCA) entered into force in place of the antiquated North America Free Trade Agreement (NAFTA). For the first time in a trade agreement, USMCA recognized the need to streamline, simplify, and cut red tape to increase the speed at the border, while keeping costs for exporters low. The Customs and Trade Facilitation Chapter eased international trade for small- and medium-sized enterprises (SMEs) by requiring online publication of laws, regulations, contact information, tariffs, taxes and other fees, as well as documentation required for customs clearance and procedures to correct errors.9 USMCA also made commitments to expedite the clearance of low-value shipments and limit the number of customs formalities for shipments under $2,500.
- The Trade Facilitation and Trade Enforcement Act (TFTEA) of 2015 was signed into law by President Barack Obama in February 2016 to, in part, deal with increasingly complex supply chains. Among many provisions, this law would improve automated systems used to track goods, simplify the refund of taxes and fees, and raise the threshold on what low-value shipments qualify for reduced clearance procedures and taxes. Only one year after TFTEA came into force, U.S. Customs and Border Protection (CBP) highlighted the trade facilitation benefits that small businesses and individual consumers experienced as a result of the law, including: (1) the increase in the de minimis threshold from $200 to $800; (2) the timely resolution of trade compliance issues offered by CBP’s Centers of Excellence and Expertise, which were formally recognized by the law; and (3) extended funding to complete the development and implementation of the Automated Commercial Environment (ACE), which transmits private sector import-export data to 47 partner government agencies and eliminates forms.10
- In 2013, the World Trade Organization (WTO) finalized its Trade Facilitation Agreement (TFA). The TFA covered a broad range of topics, from expediting certain types of goods, to moving toward electronic payments, to making procedures more predictable for shippers.11 In 2017, the agreement came into force. Developed countries committed to implementing the agreement at that time; however, developing countries were given more time to comply. At the time of agreement, the WTO estimated that full implementation of the TFA could reduce trade costs by an average of 14.3% and boost global trade by up to $1 trillion per year.12
But what is trade facilitation, and how do these efforts specifically cut back the red tape that hinders supply chains and the movement of goods across the globe? Simply put, trade facilitation works to cut red tape through one of the following three ways, each of which is discussed more below:
- Simplify border processes
- Embrace digitization
- Focus on speed and security
1. Simplify border processes
Far too often, foreign customs procedures are unnecessarily opaque and hard for a small business owner to follow. Trade facilitation tries to make the overall process of moving goods easier for shippers, especially small ones. It is especially important for US exporters, as most of these barriers are maintained by other countries. This is accomplished through a number of different tactics.
First, trade facilitation makes sure rules, fees, and procedures are easily accessible and predictable. Shippers need to know how to get their goods across a border—from how much it will cost to the rules they must follow. Ensuring those regulations are transparent and easy to understand is key to reducing costs and time. In more advanced trade facilitation efforts, such as those codified in the USMCA, governments are encouraged not only to clearly publish new regulations, but to also allow traders to share input on them before they’re finalized.
Once rules are online and transparent, penalties for not following the rules should be clear. If a shipper is accused of not following the rules, there should be a clear process to review and appeal the determination. This makes sure bad actors are penalized, while others have confidence their products will get to their customers.
Finally, trade facilitation typically has a process for time-sensitive shipments to get across borders more easily. For example, the USMCA included new trade facilitation policies regarding these “express shipments,” such as requiring countries to allow express shippers to submit and process required customs information before the shipment actually arrives, and to do so using a single document, such as a manifest. This built upon earlier efforts through the WTO to provide expedited customs treatment upon arrival for small and express shipments as well as to limit assessed fees to the approximate cost of services rendered.
2. Embrace digitization
Technology has the ability to better connect American businesses with markets throughout the globe. Unfortunately, many countries aren’t leveraging the opportunity to use digital tools to help supply chains. For example, the International Chamber of Commerce estimates that 64 of 139 countries do not accept or electronically process data required for release of shipments in advance of their arrival.13 Trade facilitation tries to help by pushing more regulations and processes online.
A “single window” system has long been a core component of any substantive trade facilitation efforts. Single window establishes a single point of entry and digital submission point for electronic forms and other data for businesses looking to import or export goods into a country. Newer iterations of the single window allow for digital submissions of necessary documents and improved electronic communication and coordination between government agencies.
The American system for single window, known as the Automated Commercial Environment, has automated 269 paper forms through US Customs and Border Protection and 48 partner agencies. According to CBP, its creation and implementation saved the trading community 775,000 hours of paperwork processing and helped realize $1.75 billion in savings for federal government agencies.14 Thanks to the implementation of the ACE Single Window and other trade facilitation features, the time cost of exporting from the United States has been lowered to an average of four hours.15
In addition to a single window, trade facilitation works to ensure the acceptance of digital payments at the border. In addition to being far more convenient for shippers, this limits opportunities for bribery and other corruption. Without the ability to submit digital payments, traders are required to exchange for local currency and, in some instances, pay a cash deposit on an import bond, factors which slow down trade or discourage it entirely. Greater transparency, automation, and digitization have allowed for significant progress elsewhere in reducing the discretionary power of customs officials and the corruption that comes with it.
3. Focus on speed and security
Once the process is easier to follow and as much as possible is digitized, it’s essential to keep goods moving. The last thing any business owner wants is for a delivery promised at a certain time to be delayed due to red tape and bureaucracy.
Trade facilitation works to speed entry through simplified procedures for the release of goods. For example, USMCA states that goods cannot be delayed after requirements and procedures have been met. To ensure faster movement, countries must allow documents to arrive and be processed in advance of a shipment to expedite the movement of goods. And if a country doesn’t release a shipment, it needs to clearly communicate the reason why.
To help navigate supply chains and international shipping, some companies opt to use customs brokers who are for-hire experts in customs regulations. These individuals can help to navigate bureaucratic processes at the border and provide in-country intelligence, but they can also add to the cost of doing business. The TFA included language to ensure that WTO member countries don’t pass new requirements for using customs brokers in the future. Most countries allow importers to choose whether to engage customs brokers, with some exceptions in the Caribbean and Africa where their use is still mandated. The USMCA went a step further in easing this burden on businesses, establishing that importers in the three signatory countries do not have to contract with a customs broker moving forward.
Governments have to weigh competing pressures as they regulate the movement of goods through global supply chains. They must balance the need for moving shipments quickly and efficiently with the need to ensure regulations are being met and risk is minimized. Trade facilitation practices help with this dynamic, ensuring goods are prioritized as they move through supply chains.
The concept of “de minimis” in trade refers to low-value goods that can enter the country duty free. It was established by Congress through the Tariff Act of 1930 and raised to the current level of $800 in TFTEA, which went into effect in 2016. Additionally, the law exempted low-value shipments from needing to file Harmonized Tariff System (HTS) codes and other customs documentation, alleviating a significant burden for low-value traders. Congress also urged the United States Trade Representative to encourage other countries to establish meaningful de minimis values for express and postal shipments. Thus, TFTEA’s raising of the de minimis threshold from $200 to $800 was intended to ease the administrative burden on CBP, facilitate trade for importers, and encourage foreign governments to raise their de minimis thresholds for the benefit of American exports.
As companies engage directly with customers around the world, de minimis thresholds become even more important, especially for SMEs. Reduced logistics costs improve the bottom line of American SMEs across industries which import low-value components for assembly and value-added manufacturing operations. When customers want to return their items—for example, because the clothes they purchased don’t fit—businesses are often forced to foot the bill for the customs duties applied by their own countries, in addition to the duties they already paid the country into which they exported. This burdensome government red tape frequently necessitates completion of cumbersome forms and the hiring of a customs broker, an additional expense that can discourage SMEs from exporting altogether.
Informal entry is another mode of entry that reduces red tape for the importation of goods valued above the de minimis threshold but below the threshold for formal entry. In the United States, goods valued between $800 and $2500 are eligible for informal entry, which means they do not require the posting of a Customs bond and are liquidated at the time of release. Like de minimis, informal entry particularly benefits SMEs because it simplifies customs processes to the extent that in most cases, importers can clear their shipments without hiring a customs broker.
Some countries are also using risk management programs to assess threat levels of imports and exports to coordinate more appropriate physical inspections. By developing risk profiles based on country of origin, traders’ track records, and other factors, countries can reduce clearance times by focusing inspections on high-risk goods while simplifying movement of low-risk ones.
India reported its first case of COVID-19 in January 2020 and then implemented one of the most stringent lockdowns to contain COVID-19 in the world. This action curtailed all economic activities including transportation of goods, except those deemed essential like food and medical supplies.16 The country recognized early the need to coordinate its public health response with efforts to ease customs bottlenecks at the border.
India took a series of steps to facilitate essential trade during this time. The Indian government advised customs field offices to waive late fees for delayed filing of import declarations. The government relaxed a requirement to submit bonds prescribed for various procedures for limited circumstances. Additionally, the Indian National Customs Portal was employed to avoid trade disruptions, facilitating faster clearances and flow of key trade information. An online form was launched to allow traders to identify any obstacles. And the application of these types of risk management and trade facilitation measures focused border interventions (documentary requirements, inspections, technical assessments, etc.) on high-risk commodities while reducing border interventions on low-risk items.
This expedited India’s access to critically-needed commodities and reduced burdens on trade.17
The Impact of Reducing Red Tape
Reducing the red tape on trade has the potential to significantly reduce time and money needed to keep supply chains moving. This is particularly important for US exporters, as practices here at home (affecting US imports) are already among the most efficient. And, based on new analysis from Trade Partnership Worldwide, it could have an outsized impact on jobs here in the United States.
To assess the economic impact, Trade Partnership Worldwide followed a two-step process to estimate the US employment impacts from moving toward more global trade facilitation. First, they measured the size of the red tape hampering trade. Second, they used a general equilibrium model to assess the economy-wide impacts of lowering those costs to best practice levels. (A detailed methodology can be found at the end of this report.)
They found:
1. The United States could save $88 billion in export costs.
Different countries have different amounts of red tape that gum up supply chains and waste time and money for shippers. Trade Partnership Worldwide measured the amount of red tape in each country by comparing costs for domestic and international shippers. They then assessed what the cost savings would be if a country adopted trade facilitation best practices comparable to those of the United States.
For some countries that have already reduced a lot of red tape—like South Korea, Australia, and Canada—the savings for US exporters are small or nonexistent. But for countries with layers of red tape, cost savings would be impressive. The chart below shows regions across the globe and selected partner countries, the amount of US exports to those countries in 2019, the percent savings that would be seen if a country utilized trade facilitation best practices, and the cost savings to US exporters from that.
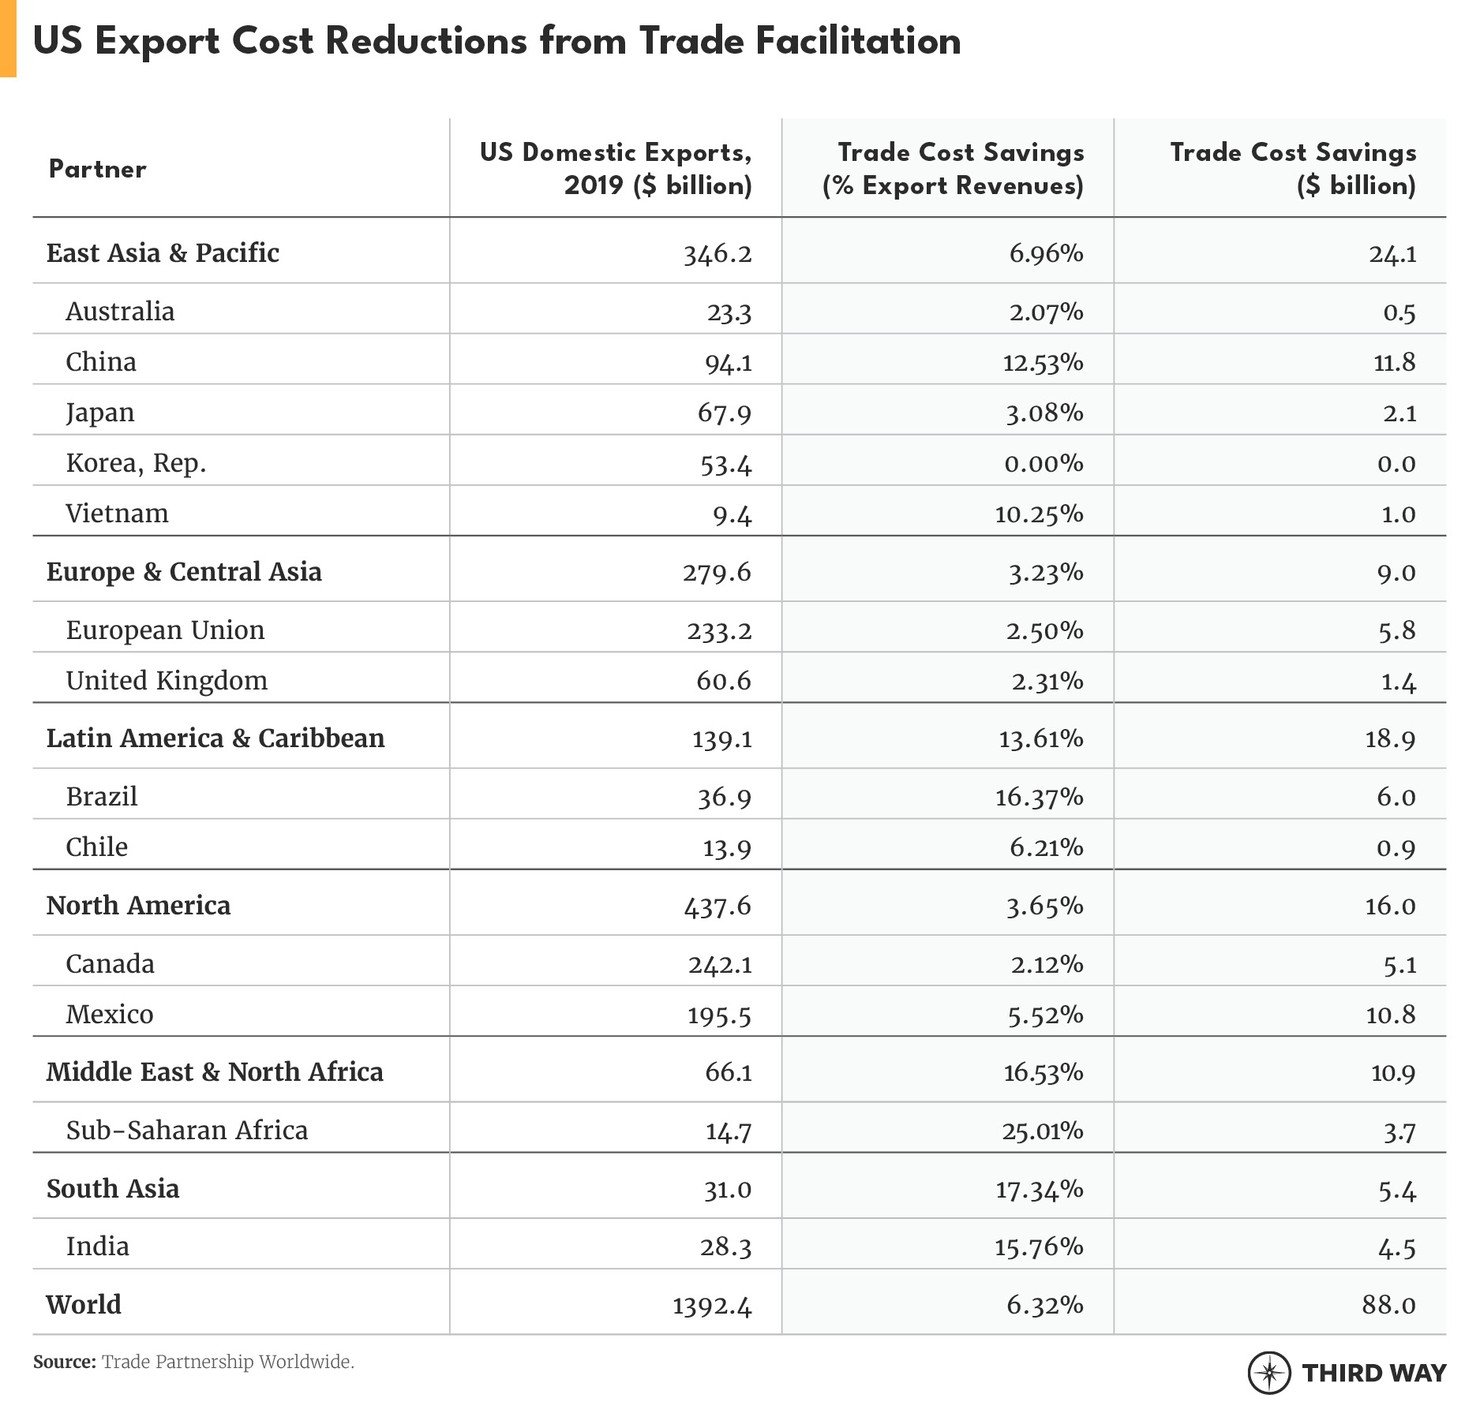
As a comparison, US exports faced tariff costs in 2019 of about 2.64%, adding $36.8 billion to their cost. Therefore, trade facilitation could save almost 2 ½ times what exporters are facing in tariffs.
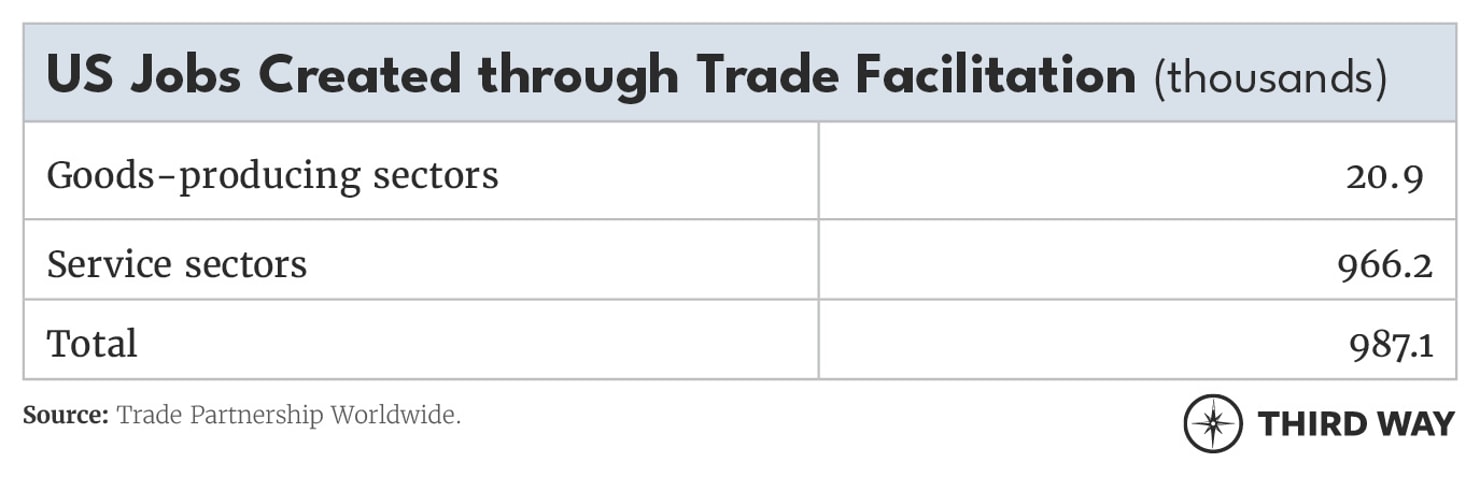
2. The United States could gain 987,000 jobs.
Embracing trade facilitation measures wouldn’t just reduce red tape and save money—it would also create a sizeable number of jobs in the United States. This happens because, as exports increase, US production of both goods and services expands in response, and other economic impacts ripple through the economy. Trade Partnership Worldwide estimates that in the first 1-2 years after all countries implement rules and procedures comparable to those of the United States, the United States would see a total of 987,000 jobs created. There are a number of factors to consider when evaluating who would benefit from these jobs that are worth exploring.
First, the vast majority of jobs created would be in the service sector. Trade Partnership Worldwide broke down job gains by industry and found that while goods-producing industries would benefit, 97.9% of the jobs would accrue to the service sector. This is understandable given the importance of services to the US economy and to goods output as well since goods exports rely heavily on inputs from US services firms.
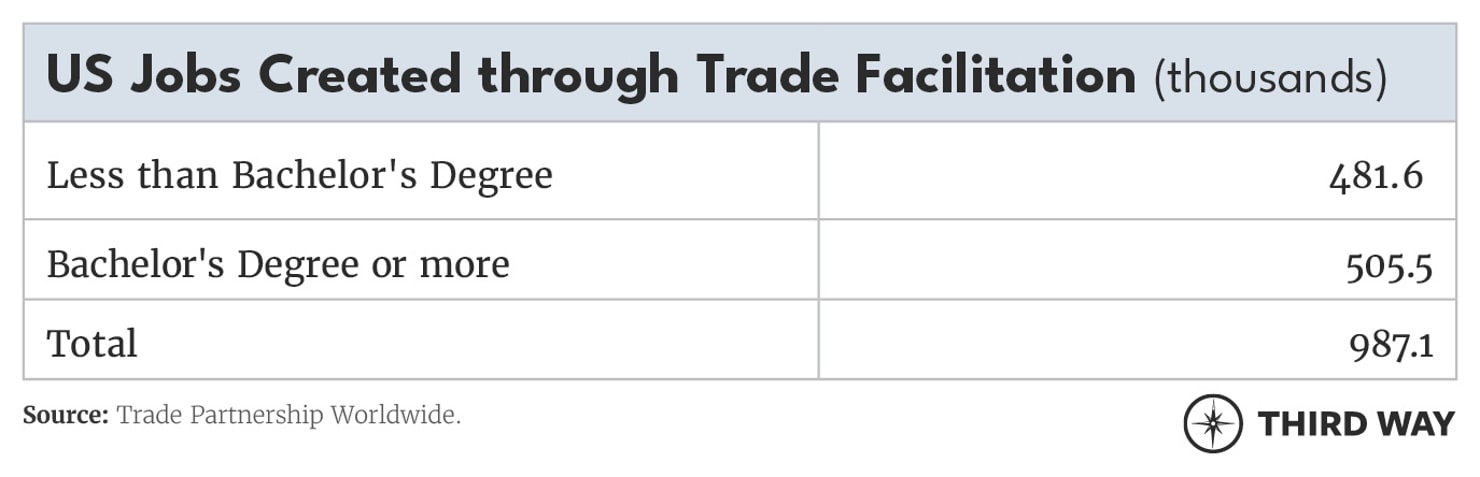
Second, workers without a bachelor’s degree would see about as many opportunities as workers with a bachelor’s degree or more. Trade Partnership Worldwide looked at job gains by educational attainment and found that jobs wouldn’t cluster among those with more education.
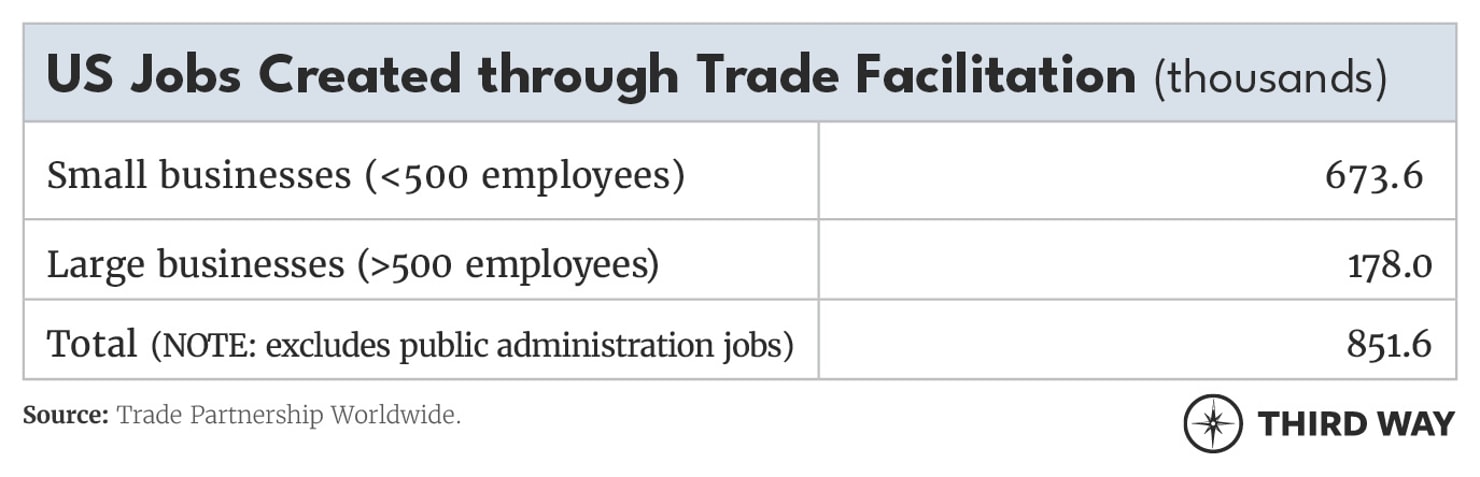
Third, small businesses would see 79% of the new jobs. When jobs are broken down by the size of the business that would see gains, small businesses (those with under 500 employees) would see the majority of new positions.
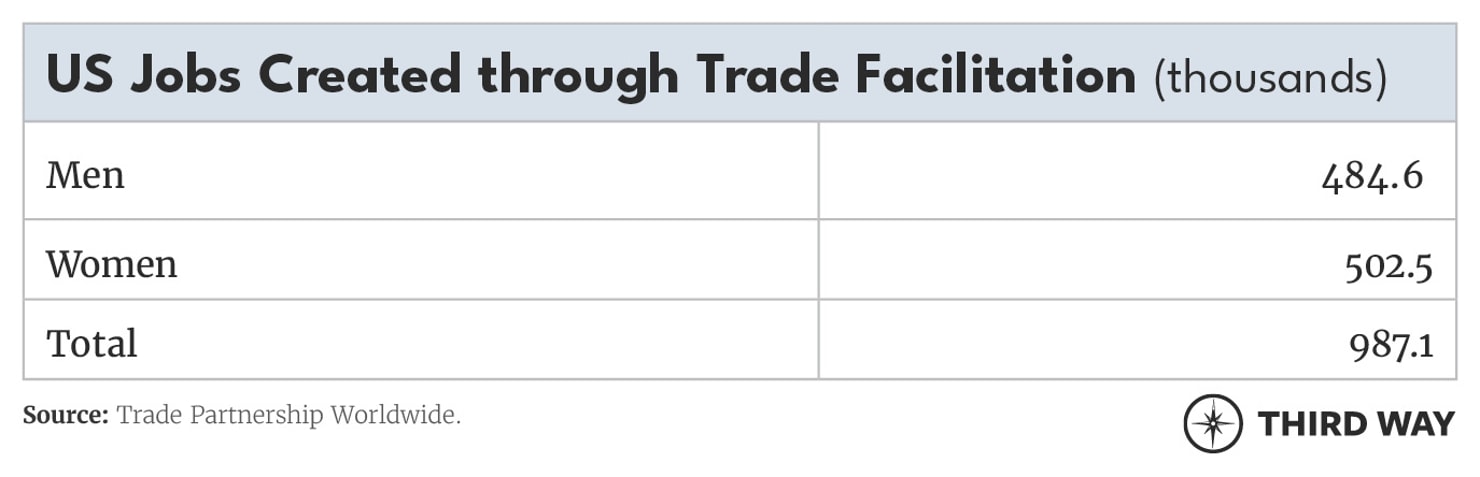
Finally, women would see slightly more new jobs than men.
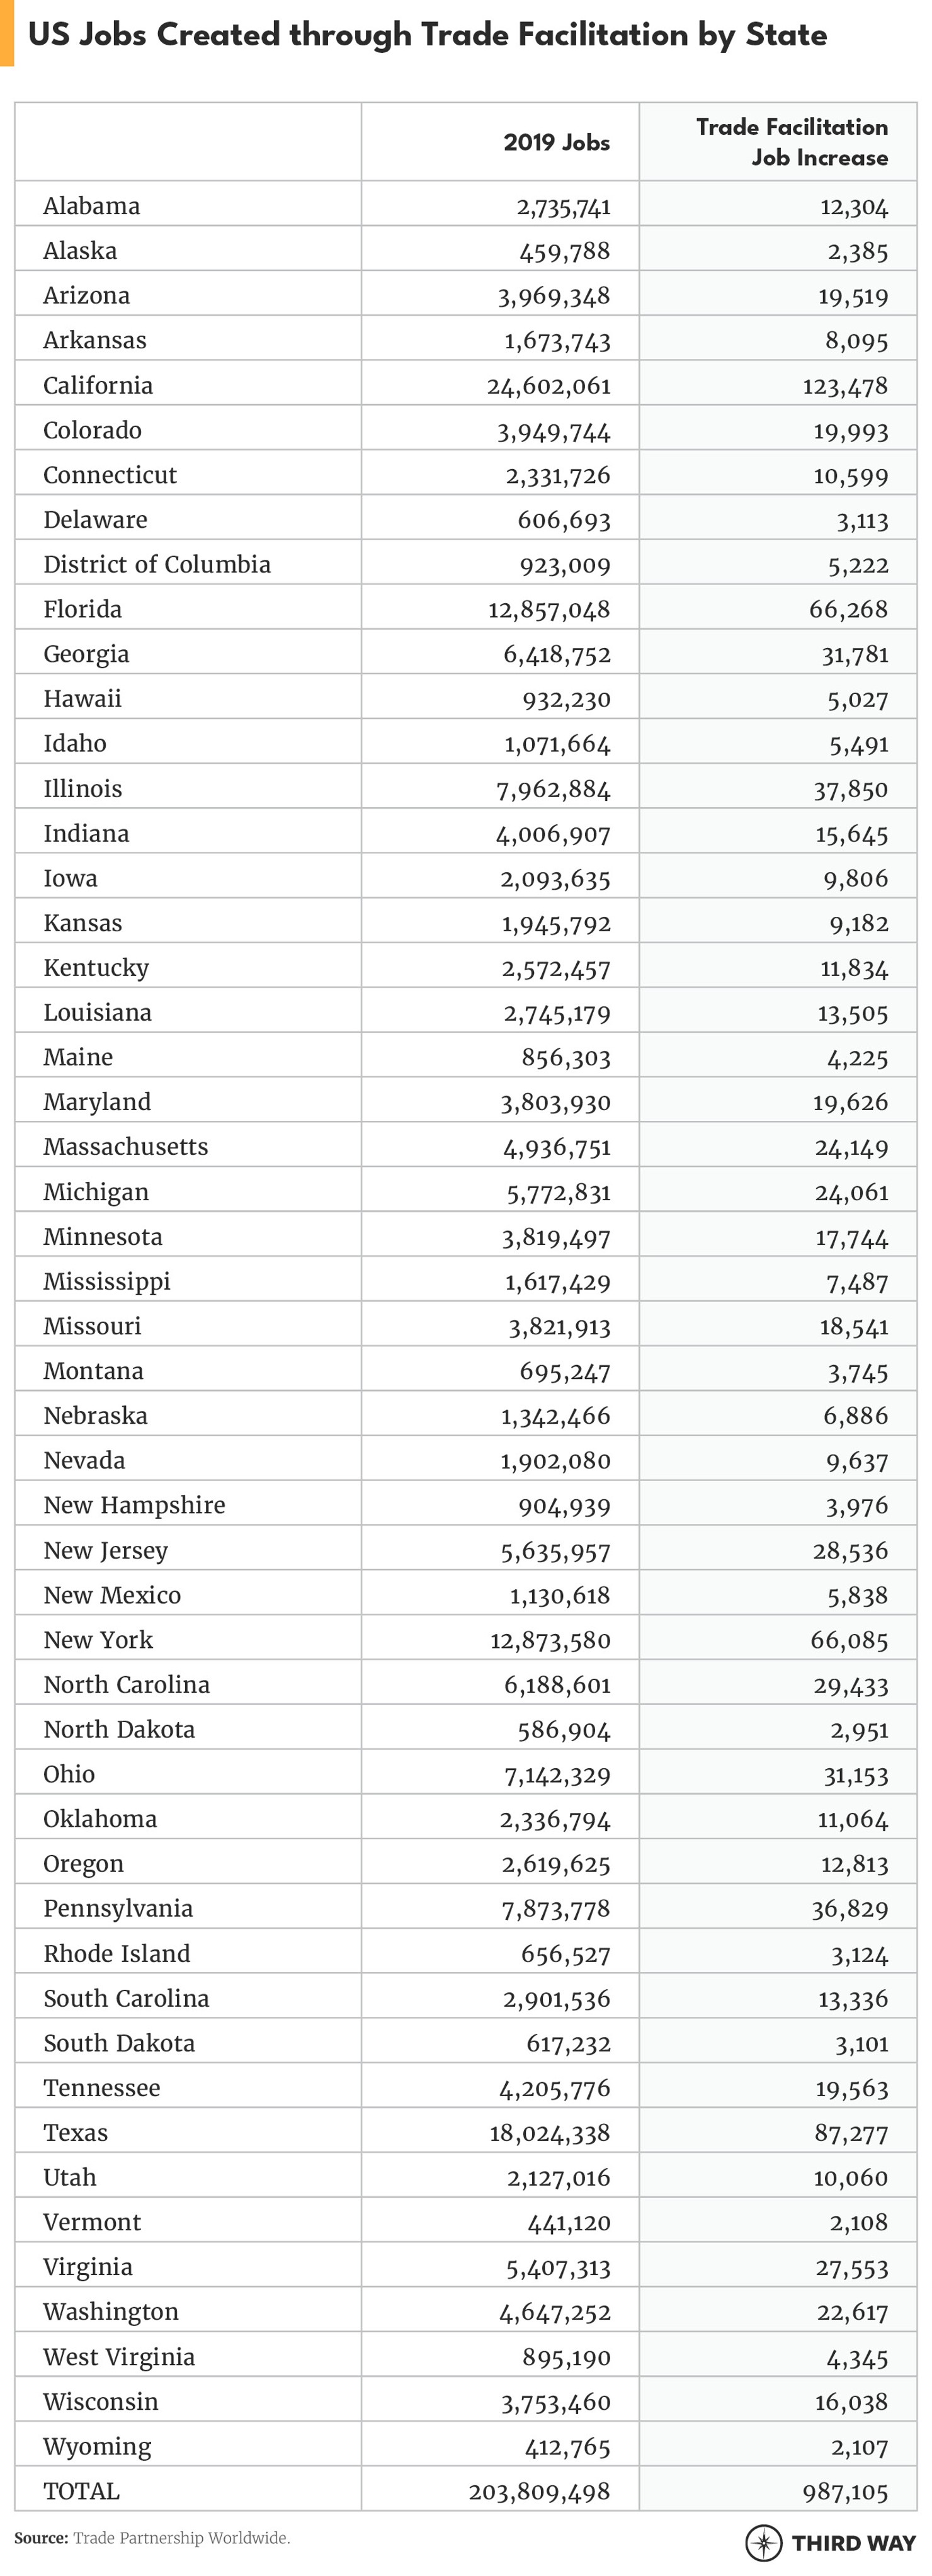
3. Every state in the nation would see job growth.
Trade Partnership Worldwide also broke down job growth by state and found that every state in the country, along with the District of Columbia, would see jobs added.
Conclusion
Current supply chain issues throughout the globe are having a profound impact on consumers, businesses, and governments. While there is no silver bullet to fix the myriad issues involved, there have been various efforts to ease the movement of goods for years. These trade facilitation initiatives have the potential to significantly reduce time and money needed to keep supply chains moving. Based on new economic analysis from Trade Partnership Worldwide, the impact for American workers would be enormous. The United States could gain 987,000 jobs. Every state in the nation would see job growth. And, overall, the United States could save $88 billion in export costs.
The United States has been the gold standard for trade facilitation measures and has continued to modernize rules and regulations around the movement of goods. As more products travel across borders—from personal protective equipment to produce and toys—the United States must continue to be a model for the rest of the world. There have been recent attempts here at home to put more red tape on trade, from lowering de minimis thresholds so more packages face bureaucratic hurdles to significantly boosting filing requirements on shipments. But policymakers must understand that more red tape on trade can have negative consequences for the American economy. The new economic analysis from Trade Partnership Worldwide shows the global impact of more countries fully embracing and implementing trade facilitation measures like those of the United States. Because of that, we must continue to lead and work with countries across the globe to reduce the red tape on trade.
Methodology
Trade Partnership Worldwide (TPW) followed a two-step process to estimate the US employment impacts of reductions in trade costs associated with reducing to “best practice levels” (defined here as US levels) the administrative and other similar barriers to trade currently maintained by US trading partners. First, TPW estimated the size of those trade costs. Second, TPW used a general equilibrium model to assess the economy-wide impacts of lowering those costs to best practice levels.
1. Trade Cost Estimation
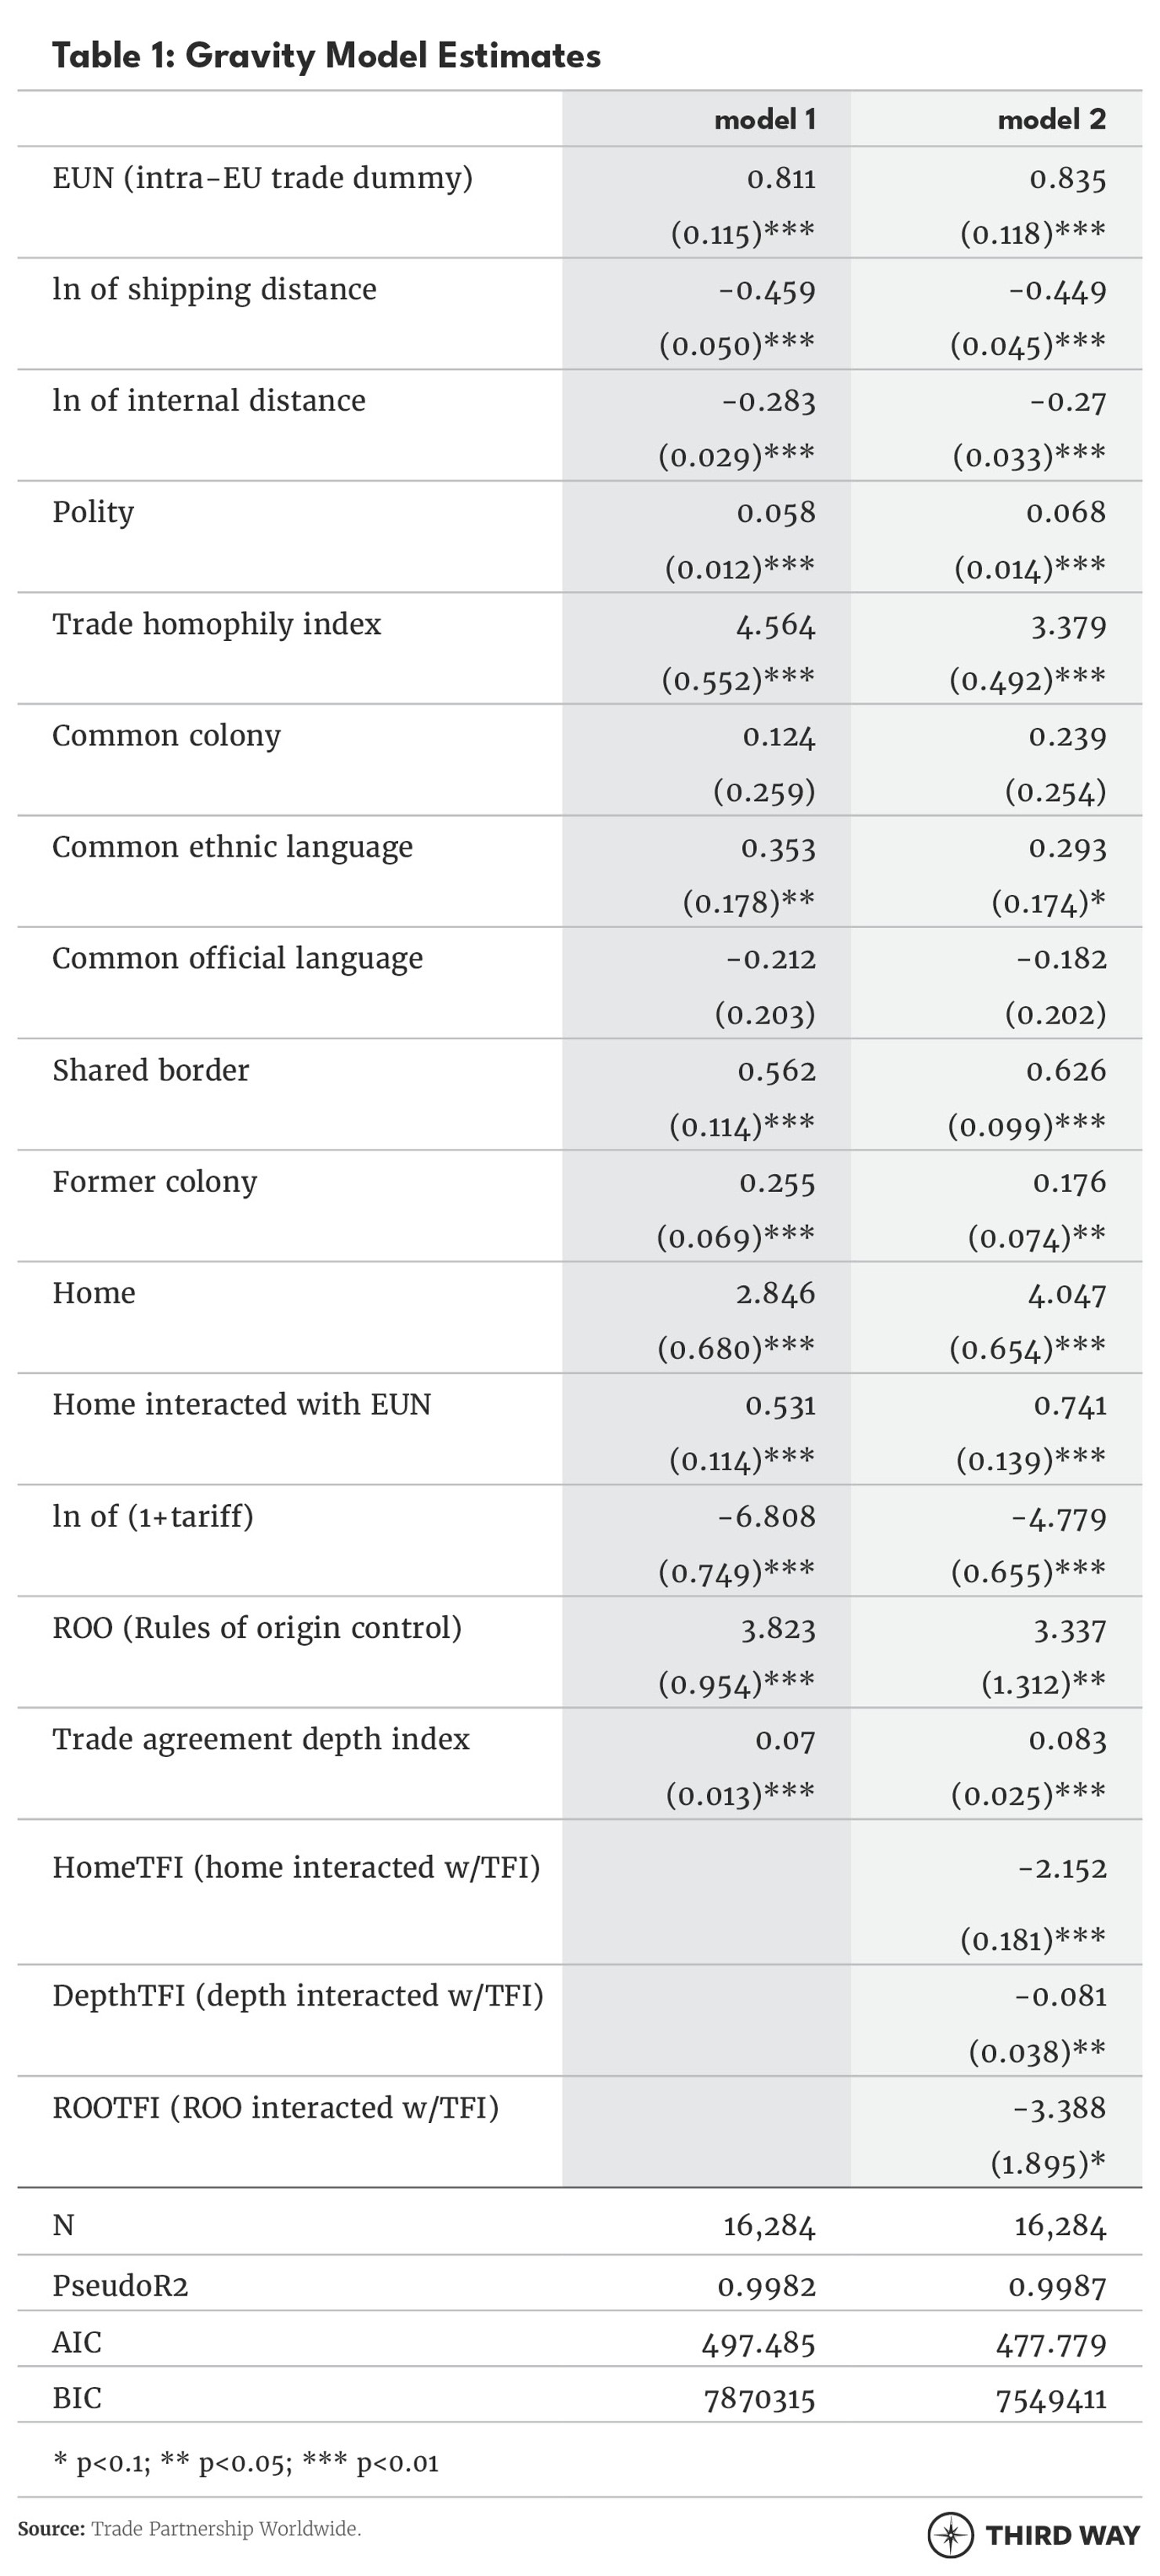
TPW estimates of the trade cost reductions associated with improved trade facilitation come from a gravity model of world trade. TPW used a two-step econometric model that controls for the endogeneity of trade agreements.18 The gravity model provides estimates of the drivers of bilateral trade flows. These drivers include natural determinants of trade, such as geographic distance and institutional differences between countries. They also include policy determinants of trade, including tariffs and trade agreements. The innovation here is that TPW includes the most recent values (benchmarked to 2019) for the OECD’s trade facilitation index (TFI). TPW included the OECD’s TFI values interacted with both the depth of preferential trade agreements and a variable indicating home trade (i.e., domestic absorption). The home trade interaction yields the variation in most favored nation (MFN) trade costs associated with variations in the TFI, while the depth of preferential trade agreement (PTA) interactions control for the trade facilitation benefits of existing trade agreements. On the basis of these estimates, TPW calculates counterfactual trade flows when they move the TFI value to best practice levels.19
In the model, TPW parametrizes non-policy barriers to goods trade in logs as a linear function of log bilateral shipping distances, common border, common language, and former colonial ties. Their data for the econometric stage of the exercise come from a number of sources. Bilateral trade data are from COMTRADE and applied tariff data come from the MacMAPS database (as concorded to the GTAP database, as discussed below). Macroeconomic data come from the World Development Indicators database. Data on the depth of trade agreements come from the DESTA database. Shipping distances are based on actual shipping routes (Bekkers et al., 2015), other natural geo-historical trade-cost measures are from the CEPII database (Mayer and Zignago, 2011), and institutional data come from the Quality of Governance expert survey dataset (Dahlström et al., 2011). TPW uses the polity index as defined in Egger et al (2015).
The results of the second stage gravity model are reported in Table 1 below for total goods trade. In the table, the first column of results shows estimated coefficients when TPW has not controlled for trade facilitation measures. The second column of results includes trade facilitation measures. The variable HomeTFI is a direct measure of the trade benefits of better trade facilitation. Statistically, the coefficient points to a significant benefit (i.e. lower border costs and so lower home bias) when trade facilitation measures are improved. Economically, the relevance of these estimates is shown in the first table of “The Impact of Reducing Red Tape” in the above report.
2. CGE Modeling
TPW applied a multi-sector, multi-country computable general equilibrium (CGE) model of the US economy to estimate the impacts of improved trade facilitation on US employment. CGE models use regional and national input-output, employment, and trade data to link industries in a value-added chain from primary goods to intermediate processing to the final assembly of goods and services for consumption. Inter-sectoral linkages may be direct, like the input of steel in the production of transport equipment, or indirect, via intermediate use in other sectors (e.g., energy used to make steel that is used in turn in the transport equipment sector). TPW’s CGE model captures these linkages by incorporating firms’ use of direct and intermediate inputs. The most important aspects of the model can be summarized as follows: (i) it covers all world trade and production; and (ii) it includes intermediate linkages between sectors within each country.
2.1 The Model
The specific model used was the Global Trade Analysis Project (GTAP) model, with the most recent GTAP database, GTAP v10.1, released December 2020. The structure of the v10 database is outlined by Aguiar et al (2019). The model and its associated data are developed and maintained by a network of researchers and policymakers coordinated by the Center for Global Trade Analysis at the Department of Agricultural Economics at Purdue University. Guidance and base-level support for the model and associated activities are provided by the GTAP Consortium, which includes members from government agencies (e.g., the US Department of Commerce, US Department of Agriculture, US Environmental Protection Agency, and US International Trade Commission, European Commission), international institutions (e.g., the Asian Development Bank, Organization for Economic Cooperation and Development, the World Bank, United Nations, and the World Trade Organization), the private sector, and academia. Dr. Francois of TPW is a board member of the Consortium.
The model assumes that capital stocks are fixed at a national level. Firms are assumed to be competitive and employ capital and labor to produce goods and services subject to constant returns to scale. Products from different regions are assumed to be imperfect substitutes in accordance with the so-called “Armington” assumption. Armington elasticities are taken directly from the GTAP v.10 database, as are substitution elasticities for value added.
TPW was interested in the impact of improved market access through trade facilitation on the United States and individual state economies given US wage structures in 2019 (i.e., given the wage structure of the labor force in that year, how many jobs in the US economy and in each state’s economy would be supported by improved market access?). As such, the model employs a labor market closure (equilibrium conditions) where wages are fixed at prevailing levels, and employment levels adjust. This provides a model-generated estimate of the US jobs by improved market access.
2.2 Data
The model incorporates data from a number of sources. Data on production and trade are based on input-output, final demand, and trade data from the GTAP database (see Aguiar, Narayanan & McDougall 2019). These data provide important information on cross-border linkages in industrial production, related to trade in parts and components. For the 2019 simulation, social accounting data are drawn directly from the most recent version of the GTAP dataset, version 10.1 (released December 2020). Trade data (both exports and imports) exclude re-exports. This dataset is benchmarked to 2014 and includes detailed national input-output, trade, and final demand structures for 140 countries across 56 sectors (see Table A-1). TPW updated the trade and national accounts data to 2019. The basic social accounting and trade data are supplemented with data on tariffs and non-tariff barriers from the World Trade Organization's integrated database and from the UNCTAD/World Bank WITS dataset. All tariff information has been concorded to GTAP model sectors within the version 10.1 database.
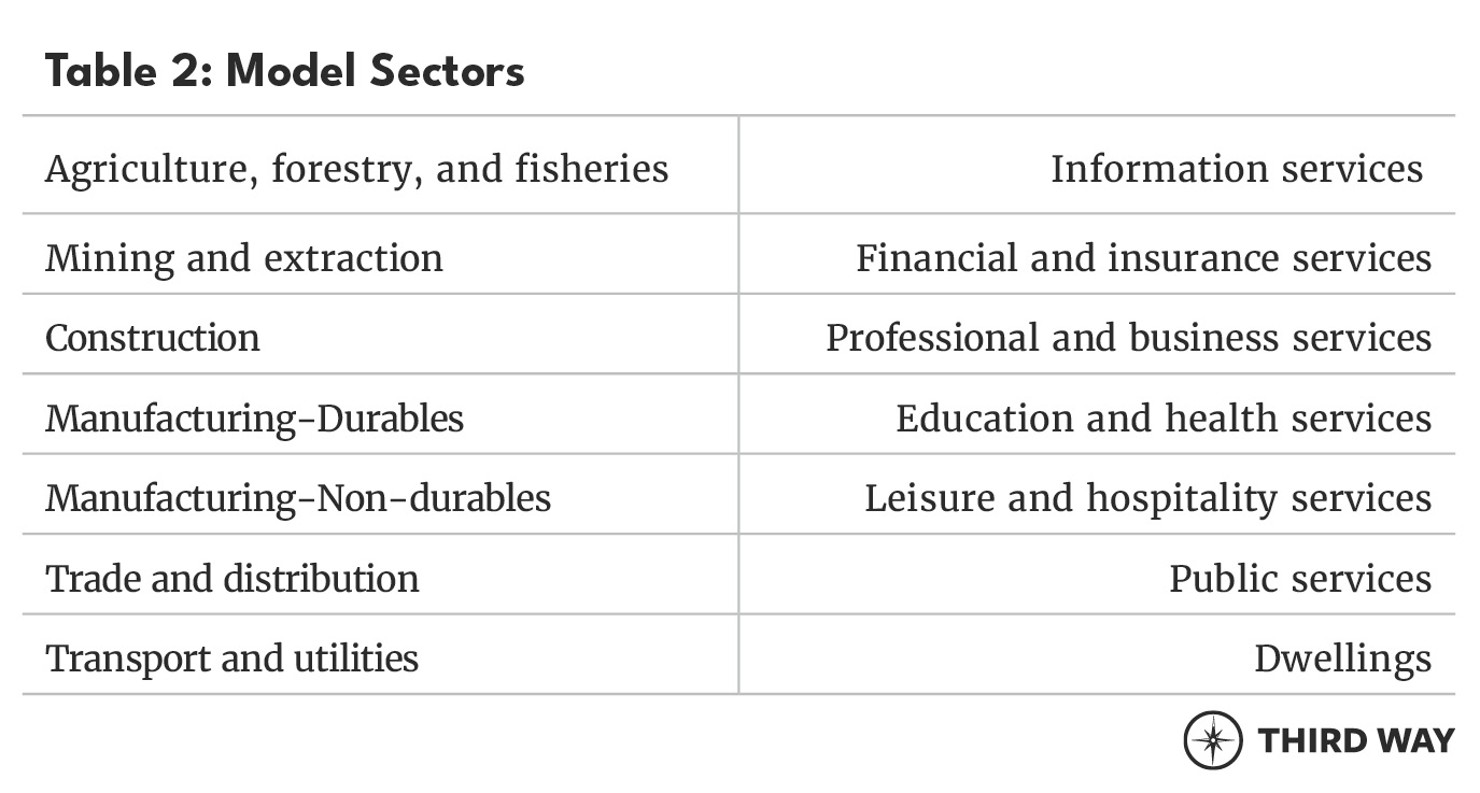
The GTAP model sectors were concorded to state-level employment data from the Commerce Department’s Bureau of Economic Analysis (BEA). This allowed TPW to map nationwide effects to individual states. It is important to emphasize that TPW distributed the employment impacts of trade at the national level to employment at the state level. TPW is therefore reporting state-level employment related to trade nationally. BEA does not disclose state-level employment data for certain sectors for confidentiality reasons. For some of these sectors, TPW was able to use Moody’s Analytics state-level employment estimates to estimate the missing national employment to undisclosed sectors in these states. In addition, TPW mapped GTAP employment data (in five occupational categories) to BEA data on employment by occupation and by educational attainment. The mapping to occupation by educational attainment allows TPW to further break down employment impact by a combination of these occupational categories and educational attainment levels. TPW’s aggregation of sectors reflects the availability of data on educational attainment and occupation, and as such for the purposes of the modeling exercise, their aggregation of the GTAP database includes 14 sectors. Because TPW mixed employment data from two sources (BEA and Moody’s), the sum of the employment effects for the states may not add perfectly to the total for the United States. The model sectors are shown in Table 2. For purposes of the modeling exercise here, the 110 countries/regions in the standard GTAP model were placed in 19 distinct groupings: Australia, China, Japan, Korea, Vietnam, East Asia and Pacific, European Union 27, United Kingdom, Europe and central Asia, Brazil, Chile, Latin America and Caribbean, Canada, Mexico, Middle East North Africa, Sub-Saharan Africa, India, South Asia, United States of America.
2.3 Model-based Simulation
The simulation conducted with the GTAP model involved imposing changes in trade facilitation costs, based on TPW’s econometric results as reported above. Note that trade facilitation measures are MFN (i.e., they benefit everyone). For example, improved customs procedures in Brazil will benefit both US and Mexican exporters. This means TPW’s experiment involves global improvements in market access conditions, linked to trade facilitation, affecting many pairs of countries. Because TPW included the impact of existing trade agreements on trade facilitation costs, the estimates avoid potential double counting where costs are already partially lower due to existing agreements.
For the United States, because it is essentially at the best practice frontier for trade facilitation, based on the OECD data, the simulation involves improved market access conditions for US exporters, but no corresponding improvement for US importers. To reiterate, the exercise means improved market access abroad, but no change or easing of foreign access to the US market.
The results of the simulation exercise show how much US and state output and employment would change, tracing changes at the border as they work through the US economy.
2.4 Further disaggregation of employment impacts
The modelling generated employment results disaggregated by high-school and higher levels of education, and by occupational categories. TPW further took the national employment results by sector and estimate the number of jobs related to reducing trade cost barriers that are likely held by women, minorities, and small businesses. They use US government data detailing US employment by sector in 2019 for each of these characteristics and apply the national shares by sector to the national employment results by sector.
Additional References
Aguiar, A., Chepeliev, M., Corong, E., McDougall, R., & van der Mensbrugghe, D. (2019), “The GTAP Data Base: Version 10,” Journal of Global Economic Analysis, 4(1), 1-27. Retrieved from https://www.jgea.org/ojs/index.php/jgea/article/view/77.
Bekkers, E., Francois, J. F. and Rojas-Romagosa, H. (2018), “Melting Ice Caps and the Economic Impact of Opening the Northern Sea Route,” Economic Journal. doi:10.1111/ecoj.12460.
Dahlström, C., V. Lapuente and J. Teorell (2011), “Dimensions of bureaucracy II: A cross- national dataset on the structure and behavior of public administration,” QoG Working Paper Series, 6.
Dür, A., L. Baccini and M. Elsig (2014). “The design of international trade agreements: Introducing a new database,” Review of International Organizations, 9, 353–75.
Egger, P., Francois, J., Manchin, M., & Nelson, D. (2015), “Non-tariff barriers, integration and the transatlantic economy,” Economic Policy, 30(83), 539-584.
Hertel, T. (2013). “Global Applied General Equilibrium Analysis Using the Global Trade Analysis Project Framework,” in P. B. Dixon and D. W. Jorgenson eds. Handbook of Computable General Equilibrium Modeling. Amsterdam: Elsevier, 815-76.
Mayer, T. and S. Zignago (2011). “Notes on CEPII’s distances measures: The GeoDist data-base,” CEPII Working Paper No. 2011-25.
OECD (2013), “Introducing the OECD trade facilitation indicators,” OECD Trade and Agriculture Directorate, Paris.
https://www.oecd.org/trade/topics/trade-facilitation/documents/trade-facilitation-indicators-methodology.pdf
Reinert, K.A.. and D.W. Roland-Holst (1997), "Social Accounting Matrices,” in Francois, J.F. and K.A. Reinert, eds. (1997), Applied methods for trade policy analysis: a handbook, Cambridge University Press: New York.