Report Published January 28, 2019 · 17 minute read
Ripple Effect: The Cost of the College Dropout Rate
Wesley Whistle
Suppose colleges performed as well as high schools. That’s right: high schools. According to our estimates based on federal data, just 57% of students who start two- and four-year colleges graduate.1 Students who take out loans to attend college but never finish are three times as likely to default, earn lower incomes throughout their lives, and have higher rates of unemployment.2 That leaves billions of taxpayers’ significant federal investment in higher education wasted.
What if rather than accepting these middling completion rates, we made a major push to increase the number of students leaving college with a degree in hand? Similar efforts in the K through 12 system increased high school graduation rates by 15 percentage points since the 1990s and to their highest levels to date.3But college completion has been an afterthought.
In this paper, we calculated the micro- and macroeconomic benefits of raising college graduation rates from their current rate of 57% to the national high school graduation rate of 84% for a single class of students entering two- and four-year schools. This is not an unreasonable goal. All college students have already demonstrated some academic success by earning a high school diploma, have been selected by a college through some form of an application process, and more than half of college dropouts have at least two years of postsecondary education under their belts.4
We estimate the benefit to the individual, as well as the economy, through metrics like increased employment, higher earnings, decreased likelihood of poverty, and more. Of course, predictions are difficult, but indulging in this kind of thought experiment allows us all to imagine the kind of future our country could see if we make a collective effort to ensure more students who start college actually graduate with the degree they set out to obtain.
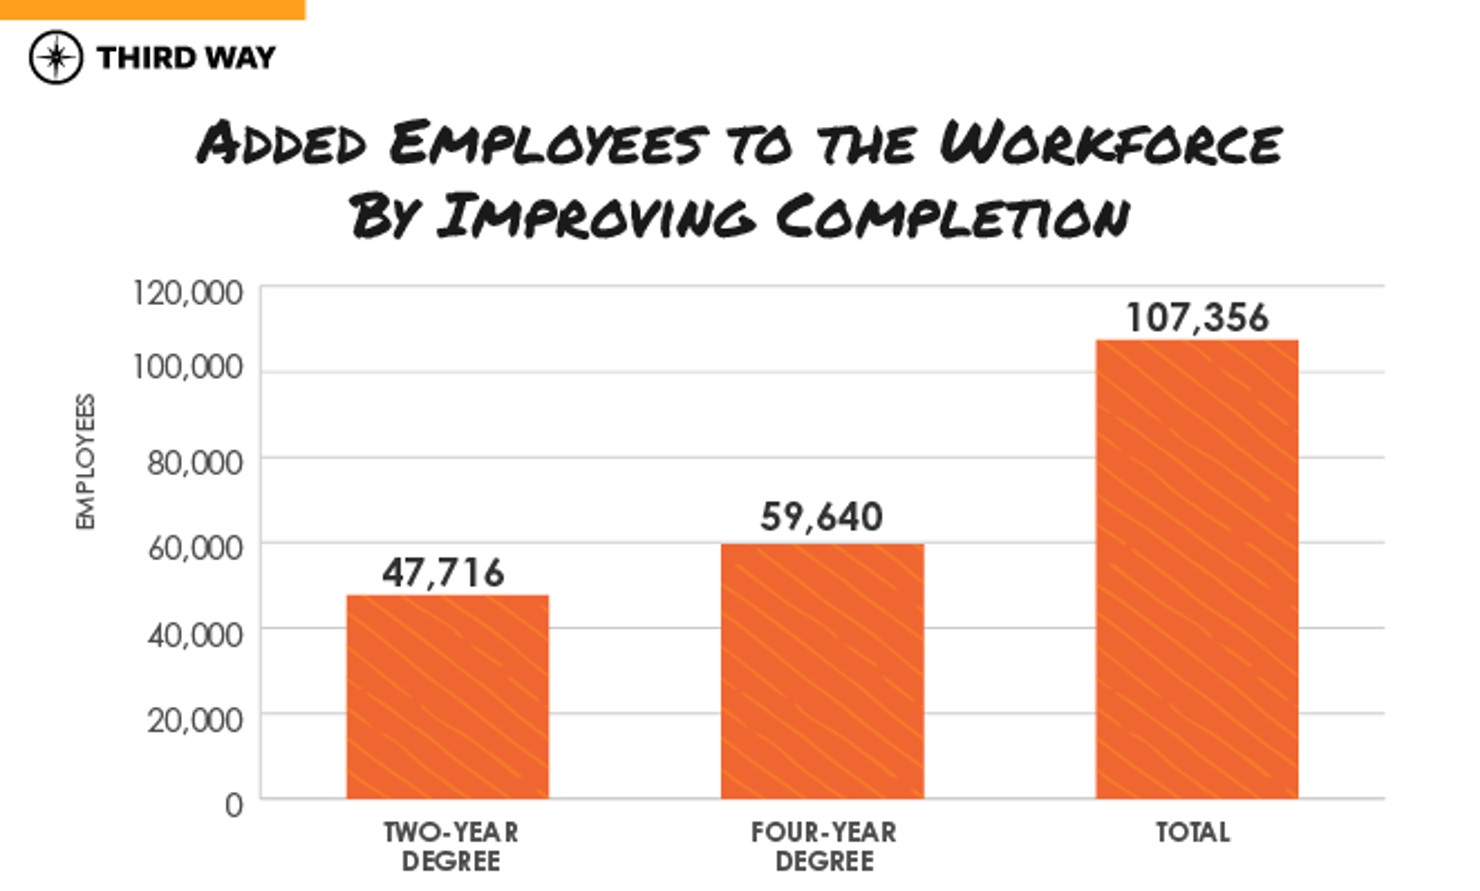
Among our key findings, an 84% graduation rate for this one class of students would:
- Increase employment by 107,400 for just this class;
- Increase annual wages for 730,000 additional two-year degree holders by an average of $4,849;
- Increase annual wages for 520,000 additional four-year degree holders by an average of $19,034;
- Reduce the number of people in poverty by 48,000; and
- Over the course of their lifetimes increase the amount of local, state, and federal tax revenue by more than $90 billion.
Three decades ago, the federal government made a concerted effort to improve the outcome of high schools and it paid off. Today, college graduation rates resemble the high school graduation rates of past eras. A new push to get colleges to perform as well as high schools would benefit students, taxpayers, and the broad economy by creating better opportunity for all Americans to earn a stable and secure life.
What If We Did Better at Graduating College Students?
To begin, let’s first take a look at how many more Americans would have college degrees if we put as much national attention on postsecondary degree attainment as we do on high school graduation. Using students who enrolled in higher education (at two- and four-year institutions) in the fall 2008 semester, we see that only 45% of students graduated from the same institution within eight years.5 That means of the nearly 4.8 million students who started college that semester—some by transferring in—approximately 2.2 million of them earned a degree from that institution eight years later. And while data shows that just over 1 million students in this cohort transferred out to another institution, National Student Clearinghouse data shows that on average, only 11.6% of four-year students and 11.2% of two-year students will transfer and complete a degree elsewhere.6 To account for this possibility, we estimate that only 2.7 million of the nearly 4.8 million students from the 2008 cohort had degrees eight years later—a mere completion rate of just 57%. This leaves nearly 2 million college students (who played by the rules, graduated from high school, and enrolled in a college that accepted them) without a college credential of some kind or the skills they need to find well-paying jobs in today’s rapidly changing economy.7
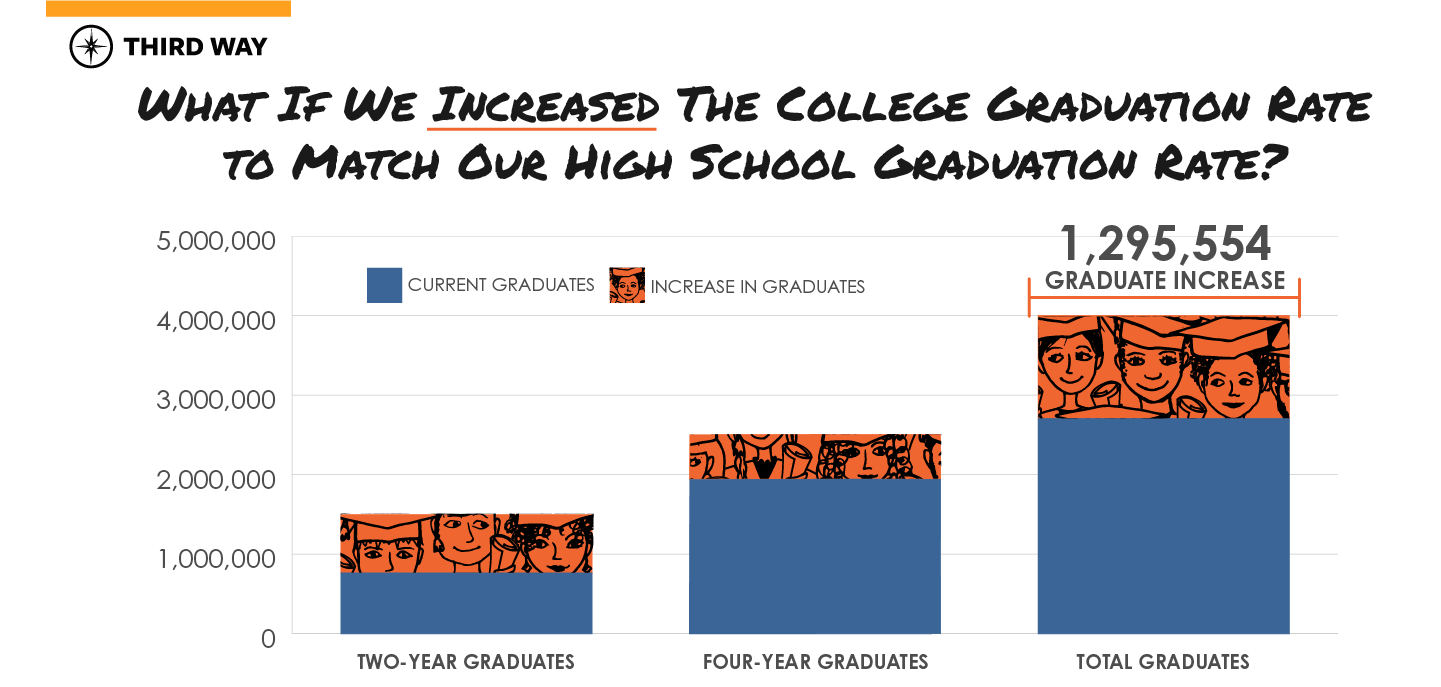
But it doesn’t have to be this way. By making an effort to have the national college graduation rate mirror the high school graduation rate (which is currently 84%), we could see a massive increase in the number of college graduates every single year.8 Reaching this comparable graduation rate would mean 4 million of those 4.8 million college students would end up with a college degree—a 48% increase in graduates. This achievement would provide the economy with nearly 1.3 million more college degree-holders in one year alone, an increase of over 730,000 two-year degree holders and over 520,000 four-year degree holders.
Luckily this goal is even more attainable when we take into account US Census data showing 55% of current Americans with “some college” but no degree have completed two or more years of college, and 14% have already completed three or more.9 This means even small efforts to increase college completion could yield massive results.
More Graduates Equals More Employees in the Workforce.
Of course, efforts to improve college completion rates aren’t just about the diploma a student receives but also what that diploma signals to employers. Postsecondary degrees have labor market value because employers use them as a proxy for the hard and soft skills that translate into increased performance in the workplace. Regardless of whether that’s always true (we know there is varying quality across institutions), it is this reason why more college graduates in the labor pool equates to increased employment—especially in today’s digital economy. In fact, by 2020, 65% of all jobs will require a postsecondary credential of some kind, up from just 28% a few decades ago.10
Increased Participation in the Labor Force
One labor market indicator showing economic opportunity and success for workers is the labor force participation rate. By measuring the overall percentage of people eligible to work who are either working or seeking employment, the labor force participation rate provides the first picture of the benefit a college degree can provide. In particular, this rate helps us understand the number of people who are discouraged by unemployment and have stopped looking for jobs.
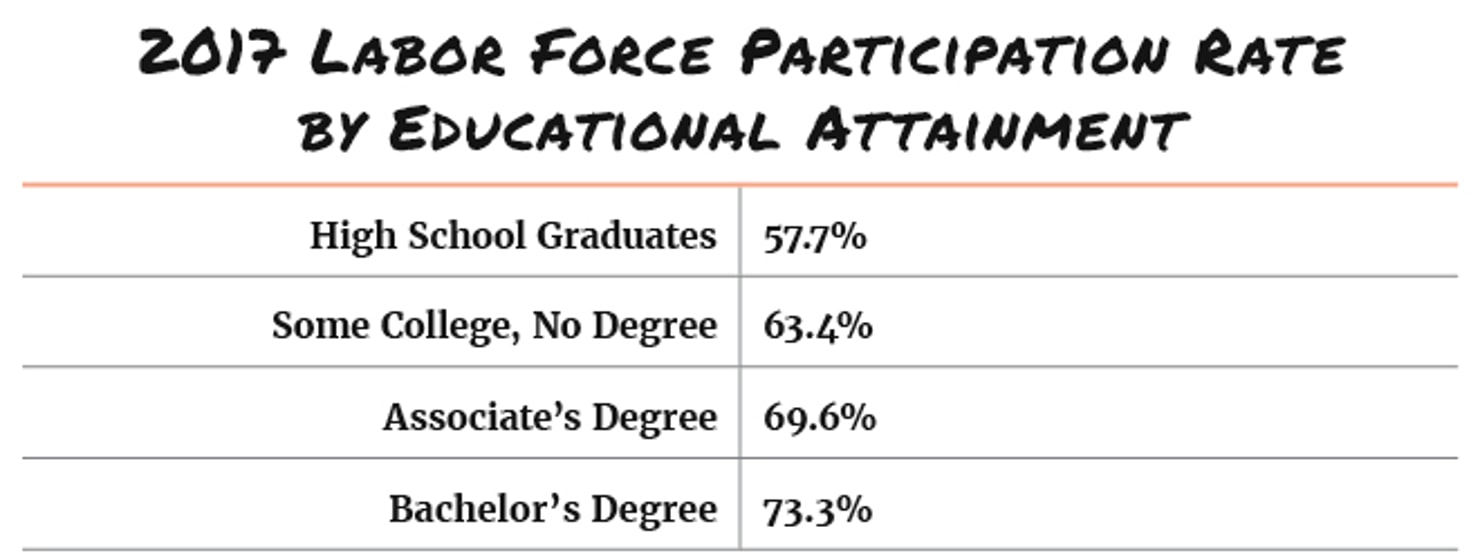
Looking at this statistic, we can see that college graduates participate in the workforce at a much higher rate than their peers without a degree.11 Since graduating more students would reduce the number of those with some college but no degree, we would see a substantial boost in the number of Americans either working or seeking employment. By making sure the nearly 1.3 million more people would get degrees, we would gain an additional 101,000 people who would participate in the workforce because associate’s degree holders participate in the labor force at a rate 6.2 percentage points higher than those with some college and no degree. And those with bachelor’s degrees participate in the labor force at a rate 9.9 percentage points higher.
Decreased Unemployment
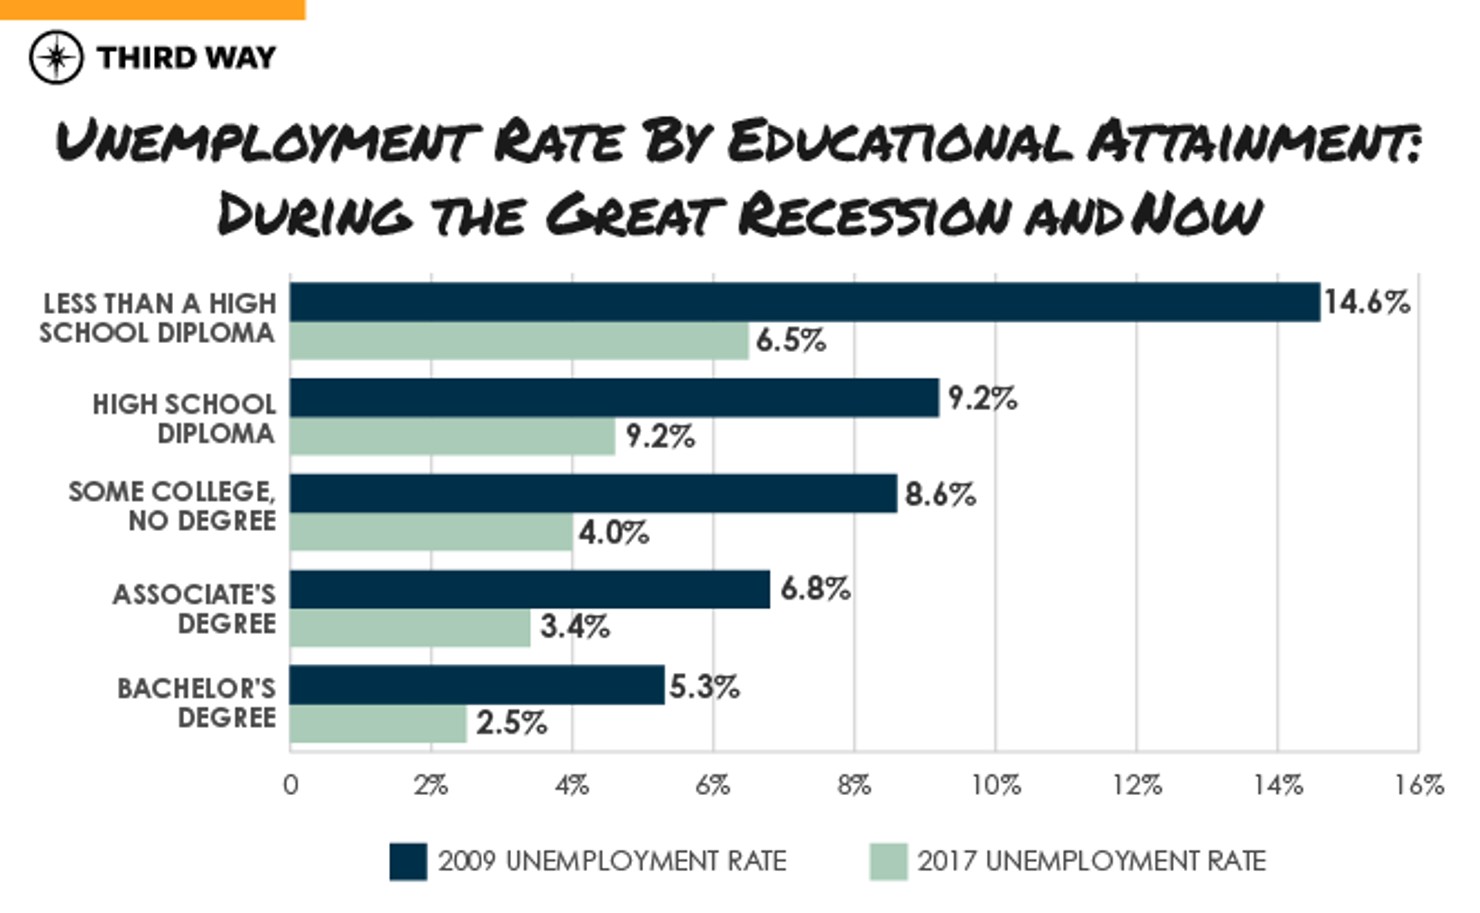
By layering the labor participation rate with the unemployment rate, we can see that college graduates are not only more likely to be in the labor force, but they are also more likely to be employed, making the benefits of a college degree even more evident. For example, in 2017, those with two-year and four-year degrees had unemployment rates at 3.2% and 2.5% respectively, while those with only a high school diploma had an unemployment rate of 4.6%.12 Even those with some college but no degree face higher than average unemployment at 4.0% compared to the overall unemployment rate of 3.6%.13
Increasing college attainment is critical as the economy changes and more jobs require college degrees. As states face growing skills gaps, increasing college attainment can help fill high-demand and high-skill jobs. For example, data from the Bureau of Labor Statistics shows that by 2026, the number of registered nursing jobs will grow at a rate over two times faster than the average, while the number of software developer jobs will grow at a rate over three times faster.16 As a result, equipping the workforce with college credentials and 21st century skills will equate to more Americans having the opportunity to secure better jobs in today’s rapidly changing economy.
More Degrees Equals More Money in the Pockets of Students and Taxpayers.
More Money for Students
Having consistent employment makes you more financially secure. Earnings data shows that holding a college degree also equates to higher wages over time as the median college graduate has significantly higher earning power than someone who only completes high school. In 2017, college graduates with associate’s degrees and bachelor’s degrees stood to benefit from median annual salaries of $40,322 and $53,882 respectively, compared to a median salary of $36,633 for those with “some college” but no degree.17That means the completion crisis costs students who don’t finish associate’s and bachelor’s degree programs a respective $3,689 and $17,249 a year in earnings—money that can make a real difference in a person’s life. For example, the premium from an associate’s degree is enough to cover the annual budget for a year of food for one person.18 The increase in salary from a bachelor’s degree is enough to cover the rent of a one-bedroom apartment for an entire year in a number of major metropolitan cities.19
This kind of earnings boost plays out for recent graduates as well, showing that there are immediate economic benefits in earning a postsecondary degree. Of those ages 25-29, the average associate’s degree holder earned nearly $4,949 more than those who had completed “some college” and over $6,056 more than a high school graduate.20 And bachelor’s degree graduates stood to benefit an additional $19,034 on average compared to someone with some college, but no degree.21 Though we know that as the supply of college graduates increases, the wage premium will tighten, it is unlikely this benefit would diminish enough to make the payoff not worth it.22 With that kind of salary increase per year, per person, those who complete will continue to see the long-term economic benefits of a college degree for years to come.
Even when factoring in the costs of college, data shows college graduates are likely to experience, on average, lifetime wage premiums of $900,000 more than those with only a high school degree.23 Of course, all of these wage boosts are multiplied when you consider how additional earnings early in life can lead to greater savings and the compounding of interest on retirement accounts. Data from the Federal Reserve shows that families headed by someone with a college degree save at a rate 14 percentage points higher than those with “some college, no degree.”24 With better earning potential, college graduates can achieve one of their primary goals for attending college in the first place—the opportunity to live a more secure and stable life.25
More Money for Taxpayers
Of course, individuals aren’t the only ones to benefit from the increased employment and earnings potential that comes from having more college graduates entering the workforce. There are spillover effects that come from increased expendable income, as those with higher incomes are able to spend more and put more money into the economy. Higher incomes also result in more tax revenue for federal, state, and local governments. Simply put, college graduates—through increased earnings—produce an increase in tax revenue across the board. In fact, according to one analysis from The Lumina Foundation, the lifetime value of taxes for a college degree yields the following increases:26
- $328,511 for bachelor’s degree recipients. That’s $142,231 more than students with “some college” and $191,947 more than those with high school degrees.
- $201,341 for associate’s degrees recipients. That’s $15,601 more than students with “some college” and $64,777 more than those with only high school degrees.
Using this data, we can estimate a lifetime increase in local, state, and federal tax revenue of over $91 billion from a single year’s entering college class, just by increasing completion to the rates we’ve achieved in our nation’s high schools. That breaks down to an additional $11 billion for associate’s degree holders and $80 billion for bachelor’s degree holders. That’s enough money to triple the current investment in the Pell Grant program.27 That kind of tax revenue could also build over 5,000 new elementary schools or nearly 23,000 miles of highway.28 Just imagine the kinds of additional local, state, and national improvements we could make with this kind of increased tax revenue year after year.
Increasing the college graduation rate would also directly increase annual Social Security contributions. Currently, Americans pay 6.2% on the first $127,200 of their salary into Social Security, with their employers paying another 6.2%.29 Over their lifetime, college graduates pay more into Social Security—a total of $81,997 for associates degree holders and $135,219 for bachelor’s degree holders.30 Even accounting for the benefits those graduates would receive from Social Security, we can estimate an increase in Social Security contributions of nearly $50 billion from this single cohort of students alone over their lifetimes.31 This kind of increase to the Social Security system would not only help to ensure its solvency (which the most recent Social Security Administration’s Trustees Report estimates will run out of money by 2034) but would also provide greater economic security for many more Americans throughout their golden years.32
More Graduates Means a Decrease in Poverty and Use of Public Assistance Programs.
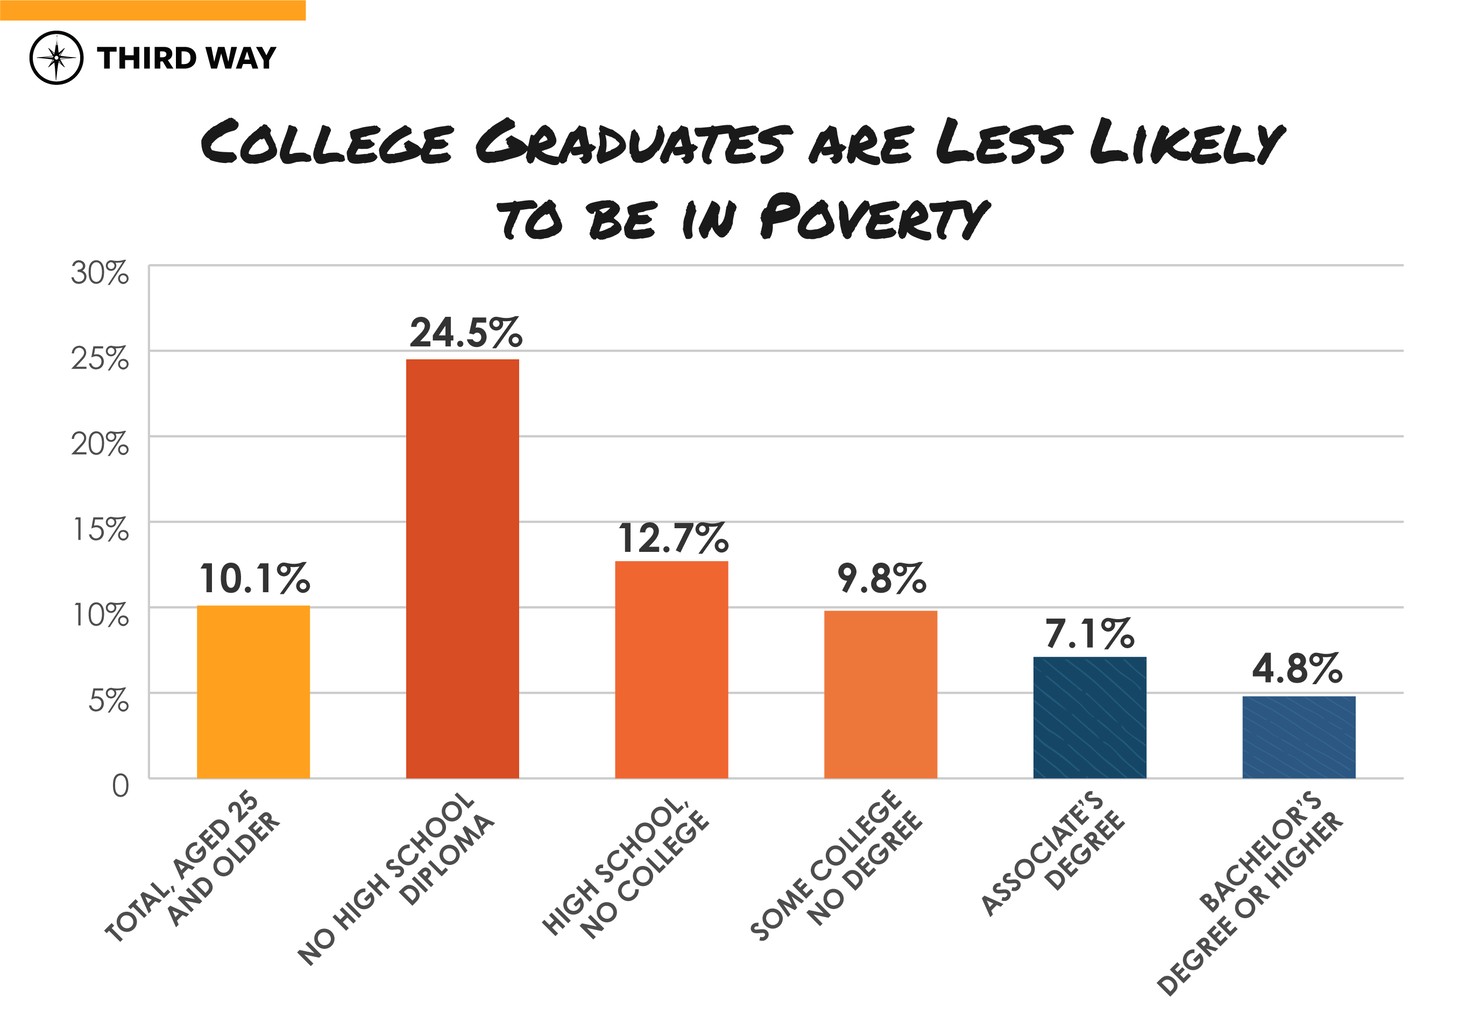
More people graduating and earning higher salaries also means fewer people living in poverty—and hence, fewer families who need to rely on local, state, and federal safety net programs. College graduates both pay more in taxes and cost less in tax expenditures due to their reduced probability of living in poverty and needing public assistance programs.33 Recent Census data based on income thresholds for varying family size and composition finds people with only a high school diploma are nearly three times as likely to be in poverty as bachelor’s degree holders.34 And those who have some college and no degree are more than twice as likely to live in poverty as their bachelor degree-holding peers. By increasing college completion for this one cohort of students, we could achieve a reduction of nearly 48,000 people living in poverty.35
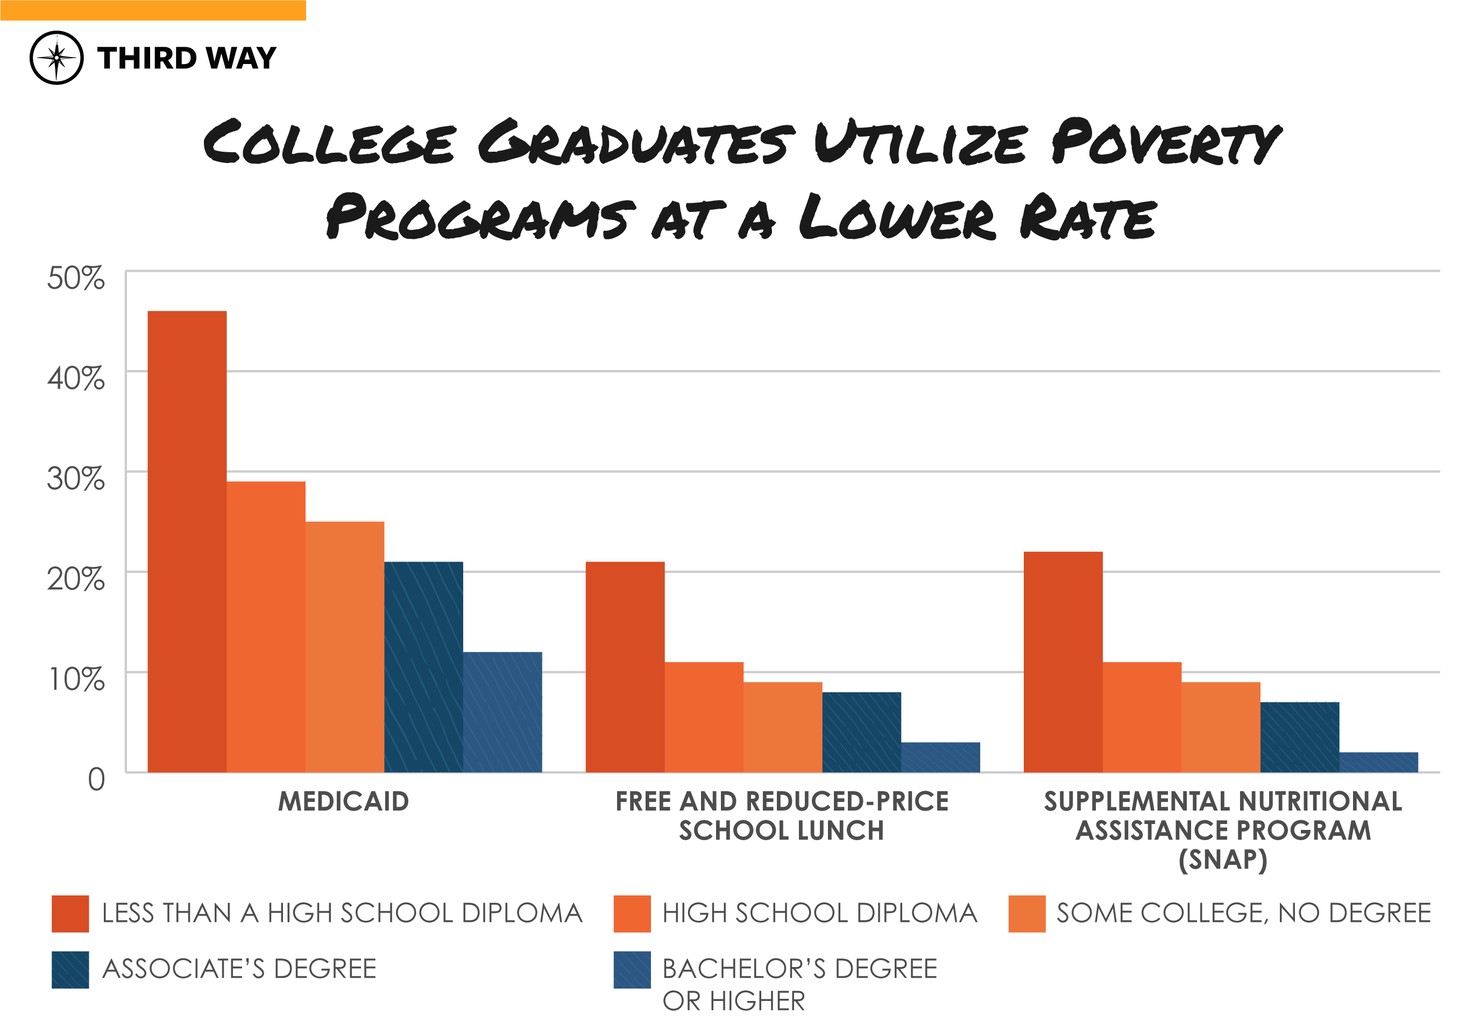
Percent of individuals Age 25 and Older Living in Household that Participate in Various Public Assistance Programs, by Education Level, 2017
The existence and maintenance of these social safety net programs remain critical to ensuring that our country provides for those in need, however, no one aspires to be reliant on the safety net, and having fewer people in need of social services benefits those individuals and taxpayers alike. When students enroll in college and graduate, they make more money on average and utilize public assistance programs at a rate of at least half of those who don’t. Rather than having to invest money on the back end to lift people out of poverty, there should be a strong national interest to instead invest our money and energy on the front end to help more students who enroll in college leave with a quality degree.
Conclusion
There’s no doubt that increasing the number of students who graduate from college each year will pay dividends for years to come—from making sure more people become employed, to growing a stronger tax base, to making sure fewer people need to rely on public safety net programs to make ends meet. That’s why it should no longer be acceptable to leave half of college enrollees degreeless—many of them in debt. To address this ongoing crisis, our country must give college completion the same laser-like focus we gave our nation’s high schools over the last two decades. Doing so will require Congress to enact policies in its next reauthorization of the Higher Education Act (HEA) that prioritize completion and other important student outcomes like the ability to repay loans and earn a decent living post-graduation. Because making sure all students have the opportunities they need to earn a stable and secure life must start with helping all students not just make it to college—but through college—so they can reap the clear benefits a college degree affords in today’s economy.
Appendix
Methodology
To calculate the graduation rate for this analysis, we looked at the fall 2008 cohort of students shown in the new “Outcomes Measures” survey data released by the US Department of Education’s Integrated Postsecondary Education Data System (IPEDS) database in October 2017. Though we did not do this calculation on the institutional level, we limited our dataset to only Title IV participating institutions. Additionally, we calculated this graduation rate by the level of institution (at least two but less than four years and four or more years). We used that calculation to determine the impact in each of the metrics that follow. We did not, however, do separate calculations for part-time and full-time students or for first-time or transfer students.
One modification of this graduation rate is how we treated transfer students. We know some students transfer out, but because we lack a federal longitudinal data system, we are unable to understand their outcomes at those other institutions. However, because the new Outcome Measures survey has the number of students who “transfer out” from an institution, we use the research from the National Student Clearinghouse (NSC) to estimate a percentage of these students who would transfer out and graduate from another institution. For example, NSC’s research found that 11.2% of two-year students completed at a different institution. We acknowledge that this is based on six years while the Outcome Measures looks at an eight year rate, but it is also based on first-time students which have higher graduation rates. We use this as an estimate recognizing its limitations because we also have transfer and part-time students in the calculation.