Rising COVID-19 Cases in Frontline Districts Hurt GOP Chances in House


Coronavirus cases have swelled in the 42 “frontline”1 House districts that Republicans must flip to retake the House, making their already daunting political challenge even more difficult. As of June 30, the average COVID-19 per capita rate across these 42 districts stood at 888 per 100,000 people, which is well above the national average from that day of 817 cases per 100,000. Moreover, many of these frontline districts are in states where the virus is spiking anew – Arizona, Florida, Georgia, Texas, and Oklahoma.
The pandemic has affected American life in almost every conceivable way. However, while the virus has filled the news since March, people tend to recognize its true danger most when it comes to their community and impacts people they know and love. Those who have not seen or heard of people in their own community getting sick may experience the pandemic as primarily an economic crisis. Those who have seen the deadly effects of the virus firsthand, by contrast, are highly likely to view the pandemic as both a public health and economic crisis.
These different perceptions of the pandemic will influence voters’ opinions around policy responses to the crisis, such as social distancing measures and economic recovery plans. According to polling by the Kaiser Family Foundation, voters in states with higher COVID-19 rates are more likely to report sheltering in place and wearing a mask in public. These different perceptions of the health risks and government mandates will have important bearing on how voters judge their elected officials’ responses to the virus.
In a few frontline House districts, the health impacts of COVID-19 were apparent, local, and devastating from the start. New York’s 11th Congressional District, covering Staten Island and parts of Brooklyn, now has 2,655 cases per 100,000 residents, more than three times the national average. Many of those cases occurred in the spring. Likewise, districts such as New Jersey’s 5th and 11th and Michigan’s 11th have high caseloads, with most cases coming early. But in many other frontline districts, the curve has only recently begun to climb, including Arizona’s 1st, Florida’s 26th and Texas’ 32nd district.
The differences in case rates would not matter politically if the two parties held roughly the same views on the severity and solution to the health crises. But they don’t. President Trump and Republican leaders have consistently downplayed the disease’s consequences. They have shunned basic safety precautions like wearing a mask. They’ve urged businesses and schools to re-open and people to behave with just a minimum of caution.
This has not gone over well, at least nationally. Overall, views of the president’s handling of coronavirus are broadly negative, with more than two thirds of voters disapproving, up from 58% disapproving in June. But views of Trump’s handling of coronavirus differ depending on geography, and in areas where cases are rising, Trump’s approval ratings have dropped. According to polling by Pew Research, in the 500 counties where there have been more than 28 coronavirus deaths per 100,000 people, Trump’s approval rating has slipped by 17 percentage points since March.
This dynamic could have a profound impact on competitive House races. At the outset of the crisis, many frontline districts were well behind the national average in case numbers. In recent weeks however, many have caught or surpassed the national average.
We have divided the 42 frontline House districts into three categories: lower, mid-range and extreme COVID impact.
- Lower impact districts were below the national average: They had less than 600 cases per 100,000 people as of June 30, well below the national average from that day of 817 cases per 100,000.
- Mid-range impact districts were on the average: They had between 600 and 1000 cases per 100,000.
- Extreme impact districts were above the average: They had more than 1,000 cases per 100,000 residents.
We also looked at the rate of change in caseloads from June 15-30 as an indicator of how rapidly frontline districts could move into more dangerous COVID-19 territory.
Methodology
Our findings were calculated using available county-level data on cases (collected by USA Facts). In instances in which a county is divided across more than one congressional district, we assigned cases and deaths to a district based on what percent of counties’ registered voters live in that district (using the data firm Catalist).

The 15 lower impact districts have not experienced the worst of the virus firsthand. Residents are less likely to know anyone who has gotten sick or died from the virus and may not have seen its devastating health effects personally. While the health effects of the virus may feel far away for voters in these districts, the economic devastation from the pandemic is inescapable.
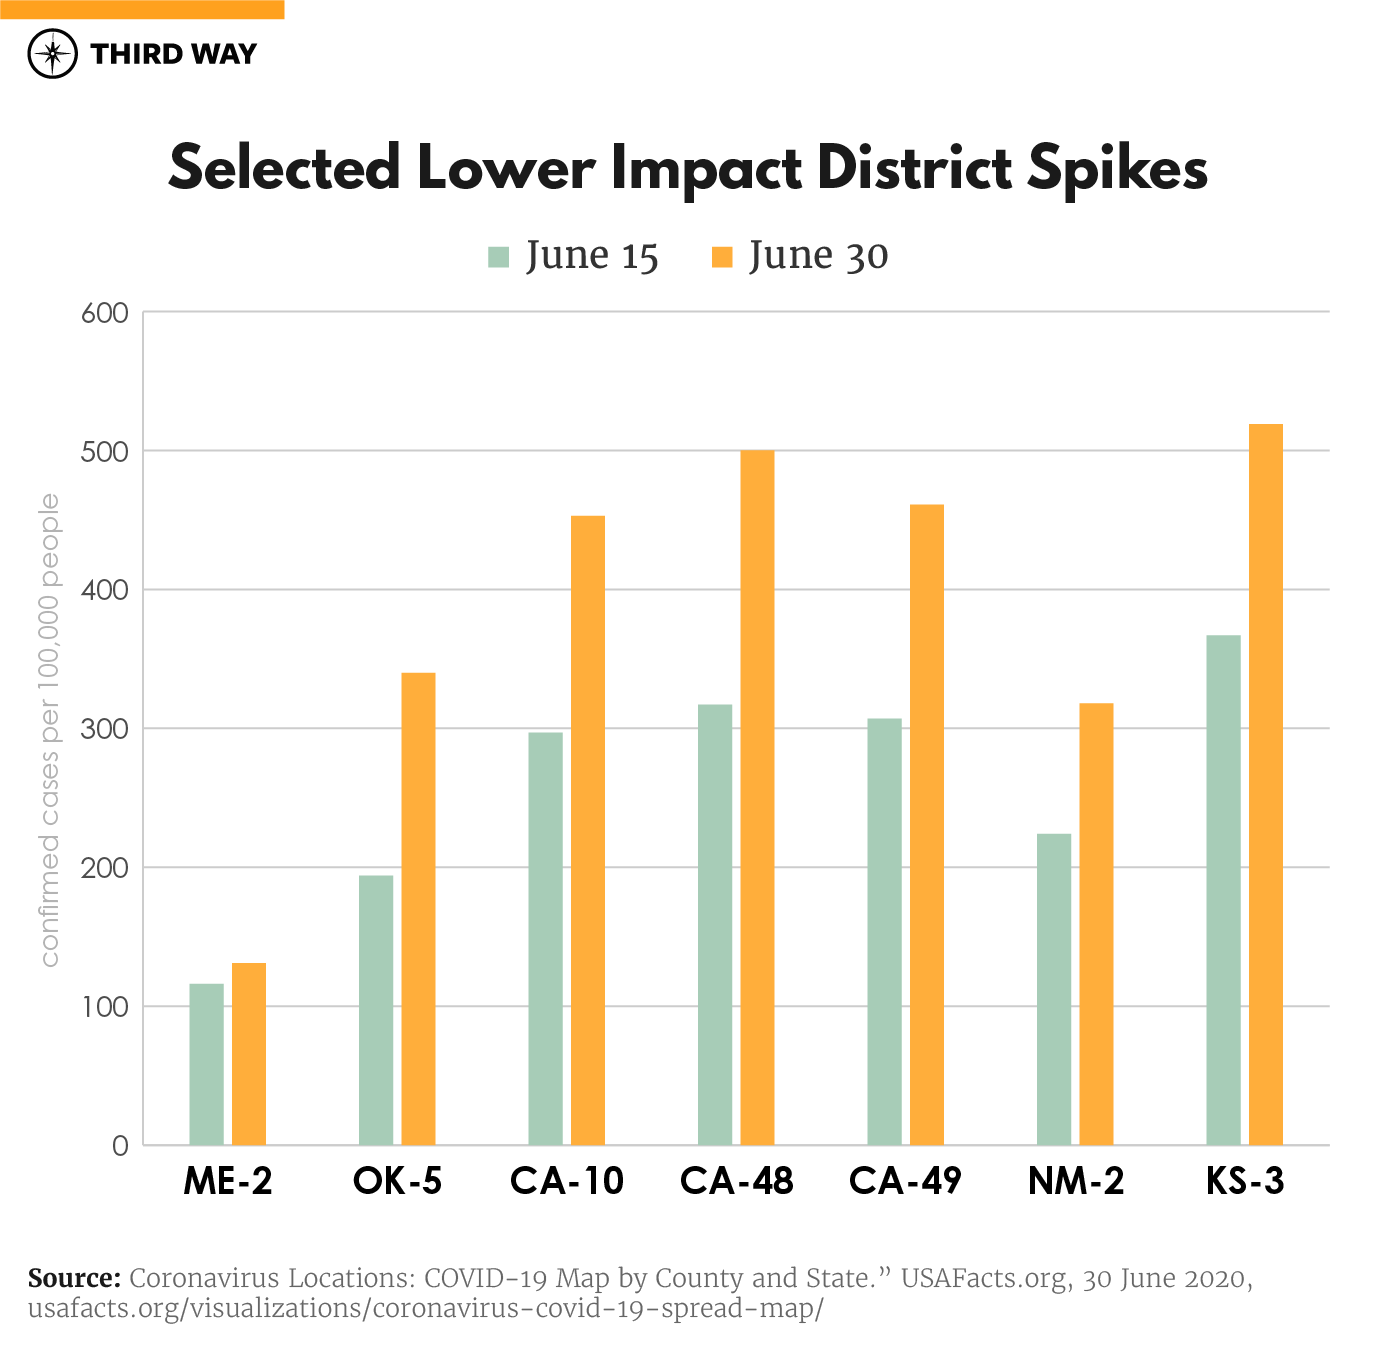
While these districts currently do not have high caseloads, some will not remain that way for long. By comparing data from June 30 to data aggregated on June 15, we can see that case numbers are rising in some of these low impact districts, and they may experience the virus in a new way in the weeks and months to come.
In Oklahoma’s 5th district, for example, cases have nearly doubled since June 15. Others seeing spiking case rates include California’s 10th, 48th and 49th, New Mexico’s 2nd, and Kansas’ 3rd. The average rate of increase for the 15 lower impact states between June 15 and June 30 is 37%. Given their current case numbers and rates of change, California’s 10th, 45th, 48th and 49th, as well as Minnesota’s 2nd and Kansas’ 3rd, are likely to move into the mid-range impact category in the coming weeks. It is possible that Oklahoma’s 5th district will shift into the next category as well.

In these 13 mid-range impact districts, case numbers hover near the national average of 817 cases per 100,000 residents. To be clear, this mid-range COVID rate is high compared to the rest of the world. America currently has the second highest COVID per capita rate among the 37 OECD nations. Because these districts are fairly representative of how the country as a whole is experiencing the coronavirus, they are likely to be more supportive of social distancing measures than those in low impact districts and are more likely to be critical of President Trump’s dismissive response to the crisis.
Many of these mid-range impact districts have seen dramatic increases in case numbers in the past few weeks, and it is likely that those numbers will continue to escalate. South Carolina’s 1st district has more than doubled its caseload since June 15, and cases in Nevada’s 4th, Texas’ 7th, Nevada’s 3rd, Utah’s 4th and Texas’ 32nd have increased dramatically as well. The average rate of increase for these mid-range impact districts is 50%, indicating that the situation is worsening dramatically and quickly.

Because of these spikes, the political landscape in these districts has transformed. Polling data in Texas, for example, has shown a quick shift in opinions on the pandemic and its seriousness. As the situation worsens in these districts, it is likely that voters will become increasingly frustrated and disillusioned with Trump and the Republicans’ confused and flippant responses to the crisis.

The 14 extreme impact districts have seen the worst of the pandemic, and voters there are likely to recognize its devastating impacts. In the tri-state area, which includes New York’s 11th district, Connecticut’s 3rd district and several New Jersey frontline districts, more than six in ten people say they know someone personally who tested positive for coronavirus. In New Jersey, approximately one in thirteen nursing home residents has died since the pandemic first reached the state. In these regions that have been ravaged by the virus, there is no doubt that the vast majority of voters will take the pandemic seriously and support social distancing, mask-wearing, and other protective measures.
The good news for these districts is that for many of them, the worst has passed, at least for now, as new cases have declined dramatically since their peak in April or May. The New York, Connecticut and New Jersey districts have all seen huge case numbers, but they have increased little in the recent weeks. The same is true for Michigan’s 11th, outside Detroit. Because the increase in cases has slowed in many of these districts, the average rate of change is lower than in the mid-range and low impact districts; the average rate of increase in these districts is 18%.

Extreme impact districts where cases are still rising include Illinois’ 6th and 14th districts, as well as districts in California, Arizona and Florida, where statewide case numbers have shot up in recent weeks.

Conclusion
If the November election, as now is expected, will hinge on how President Trump has handled the coronavirus crisis, House Republicans’ odds of regaining the majority are long and getting longer. In 27 of 42 frontline districts that Republicans must flip to have a shot of retaking the House, the COVID situation ranges from bad to horrid. In many of the remaining 15 frontline districts where the virus is less prevalent, cases are rising quickly. President Trump may wish he wore a mask, because his catastrophic response to the virus has proven contagious for at least some of the Republicans who will share the ballot with him in November.
Endnotes
Frontline districts are congressional districts that a Democrat won from a Republican member in 2018, identified by the DCCC as competitive in 2020.
Subscribe
Get updates whenever new content is added. We'll never share your email with anyone.