Report Published August 1, 2024 · 12 minute read
The Economic Experience of Non-College Americans Over the Pandemic

A year ago, Third Way noted that “There are two Americas today: one for the college educated, and one for those without four-year degrees.”1 That fundamental conclusion has not changed over the last year. But as more data come into focus, the pandemic recession was an unusual business cycle for Americans without a college degree in positive respects too. Non-college Americans are better off than in 2019 and, in some cases, better off than the hot economy of the late-1990s/early-2000s across a wide array of measures.
Non-college wages and wealth grew faster than for college graduates, even when adjusting for inflation, and the gap between the non-college and college unemployment rates closed faster than in recent recessions.2 Nevertheless, some measures of consumer sentiment for non-college Americans remain below those for college graduates, and below pre-pandemic levels.
In this report, we break down major economic indicators of family wellbeing to examine how recessions traditionally affected non-college workers, how the pandemic recession was different, and how working age non-college Americans have seen major economic improvement since the recession.
The (Typical) Recession Impact on Non-College America
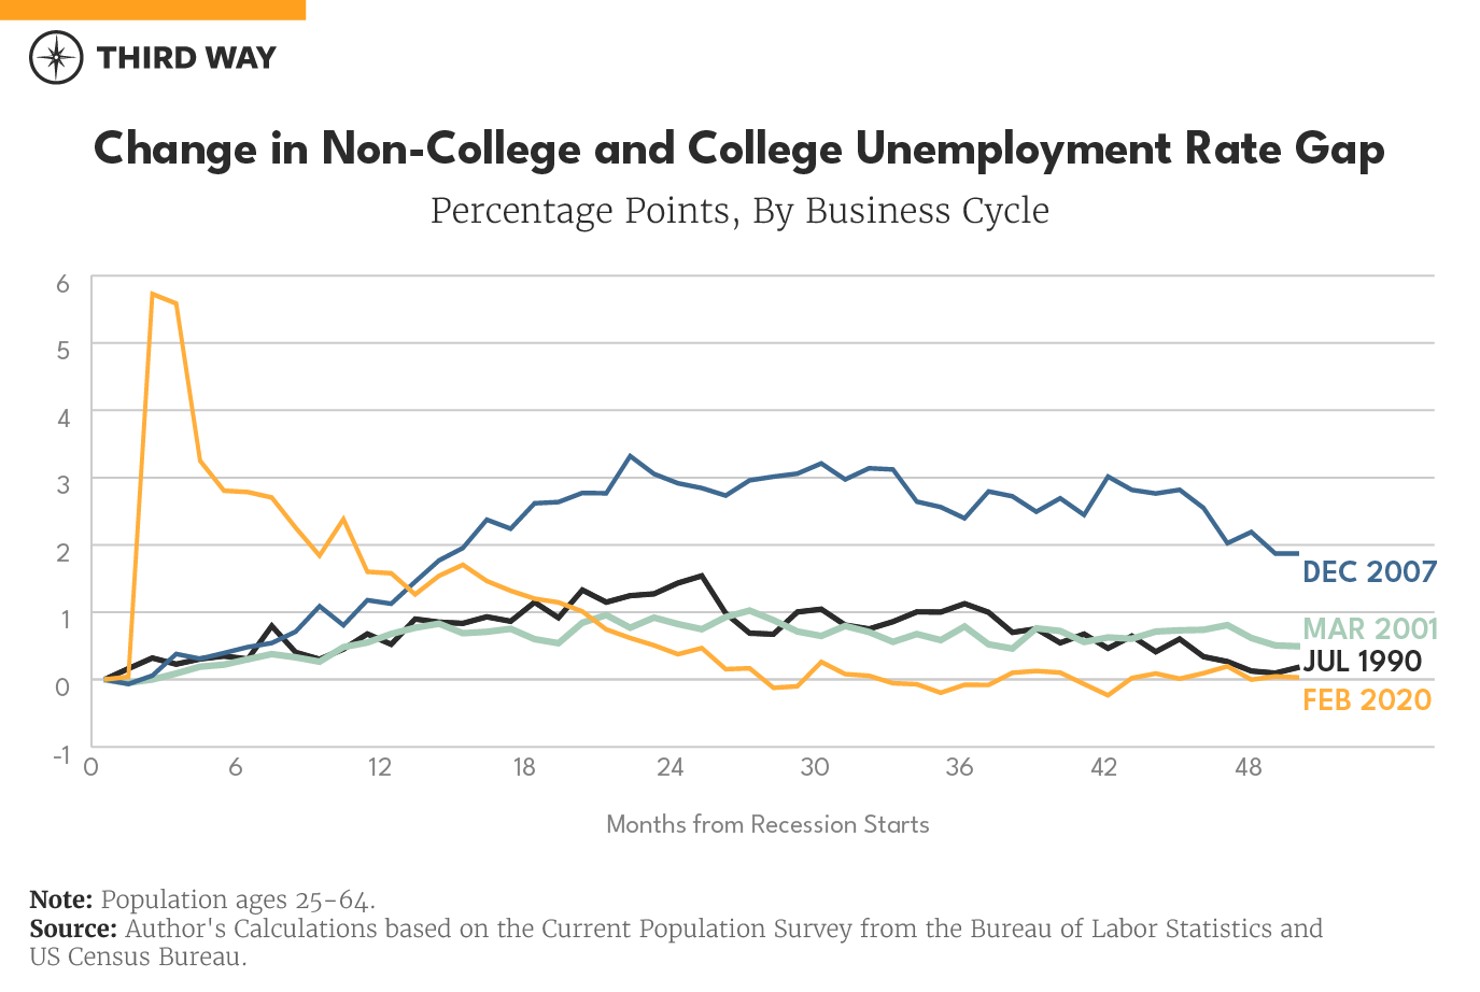
Most recessions hit Americans without a four-year college degree harder.3 Unemployment for those without a college degree tends to grow more and stay larger compared to those with a four-year degree. For example, two years after the Great Recession started, the non-college unemployment rate had grown by three percentage points more than the college unemployment rate.4
This pattern has many underlying causes:
- Industry Sectors: Non-college workers are more likely to be employed in industries that are sensitive to economic downturns, such as manufacturing, retail, and hospitality. In downturns, job losses in those industries tend to be more extensive.
- Networks: Non-college workers have narrower professional networks that act as safety nets for workers looking for a new job.
- Work from Home: Less access to remote work options may make non-college workers more vulnerable to layoffs and cut hours. This was particularly the case in the early months of the pandemic.
- Technology: Non-college workers are also disproportionately employed in jobs where technology is less central. Longer-run shifts towards technology-oriented occupations and industries may accelerate during recessions. Low-technology firms are likelier to close and not reopen and firms, broadly, are likelier to eliminate low-technology jobs and not replace them.5
- Retraining: The lack of a consistent and strong retraining system in the United States makes it more difficult for workers to get the skills needed for growth industries and bounce back quicker in recessions.
The (Extraordinary) Pandemic Experience
The pandemic recession started with this familiar story. Between February and April 2020, the non-college unemployment rate rose over five percentage points more than the college rate. Roughly 4 million non-college workers 25-64 became unemployed during this time.6
But while the pandemic was extraordinarily difficult in many ways, as time went on, it turned out to be extraordinary for non-college workers in a different way. Along several important economic yardsticks, non-college workers outperformed their counterparts with college degrees. Non-college unemployment fell at a similar pace to college unemployment, and in less than three years, their gap was back to pre-pandemic levels, a faster pace than the prior three recessions. Wage growth has been higher too: non-college wages adjusted for inflation have grown by 4.6% over the course of the pandemic, higher than the 3.3% for college workers. Inflation-adjusted wealth has grown by 5.5% for non-college households, versus 4.8% for college households.7
This outcome is surprising on its face as recessions generally hit non-college families harder. The key factors that made the pandemic different for non-college workers are the nature of the shock itself and the magnitude of the policy response.
First, while the pandemic affected almost every facet of American economic life, in its early stages it was most likely to stop in-person service work. Leisure and hospitality employment was cut in half between February and April 2020, representing a loss of 8.2 million jobs.8 These sectors tend to be disproportionately non-college. In the midst of these closures, furloughs, and lockdowns, many affected workers switched jobs or even industries to ones with lower chances of work stoppages and public health risk. The consequence was that when in-person services attempted to reopen, they faced a severe labor shortage. As a result, workers who stayed in those jobs or chose to come back–again, primarily non-college workers–saw strong wage gains in a short amount of time.
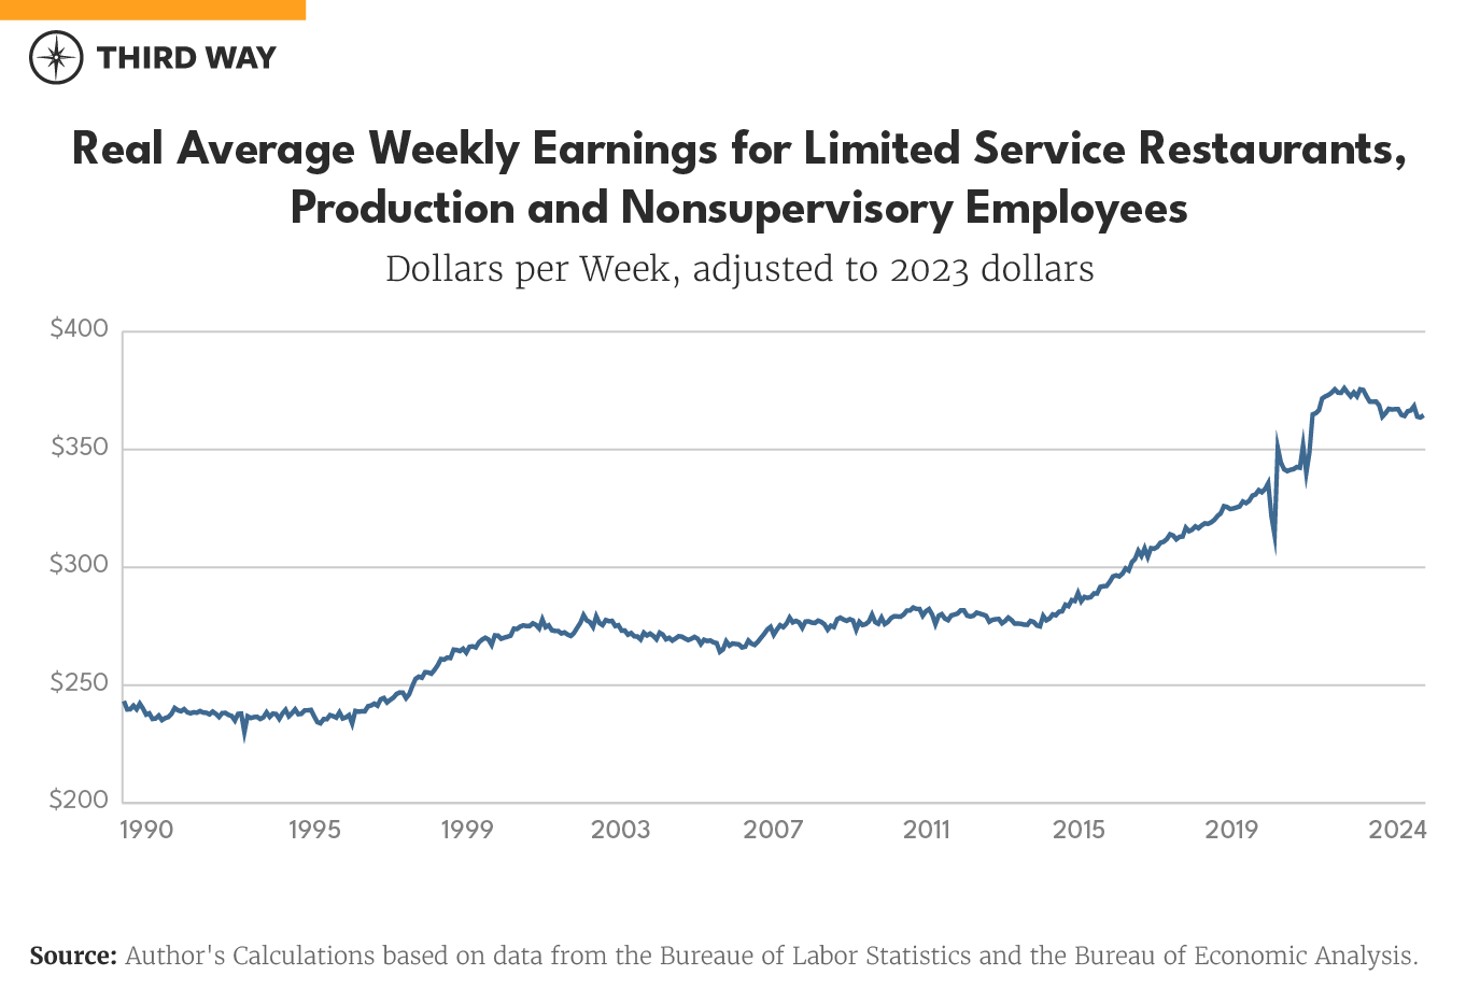
Take for example the fast food industry. In the last six months of 2019, just before the pandemic, a non-managerial fast food worker made on average $330 per week in inflation-adjusted 2023 dollars. By the last six months of 2020, this average wage had risen to $342 a week. And then by the end of 2021, it had shot up to $374.9
This labor shortage dynamic was different from prior recessions. Downturns usually cause disproportionate layoffs to non-college workers, so non-college workers tend to be in ample supply when industries recover later on, which limits wage growth. In the pandemic, however, many laid off or furloughed workers found other jobs, which put pressure on reopening services to raise wages. These higher wages strengthened family finances and balance sheets, kept debt loads low, and made them better off economically.
The second reason the pandemic was different—and a key factor in allowing non-college workers to stay secure and find new jobs in the first place—was that government support for the economy was stronger. The International Monetary Fund estimates that US pandemic-related fiscal support totaled $5 trillion, the equivalent of almost a quarter of 2020 GDP and more than other advanced nations.10 Monetary policy was also more aggressive than in past recessions: the Federal Reserve cut rates to zero and began quantitative easing on March 15, 2020, before the spike in unemployment insurance claims began the following week.
The massive support boosted consumer demand and made the subsequent economic recovery stronger. The inflation-adjusted size of the US economy is now 8.7% larger than it was just prior to the pandemic, by far the strongest recovery in the G7. The next best G7 performer, Canada, has seen cumulative growth of 4.5%, just over half that of the United States.11
In addition, the US response was geared toward low-wage workers, which are disproportionately non-college. Typically, the US unemployment insurance system replaces half the worker’s wage for six months, though these vary by state and worker experience. The pandemic relief legislation increased this in many cases to a 100% wage replacement rate or even more. It also enacted, for the first time, similar payments for gig economy workers. As a result, unlike prior recessions, laid off workers were made whole in the worst months of the pandemic. The expanded payments then rolled off as COVID-19 became less of a binding constraint on work.
Other pieces of relief were more likely to go to non-college workers as well. The relief checks passed in March 2020, December 2020, and March 2021 were all targeted to working-class families. Much of the augmented Child Tax Credit passed as part of the American Rescue Plan also went to non-college families.
The Pandemic Dashboard: How Non-College America Recovered
Major economic indicators (as shown in the graphic at the top of the report) show that working age non-college Americans have seen major economic improvement since the recession.
Unemployment rate. The unemployment rate is one of the most widely-used metrics to gauge the health of the labor market. Since 1976, the unemployment rate for workers 25-64 without a college degree averaged 5.9%, three percentage points higher than for those with a college degree. However, both the non-college unemployment rate itself and the gap against the college rate are much lower than this long-run average as of early 2024. Non-college workers had an unemployment rate of 3.9% in April 2024, versus a college unemployment rate of 2.1%—a wedge of 1.8 percentage points.12 This gap is slightly higher than the 1.7 percentage point difference averaged over 2018-19 and slightly lower than the 1.9 percentage point difference averaged over 1999-2000 in the hay day of the dot com boom. In other words, judged by the unemployment rate, the labor market for non-college workers right now is roughly on par with the late 1990s.13
Employment-to-population ratio. The employment-to-population ratio measures the share of the entire population–not just those in the labor force–with a job. In April 2024, about 71% of workers 25-64 without a college degree were employed, versus 85% of workers with a degree. This recent non-college rate is the highest since mid-2008 and about half a percentage point higher than its 2018-19 average, suggesting that non-college employment has fully recovered from the pandemic. However, the non-college employment-to-population ratio is well below its 1999-2000 average of 74%. Some of this longer-run decline happened because the non-college population has gotten older on average and is therefore less likely to be employed.14 But much appears to be driven by factors lowering demand for non-college workers, such as skills-biased technological change. One signal of this reason is the gap with the college employment-to-population ratio, which has been closing since the depths of the pandemic but is still roughly two percentage points wider than its 1999-2000 average.15
Real Wealth. At the end of 2023, the wealth of the average household headed by a non-college person stood at $482,000 in 2023 dollars, a higher level of real wealth for non-college households than any pre-pandemic period. Real non-college wealth increased by $25,000 in inflation-adjusted 2023 dollars between 2019 Q4 and 2023 Q4, a 5.5% rise. In fact, in percent terms, non-college households have seen stronger wealth growth than college households, whose average real wealth grew by 4.8% over the same period. Strong pandemic relief bolstered the savings of non-college families, who then only gradually spent it down: in real terms, average cash deposits for non-college households have fallen roughly back to pre-pandemic levels.16 Most of the persistent increase in wealth comes from increases in home values. In 2022, 62% of Americans 25-64 without a four-year degree owned their homes.17
Real Wages. As mentioned earlier, the pandemic has been extraordinary among recent US recessions in the growth of non-college wages. In 2019, the typical non-college worker aged 25-64 earned $829 a week in inflation-adjusted 2023 dollars. Over the four quarters ending in 2024 Q1, their weekly earnings were $867, a 4.6% increase and higher than any pre-pandemic quarter on record. In contrast, college workers have seen a 3.3% increase in real median weekly earnings since 2019. The stronger performance of non-college wages is in stark contrast with the Great Recession when real college wages consistently grew faster than non-college wages.18
Health insurance coverage. In 2022, almost 17 million Americans ages 25-64 without a college degree lacked health insurance coverage, a noncoverage rate of about 16% that year. That said, the 84% coverage rate for workers without a college degree is the highest on record. The sharp expansion of health insurance coverage for non-college Americans occurred between 2013-16 as the Affordable Care Act went into effect. And while coverage for this group slightly declined under President Trump, it has more than recovered under President Biden, in part due to expansions of the Affordable Care Act subsidies in the American Rescue Plan Act and Inflation Reduction Act. The coverage rate for college graduates is still 11 percentage points higher, but this is the narrowest college/non-college gap for the 25-64 population since American Community Survey health coverage data began in 2008.19
Consumer sentiment and inflation expectations. Despite the relatively strong performance of non-college workers during the pandemic, consumer attitudes have not fully recovered by some measures. Data from the widely followed University of Michigan Survey of Consumers, for example, suggests typical sentiment is still a third lower for non-college Americans ages 25-64 than it was pre-pandemic in 2019, versus 20% lower for those with a college degree. Clearly, this is a challenge for Democrats as they rightfully want to trumpet major economic progress for non-college America.20
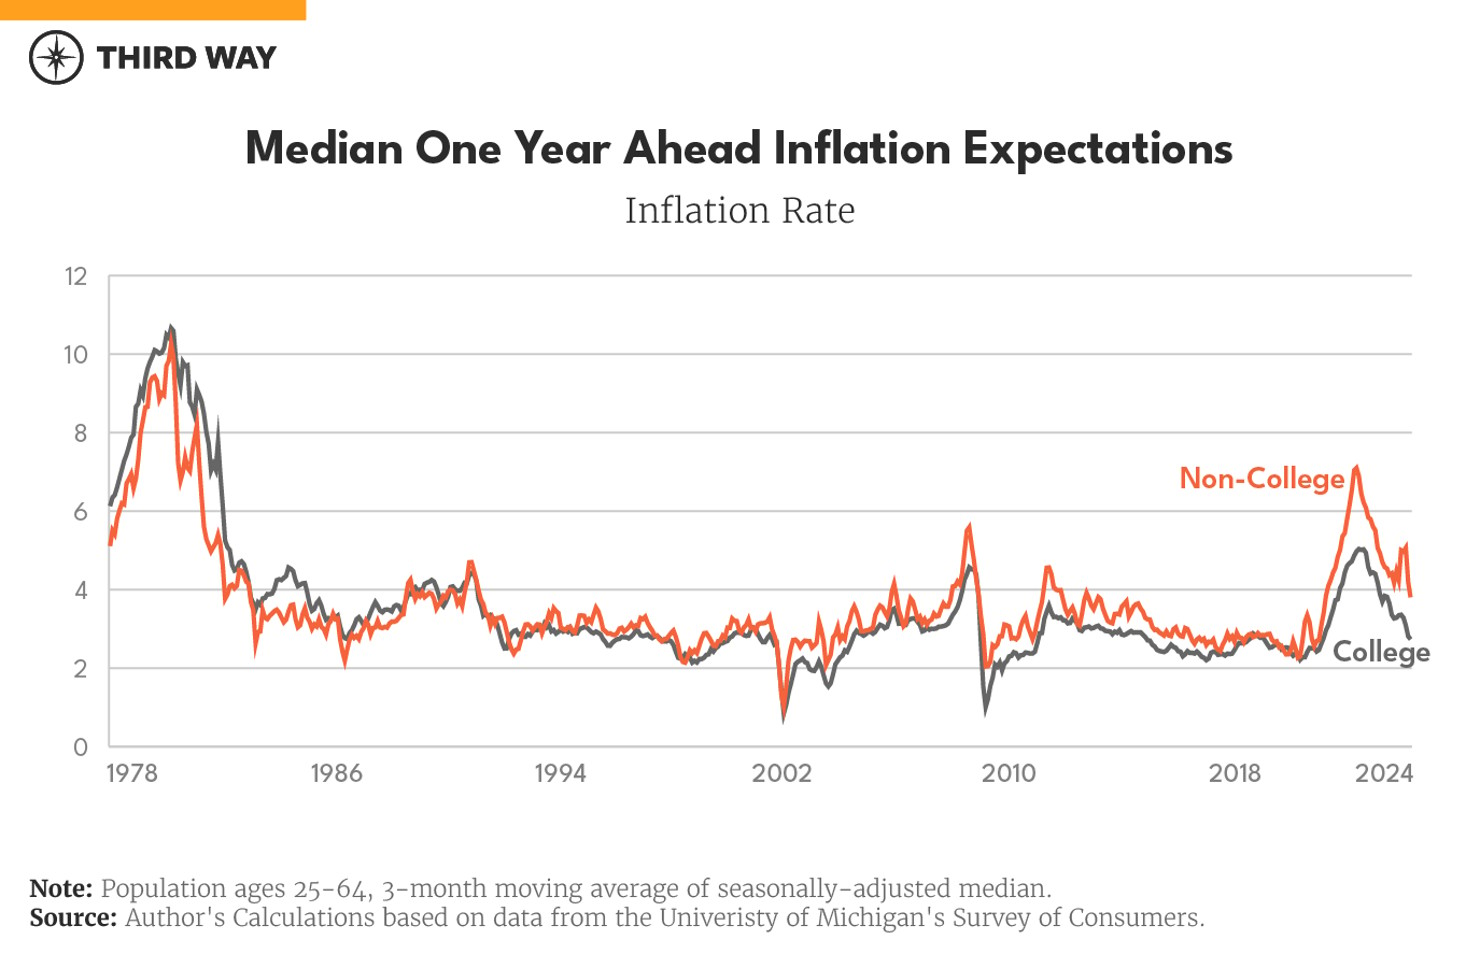
There are several possible reasons for this weakness in sentiment. Although inflation–the growth in prices–has moderated, price levels remain high relative to wages, especially for key items like groceries and fast food. It is difficult to parse in official inflation data whether the prices that non-college Americans face have grown faster than those for college graduates. One circumstantial piece of data suggesting that they did is inflation expectations in the University of Michigan survey. Since actual prices inform inflation expectations, the differences in expectations may in part reflect differences in experienced inflation between non-college and college Americans. One-year ahead inflation expectations for non-college Americans are still 1.2 percentage points above their 2019 average, versus 0.2 percentage points for college Americans. That said, inflation expectations for non-college Americans have been cut almost in half from their peak in early 2022.21
Another potential reason for the slow recovery in sentiment is that consumers underweight wage growth when evaluating their well-being. Recent work by economist Stefanie Stantcheva finds that most consumers think inflation consistently exceeds wage growth, even though actual data suggest the opposite.22 Moreover, people tend to attribute the nominal raises they do see entirely to their own merit rather than partially due to inflation adjustment. This explains why strong real wage growth may not register on these surveys.
Finally, sentiment in the University of Michigan survey is a composite of answers to questions about past and future household finances and national business conditions. Questions about the labor market and unemployment are not part of University of Michigan sentiment.
Conclusion
Americans without a college degree have faced a variety of ongoing economic challenges over the last several decades. The pandemic brought new challenges. But the pandemic recovery was an extraordinary period for non-college Americans; real wages and wealth growth outpaced that for college graduates, and the unemployment rate gap closed substantially faster than in prior recessions. Nevertheless, while non-college Americans weathered the storm better than expected, many of the same ongoing challenges remain.