Report Published February 23, 2022 · 17 minute read
Understanding the Diversity of Asian American Voters
Asian American communities in the United States have been booming over the last decade—as has the political impact of Asian American voters. According to the 2020 United States Census, the percent change of Asian Americans in the population, either alone or in combination with another race, grew a staggering 38.6% from 2010 to 2020.1
As of 2020, Asian Americans now make up 7.2% of the total United States population: 20 million Americans. There are 4.1 million Americans of Chinese ancestry, 4.0 million Americans of Indian ancestry, 2.9 million Americans of Filipino ancestry, 1.8 million Americans of Vietnamese ancestry, 1.5 million Americans of Korean ancestry, and 770,000 Americans of Japanese ancestry. These six origin groups make up 85% of all Asian Americans across the country.
When one talks about how the booming Asian American population is shaping American politics, it is important to remember that Asian voters are not a monolith, and that understanding distinctions between even just these six groups can help explain the impact a growing Asian population could have on the politics of a district or state.
Asian American Voters
Asian American voter turnout rose 45% from 2016 to 2020 according to data from the AAPI Victory Fund. 2
However, Asian American voters only made up around 4% of the 2020 electorate, about 50% of their share of the total population.
So, when talking about the Asian American community and the Asian vote, it is important to remember both the potential and scope. Asian American voters are a booming minority group, with the ability to continue to grow rapidly in share of the electorate. This is because Asian Americans are currently underrepresented compared to their share of the population, so efforts to continue to increase turnout among Asian American voters is a worthwhile endeavor. At the same time, significant changes in the White or Black vote will swamp any gains made with the burgeoning Asian population. Though, many elections are decided by smaller margins than the share and potential share of the Asian American vote, still making them decisive in many cases.
The Asian American vote went for Joe Biden by a large margin with sources varying on how much. Media exit polls showed Biden winning the Asian American vote by a 61% to 34% margin.3 The more comprehensive Cooperative Election Study (CCES) data showed Biden winning the Asian American vote by a 66% to 31% margin.4 (CCES surveyed 1,235 Asian American voters while media exit polls surveyed somewhere around 625).
Neither of those sources had a large enough sample size to be able to pull out specific Asian national origin groups with confidence, but a pre-election national survey did.
That survey of 1,500 Asian American voters from AAPIData suggested that Biden was leading in the Asian vote by a 54% to 30% margin, with 15% undecided. This is in line with pre-election CCES data that had Biden leading Trump 50% to 29%. The difference between those margins and exit polls or post-election surveys suggests that either Biden closed well with Asian voters, or pre-election surveys of Asian voters had a pro-Trump response bias, which was the opposite of most pre-election surveys.5
Nonetheless, this larger survey provided important insights into how different Asian groups broke. Groups that tended to be more Democratic than average were Indian American (65% to 28% Biden), Japanese American (61% to 24% Biden), Korean American (57% to 26% Biden), and Chinese American (56% to 20% Biden).
Groups that tended to be more Republican than average were Filipino American (52% to 34% Biden) and Vietnamese American—the only one of the six biggest groups that was under 50% for Biden (48% to 36% Trump).
These national origin groups brought out some of the widest distinctions among the Asian American voters, though other demographic factors also drove differences. For example, according to CCES, Asian women supported Biden 67% to 30% while Asian men supported Biden 63% to 32%, which continues the long-standing gender gap we see among all races—though the difference is minor compared to those between national origin groups.
On the other hand, education proved to be a major diving line in Asian American communities. Asian Americans with a college degree supported Biden by a 71% to 27% margin, while Asian Americans without a college degree only supported Biden by a 59% to 38% margin.
On the other hand, education proved to be a major diving line in Asian American communities. Asian Americans with a college degree supported Biden by a 71% to 27% margin, while Asian Americans without a college degree only supported Biden by a 59% to 38% margin. Asian Americans are the only racial or ethnic group besides White voters to have an education gap in 2020 according to the CCES data. Black and Hispanic voters with a college degree were only one point more likely to vote for Biden than those without a college degree. Of course, White voters have a huge education gap, basically double the size of the Asian one.
In fact, this educational divide may help explain Asian national origin group voting patterns. According to Census data, there is wide divergence between the proportion of bachelor’s degree attainment when you drill down by national origin. A whopping 75% of Indian Americans have a bachelor’s degree, while that number is 57% among Chinese Americans and Korean Americans, 52% among Japanese Americans, 48% among Filipino Americans, and only 32% among Vietnamese Americans.
Other than extra strength among Japanese American voters for Democrats, this tracks well with the breakdown of the 2020 vote. The outlier could be partially explained by the fact that Americans of Japanese descent are overwhelmingly (73%) U.S. born, compared to the Asian community average of 43%. The next closest group is Filipino Americans at a 50/50 split, though it is important to remember that the Philippines was an American colony for almost 50 years until 1946.
Just as among voters of every race and national origin, other demographic characteristics seem to be predictive of voting pattern distinctions among Asian American voters. Now let’s take a look at where voters live and how that impacts elections.
California: Chinese American voters in the Bay Area, Vietnamese in Orange County
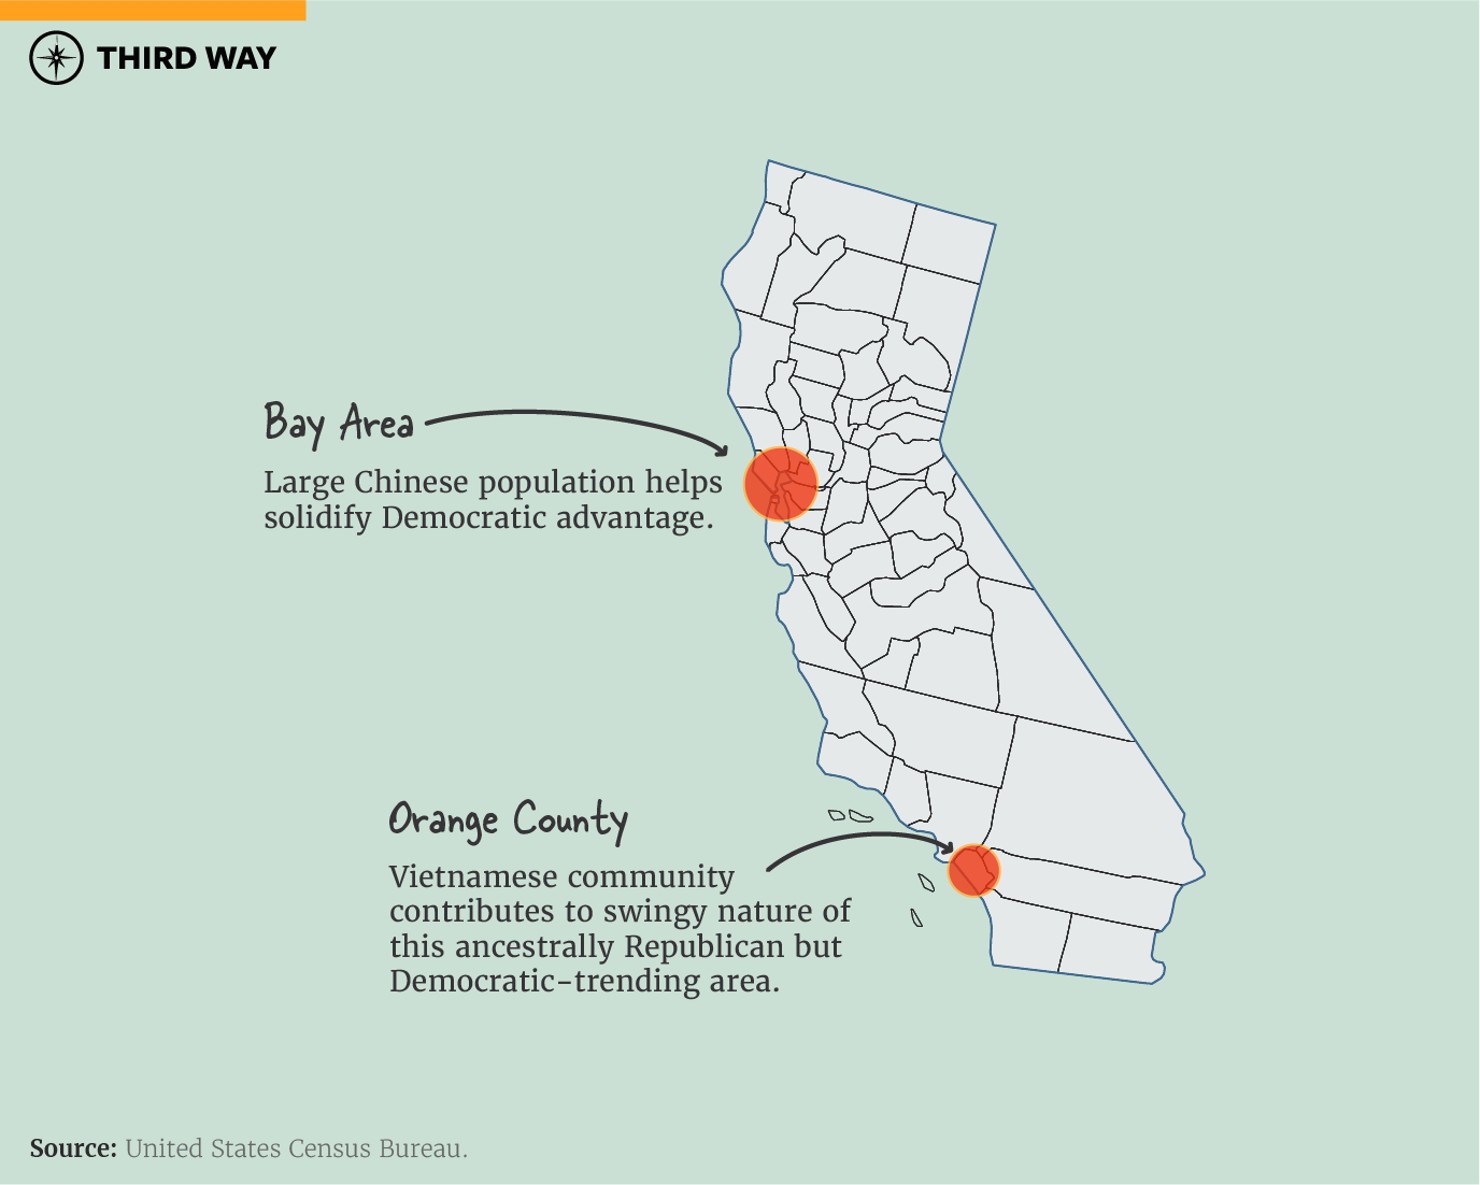
California is a reliably Democratic state, but one where Democrats felt they fell short in Congressional races in 2020 by losing several districts that Biden carried at the top of the ticket. According to the 2020 Census, California is home to just over 7 million residents of Asian descent, meaning just under 30% of all Asian Americans live in the state.
The Los Angeles, San Francisco, and San Diego metropolitan statistical areas (MSAs) help contribute to California’s large and diverse Asian population. San Francisco is a top three destination in the country for all six national origin groups, as the 2nd most popular residence for Americans of Chinese, Indian, Filipino, and Vietnamese descent, and the 3rd most popular for Americans of Korean and Japanese descent. Los Angeles clocks in at 1st place for Americans of Filipino, Vietnamese, and Korean descent, 2nd for Japanese Americans, and 3rd for Chinese Americans. San Diego is 5th for Americans of Filipino descent. These hubs contribute to a diverse Asian American population in the state: overall, California’s Asian community population is 29% Chinese American, 26% Filipino American, 13% Indian American, 10% Vietnamese American, 8% Korean American, and 7% Japanese American.
The liberal San Francisco Bay Area hosts a very large Asian population as well as the only majority-Asian congressional district on the United States mainland. The urban core four counties have a combined Asian population of about a third of the total population of 7.76 million. The more urban parts of the Bay Area are plurality Chinese American, with Filipino Americans representing the second largest group. The more suburban parts of the area still have a Chinese American plurality, but Indian Americans make up the second largest group. The Asian population in this MSA are contributing significantly to Democratic dominance in the region.
The Los Angeles MSA has a more modest but still robust Asian population, and the differences could have helped contribute to some Democratic losses in Orange County last cycle. The Vietnamese community is the sixth largest Asian population in Los Angeles County, but it is the single largest in Orange County—where Democrats lost two House districts as Biden carried them. It is worth noting that Orange County is 22% Asian with heavy concentration in the northern end of the county. The Vietnamese community in Orange County especially appears to be heavily concentrated in the northern end of the county, which is where both congressional districts Democrats lost are located. Two Korean American Republican women flipped districts in northern Orange County from blue to red by running on anti-socialism rhetoric that could have appealed to the large Vietnamese population in this area as much of the that community came after the Vietnam War, and many were American partners. In this way, it is helpful to think of Vietnamese voters as like Cuban or Venezuelan voters when talking about Latino voters.
While CCES data says ticket-splitting was minor among all Asian voters nationwide, ticket-splitting was relatively high in these two districts, and it’s possible that both Biden and Congressional Democrats lost Vietnamese voters in Orange County, but that the down ballot-candidates did worse against Republican congressional candidates who had greater appeal to the community than Trump.
Nevada: Filipino Majority Aids Swing State Status
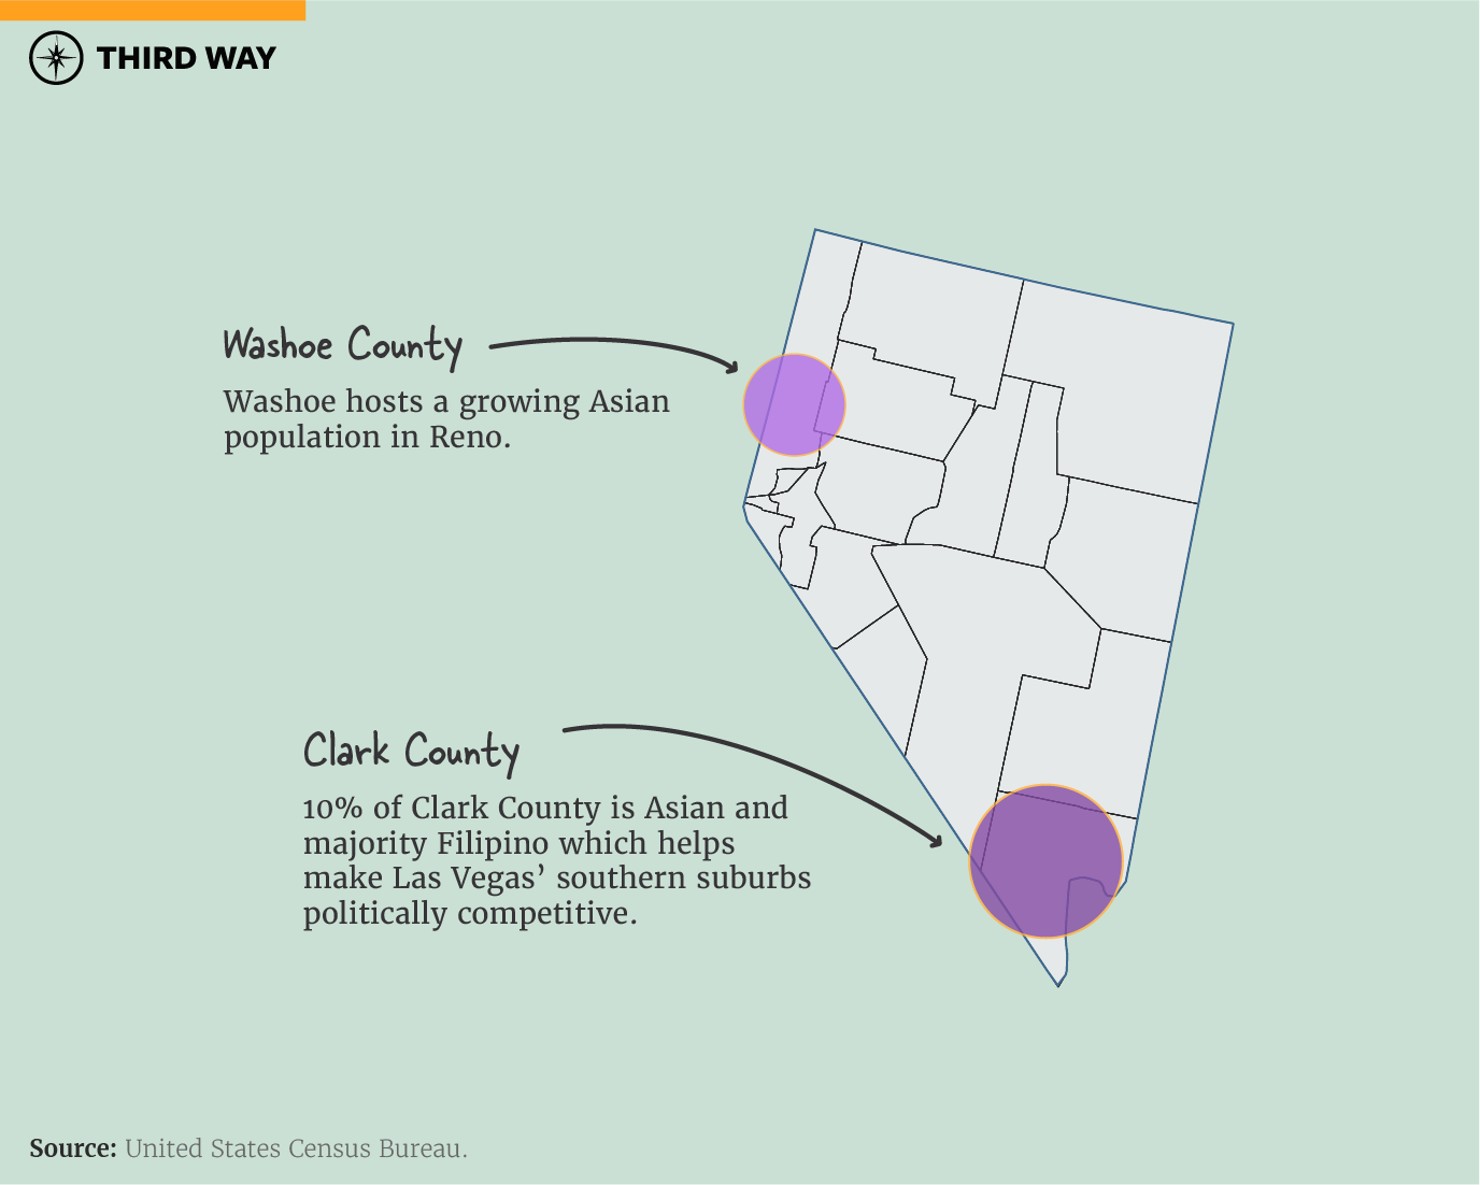
Nevada is a perpetual purple state having voted for Hillary Clinton and Joe Biden by nearly identical 2.4-point margins and having elected two Senators and two of their four House members by under 5 points in each of their last elections.
Nevada’s Asian population, like its population writ large, is heavily concentrated in the Las Vegas MSA, with some number also residing in the Reno MSA.
Filipino Americans, a swing voting group, make up well over half of Nevada’s Asian population of just over 350,000. The largest concentration of Filipinos is in Las Vegas’ southern suburbs like Henderson, which is a more politically-competitive part of the county.
At this point, Las Vegas County is just over 10% Asian, but the swing-voter status of the large Filipino American population may be partially driving the fact that the state remains purple, and not as blue as its diversifying population might otherwise suggest.
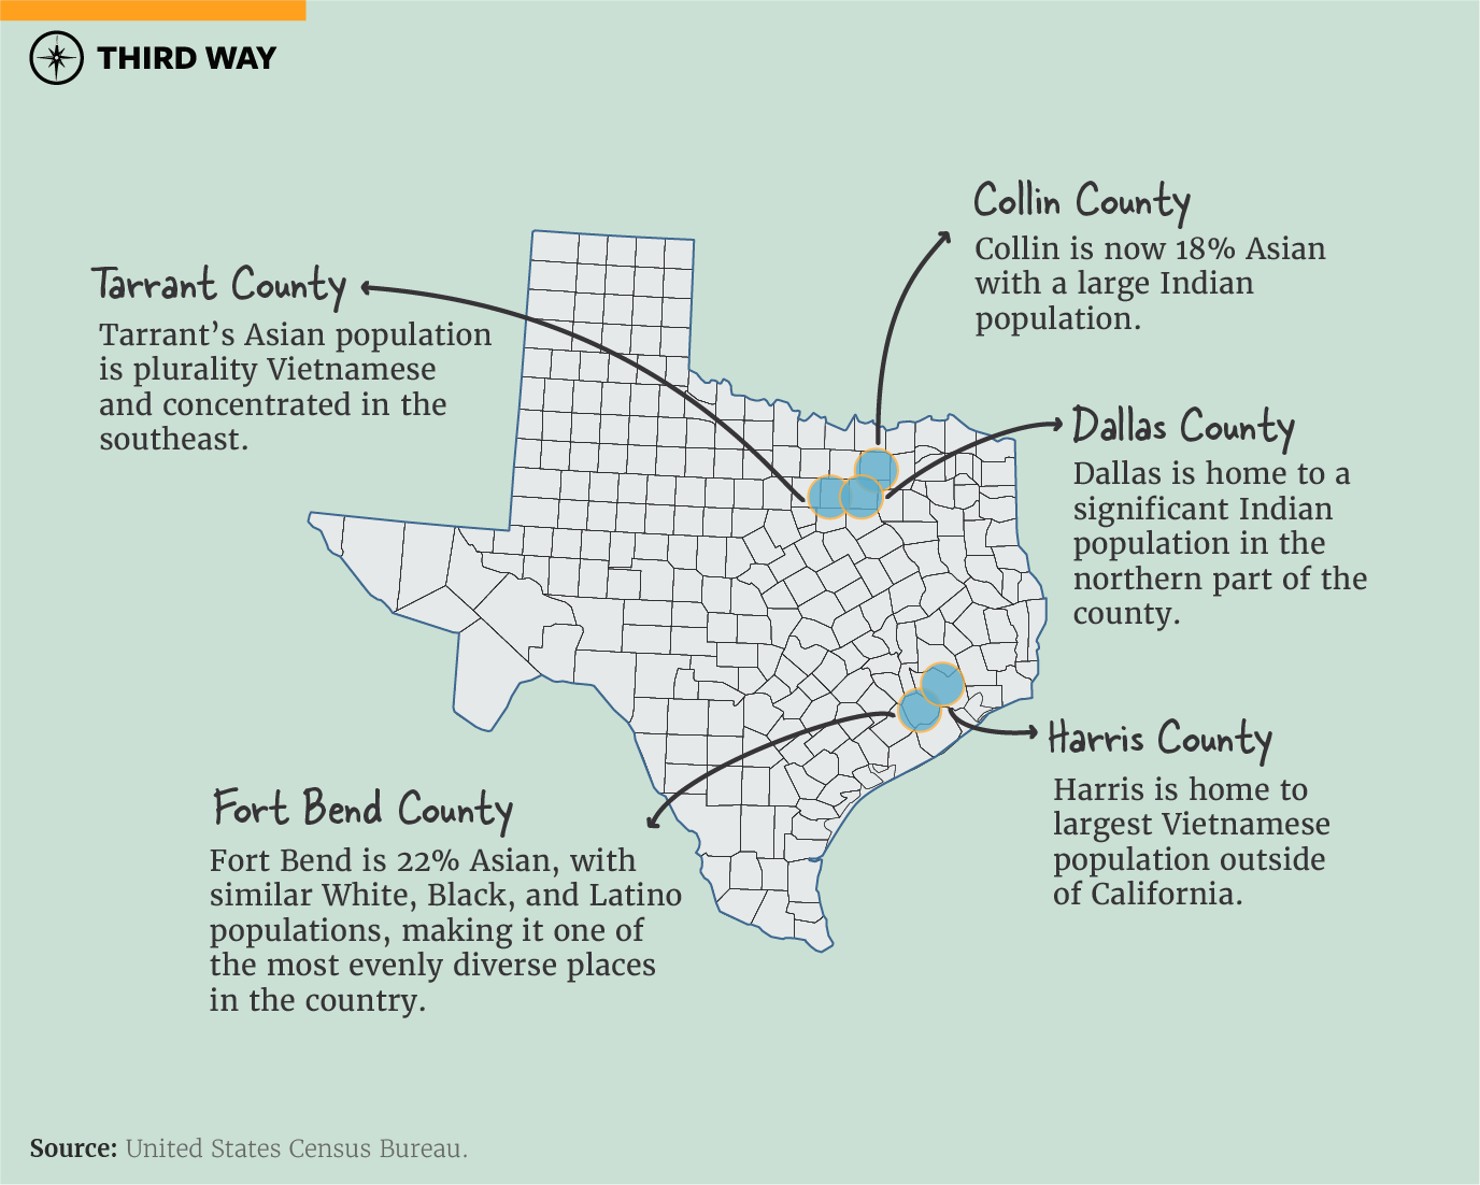
Texas: Large Indian & Vietnamese Populations
Texas has been trending Democratic for the past decade, but at a slow pace that infuriates Democrats.
Luckily for the party, though, the largest group of Asian Americans in Texas is the Indian American community, which makes up around a third of the total Asian population in the state of 1.85 million. Most of the growth among Asian American populations here has been in the suburbs like the Dallas MSA’s Collin and Denton Counties and the Houston MSA’s Fort Bend County.
The Dallas MSA has the 4th largest Indian and Vietnamese communities in the country, while the Houston MSA has the 3rd largest Vietnamese community. Collin County is now 18% Asian and Fort Bend County is 22% Asian.
In political contrast to the influence of Indian American voters, the Vietnamese community makes up the second largest Asian national origin group in Texas, at about a fifth of all Asian Americans in the state. Americans of Vietnamese descent are the plurality of Texans of Asian descent in both Harris and Tarrant Counties, which are the biggest and third biggest counties in the state and home to Houston and Fort Worth. Dallas County, the second largest county, is plurality Indian among Texans of Asian descent.
Like California, Texas was home to another Biden-House Republican won district with a sizable Asian population, this time in the Dallas suburbs. However, unlike in Orange County, Democratic support in heavily Asian areas in Texas’ 24th congressional district appeared solid for Democrats as Biden and the House Democrat carried them by large margins. Most of the Asian American population in this district appears to come from Dallas’ Indian American community, with very little of the Asian American population residing in the Tarrant County part of the district. Biden and the Democratic nominee both won the Dallas portion handily, and there appeared to be little ticket-splitting in that area. But ticket-splitting was more common on the Tarrant side, which they both lost, though Biden did much better (and well enough to win the district overall). Therefore, unlike Orange County, in Dallas, there is little evidence of ticket-splitting among Asian voters based on precinct results.
While the growth of the Indian American population has helped accelerate the state’s bluing, part of why Texas may be slow to become fully purple is its sizable Vietnamese community—which remains a battleground voting bloc.
Georgia: Smaller Than Texas, but Better Demos for Dems
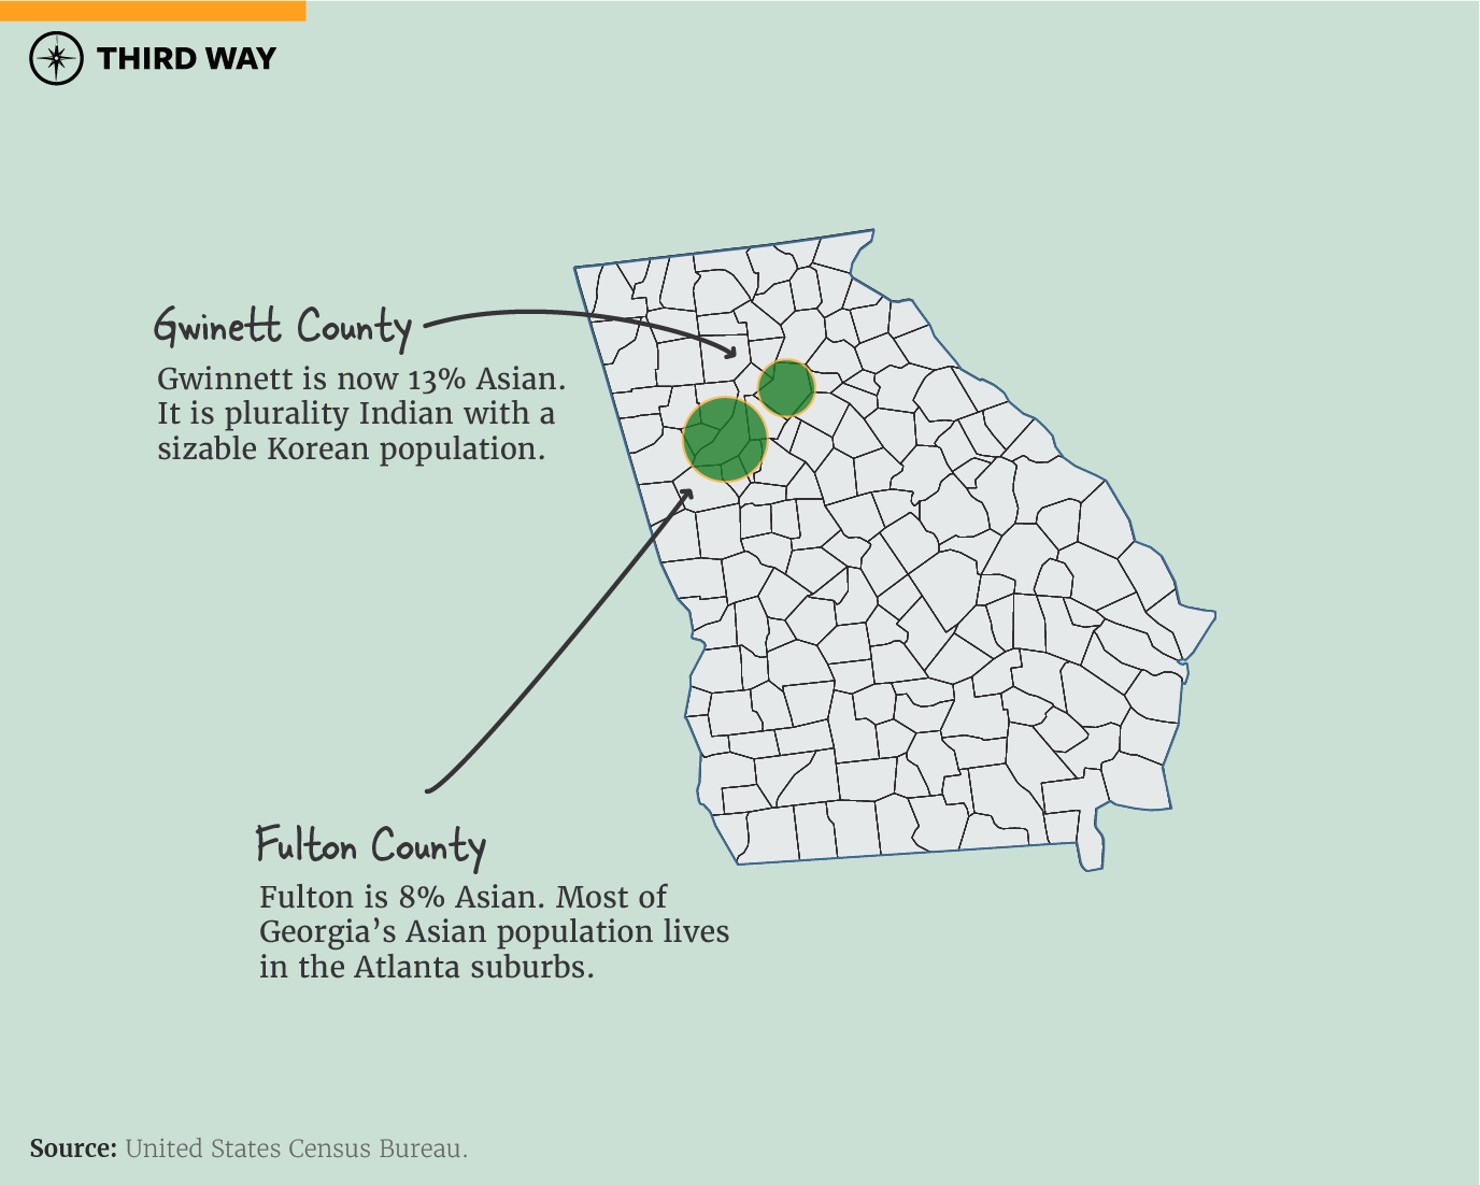
Texas’ Asian population may be exploding in growth, but it is probably Georgia which best demonstrates how a relatively small swath of Asian American voters can make a difference in a swing state.
Georgia’s Asian population is heavily concentrated in the Atlanta MSA. Suburban Gwinnett County, which has flipped from heavily Republican to heavily Democratic in just a decade, is now 13% Asian American—with an Indian American plurality and Korean Americans as the next largest group. Fulton County, which hosts Atlanta, is now 8% Asian, while DeKalb is 7% and Cobb is 6%.
Georgia’s Asian American population is about a third Indian American, similar to Texas. But only about 15% of Georgia’s Asian American residents are Vietnamese—w hich is the same percentage as Chinese Americans and Korean Americans combined. Those latter two more Democratic-leaning groups, combined with the fact that only one large MSA houses most of the state’s Asian American voters, has helped Georgia Democrats benefit more than their Texan counterparts.
Midwest: Small but Democratic-Friendly Asian Groups
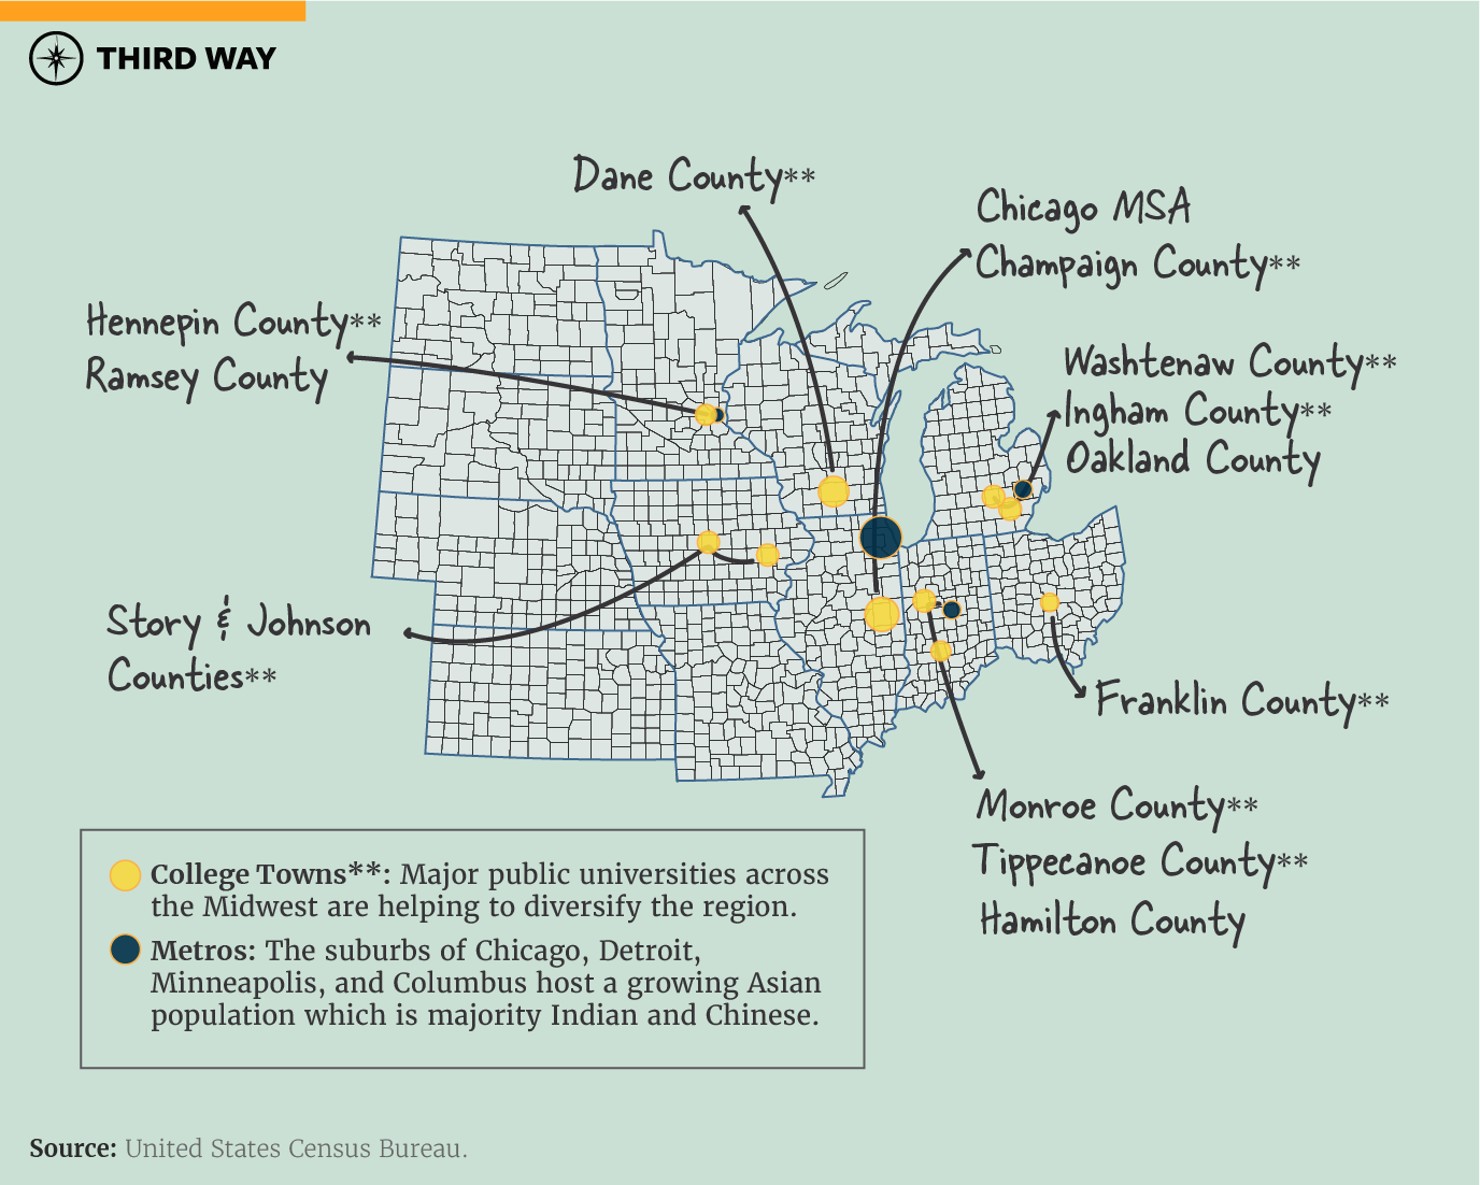
The Midwest houses the smallest Asian population of any region in the country. The Chicago MSA hosts the 3rd largest Indian population in the country, but it is the only MSA in the top five of any of the six groups discussed throughout.
But as the Midwest becomes home to states that most often are tipping points for control of the federal government, Democrats must pay special attention to the growing Asian population, which has helped deliver them critical statewide wins, without which, they wouldn’t control the White House or Senate.
That is because the Midwestern Asian population is heavily Indian and Chinese, two groups that lean heavily Democratic. Across the region, these populations are typically concentrated in counties that house large public universities.
In Illinois, the Indian community is the plurality with about a third of the population while Chinese slightly edge out Filipino, but both are around a fifth of the population. The most Asian county is Champaign which hosts the University of Illinois. Champaign County is 12% Asian.
Of course, the Chicago MSA has a large Asian population with Cook County up to 8% Asian, DuPage at 13% Asian, Lake at 8% Asian, and Will at 6% Asian. Illinois’ plurality Indian community is thanks to them being by far the largest group in the Chicago MSA.
In Indiana, the Asian population is mainly Chinese and Indian with low numbers overall, but both Monroe County, home of Indiana University, and Tippecanoe County, home of Perdue University, stand out. Monroe is 6% Asian and Tippecanoe is 7% Asian. Hamilton County in the Indianapolis suburbs is also now 7% Asian with large Indian and Chinese populations. Hamilton is still Republican overall but is zooming Democratic.
In Iowa, both Story County and Johnson County are 6% Asian. Both are plurality Chinese with the Indian population as the second largest. Story County hosts Iowa State University while Johnson County hosts the University of Iowa.
In Michigan, the Asian population is about a third Indian and a fifth Chinese. Washtenaw County, home of the University of Michigan, is 9% Asian and plurality Chinese. Ingham County, home of Michigan State University, is 6% Asian and plurality Chinese as well. Oakland County in suburban Detroit is also a popular residence for Asian Americans as 8% of that county is of Asian descent and its largest group is Michigan’s large Indian population. Undoubtably, these Democratic-friendly Asian populations in Michigan have helped Democrats in a state that has been a fierce battleground and have had a significant impact on competitive congressional races in Michigan’s 8th and 11th districts as the latter especially has a growing Asian population in the southern part of Oakland County.
In Minnesota, the Asian community is heavily concentrated in the Minneapolis MSA, where the University of Minnesota is also located, which is likely a draw as is the metro area’s booming economic opportunity. This area is unique in the country as a hub for refugees and therefore the Asian community goes beyond the six main groups discussed throughout.
A large Hmong exists in the area and are about 30% of Minnesota’s total Asian population. Ramsey County, home of Saint Paul, is 16% Asian and its two largest groups are Americans of Hmong and Burmese descent. AAPIData suggests that Hmong voters broke 74% to 21% in favor of Clinton in 2016 but there is insufficient data for 2020.6 Among Hmong and Burmese Americans over the age of 25, only 23% of each group has obtained a college degree making them some of the few Asian groups below the national average of 37%. This could be since both groups have included many refugees fleeing undesirable conditions in Southeast Asia, and therefore came to the United States with less initial wealth than even other Asian immigrant groups. Hmong Americans voting so Democratic bucks the educational trends of the six core Asian groups discussed throughout. This could be due to Democrats generally supporting greater funding for refugee communities to build a new life.
Hennepin County, which contains Minneapolis, is 8% Asian and plurality Indian, and four surrounding suburban counties all have substantial Asian populations; though, none as big as Hennepin and certainty not Ramsey. Hmong and Indian tend to be the largest throughout except in Scott County. Scott is by far the most Republican of the Minneapolis suburbs with a substantial Asian population. The plurality group is Vietnamese, which could contribute to its more Republican lean. Scott County is currently entirely within Minnesota’s 2nd Congressional district, which is the most competitive in the MSA.
In Ohio, the Asian community is centered in the Columbus MSA which is experiencing economic growth and is home to Ohio State University. Ohio’s Asian population is about a third Indian and just over a fifth Chinese. Franklin County, home of Columbus, is 6% Asian while Delaware County is 9% Asian. Delaware County is another example of a still Republican-leaning, but Democratic-trending suburban county in the Midwest.
Wisconsin’s Asian population is concentrated in Dane County, home of the University of Wisconsin in Madison. Dane County is 6% Asian, and the largest communities are Chinese followed by Indian.
Across the Midwest, it appears large, well-funded public universities are attracting Asian Americans, especially those of Indian and Chinese descent. This is also impacting the Chicago MSA, which houses the region’s largest Asian populations. These voters could be key lynchpins in Democrats’ efforts to keep their grip on this region, where their support among white non-college voters has been quickly eroding.
Virginia: Mostly Democratic Groups in NOVA, Swing Group in Hampton Roads
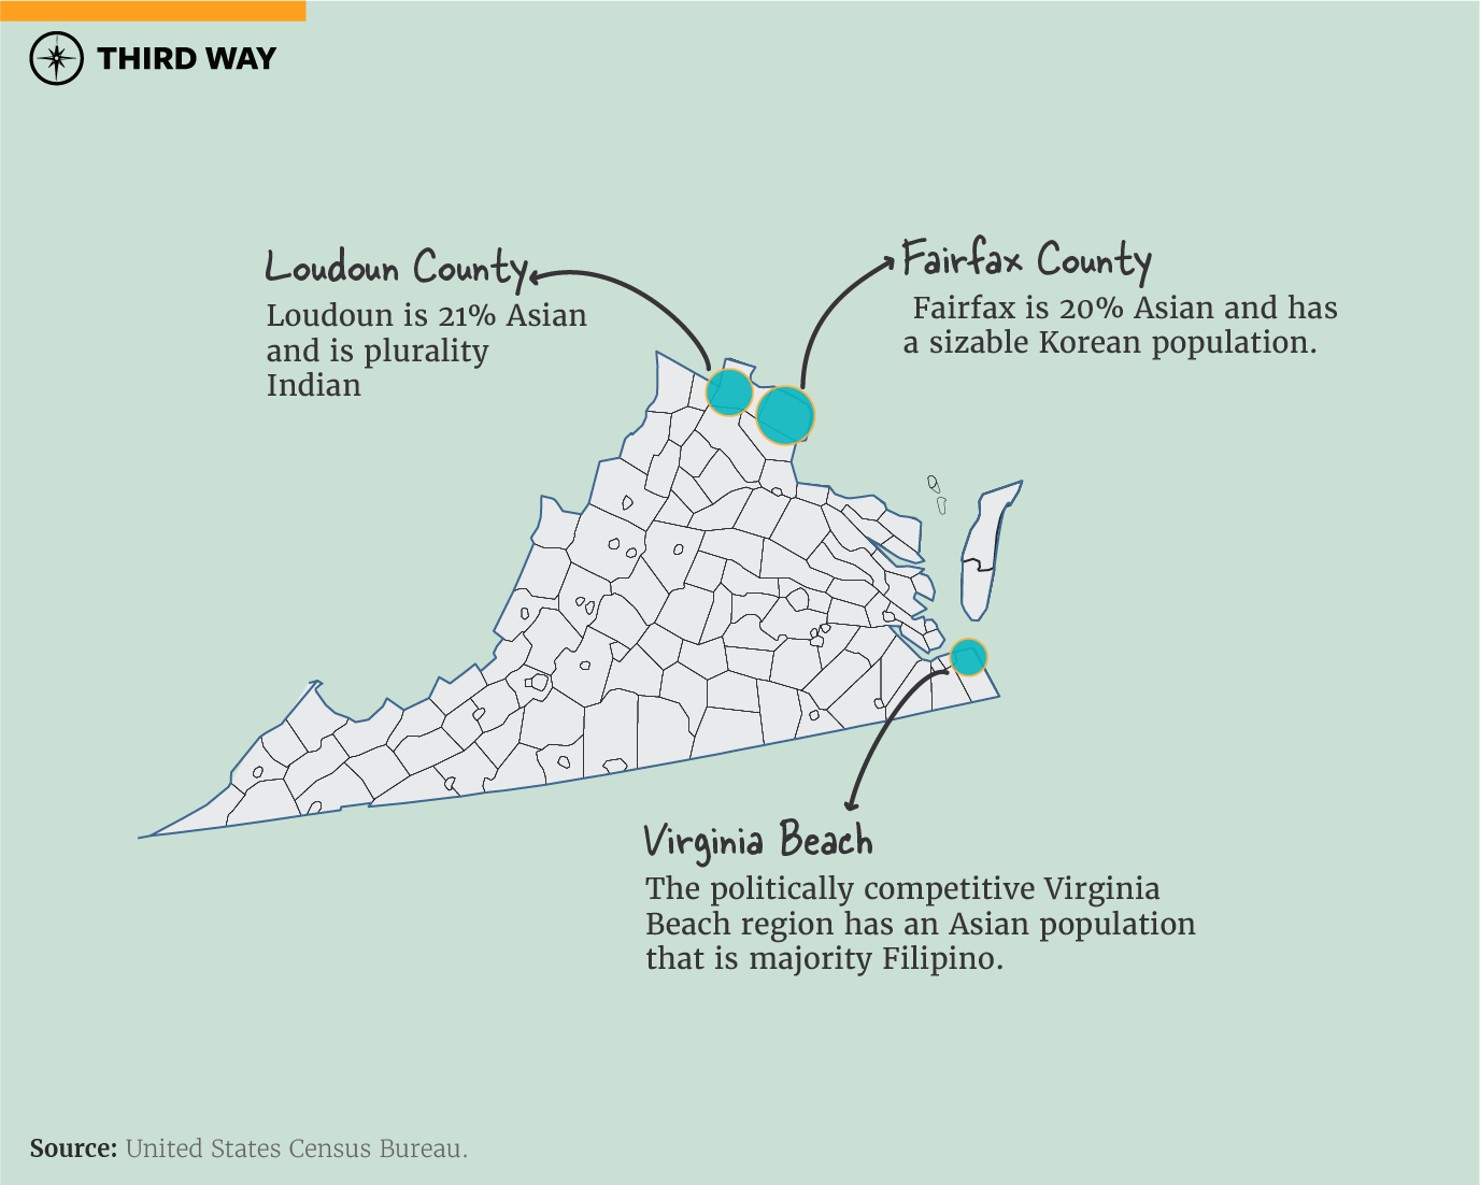
Washington MSA has the nation’s 5th largest Indian community and the 4th largest Korean population. The Washington MSA is one of the few in the country with a sizable Asian population overall, but little population in the core urban “county” (in this case the District of Columbia being treated as a county). The District of Columbia is under 5% Asian while its Maryland and Virginia suburbs host most of these communities.
On the Virginia side, Fairfax City and County are 20% Asian while Loudoun County is 21% Asian. Both have large Indian populations while Fairfax especially hosts a sizable Korean one. These communities have certainly helped the area as it has become a Democratic stronghold in the past decade.
Virginia’s Asian population is a quarter Indian and about 15% each Korean and Filipino. However, the Filipino population is not primarily found in the Washington MSA but rather in the Virginia Beach MSA, especially in the swingy Virginia’s 2nd congressional district, where they make up an absolute majority of the Asian population.
Conclusion
The Asian American vote in the United States should not be viewed as a monolith or as inherently Democratic.
Large Indian, Chinese, Korean, and Japanese American populations have made places like Northern Virginia, Georgia, and college towns across the Midwest more Democratic. On the flip side, large Filipino and Vietnamese American communities have helped shape competitive races in swing districts like those in Houston and Dallas, Orange County, and Virginia Beach.
Democrats would be wise to invest time and effort into understanding what has brought them success in some Asian communities and not as much in others, and to ensure they don’t treat all Asian voters the same.