Memo Published August 10, 2016 · Updated August 10, 2016 · 12 minute read
Where are the Job Offers?

Takeaways
Job openings are plentiful; job hires are not. What’s going on with this? This memo explains three possible reasons behind the recent and unusual discrepancy between the two labor metrics:
- The education and work experience gap between the qualifications employers want and the credentials that job seekers possess may be depressing the hires rate.
- Decreased industrial, functional, and geographic flexibility may reduce job seekers’ ability to adjust their search efforts for the most readily available jobs.
- The high number of job openings may be signaling a stronger demand for labor than actually exists in the economy.
A generation ago, people looking for work turned to the help wanted pages in their local newspaper. Today, seemingly endless online job postings are at the reach of a fingertip. April’s 5.8 million job openings were the highest on record in the United States since the Bureau of Labor Statistics (BLS) started counting them in 2001.1 That’s one million more than the pre-recession high of 4.8 million in April 2007.
A surge in job openings is typically great news for job seekers. Competition for openings declines, and workers’ chances of landing a job increase. When this happens, the pace of hiring should accelerate. In this recovery, however, hiring hasn’t kept up with the rate of past recoveries.
This memo examines this mismatch between job openings and hiring—and discusses three different explanations for the shift: the skills gap, job search flexibility, and weak demand.
What are the job openings and hires rates?
Every month, the BLS surveys 16,000 U.S. workplaces. Employers report how many of their jobs have been filled or become vacant—and the number of positions they are looking to fill. The Bureau compiles the data, and two months after the survey, releases its findings in the Job Openings, Labor Turnover, and Separations (JOLTS) report.
In the JOLTS survey, a job is considered open if 1) the specific position exists, 2) work could start within 30 days, and 3) the firm is actively searching externally for candidates.2 The job openings rate expresses the share of jobs in the economy that are vacant. In May, the job openings rate was 3.7%.3 This means that for every 100 jobs in the U.S., 96.3 had someone doing the job, but 3.7 were unfilled.
A high number of job openings indicates that employers have a strong demand for labor. This should be good news for the 7.8 million Americans who are unemployed and looking for work. As of May, there were only 1.3 unemployed people for every available job. That’s about as good as it got before the recession.
Hires are different from the payroll employment data in the traditional monthly jobs report. The jobs report counts the total number of individuals who received a paycheck during the pay period in the middle of the previous month. Let’s say you left your job and immediately started a new one. That would make no difference in the jobs report, but it would make a difference in the number of hires.
The hires rate is the share of total employment accounted for by hires in a given month. A strong hires rate can reflect a healthy labor market for two reasons. First, the higher the hires rate goes, the more it reflects the creation of new jobs. Second, it indicates that the job market is dynamic. When people are more often moving from job to job, it’s a sign that workers are moving toward jobs that allow for a better use of their skills. Labor economists call this churn.
In May, the hires rate stood at 3.5%. That’s because 5 million people got hired during the month, and the total number of employed workers was about 143 million.4 But here’s something to consider: The average hires rate prior to the recession was 3.8%. Yet since the recession officially ended in September 2009, the average hires rate is 3.3%.5 Half a point may not seem like a lot, but it represents an average of 679,000 hires per month over that span.6 Those extra hires wouldn’t translate 1-to-1 into net new jobs, but would almost certainly raise the jobs level to some degree.
What’s the problem?
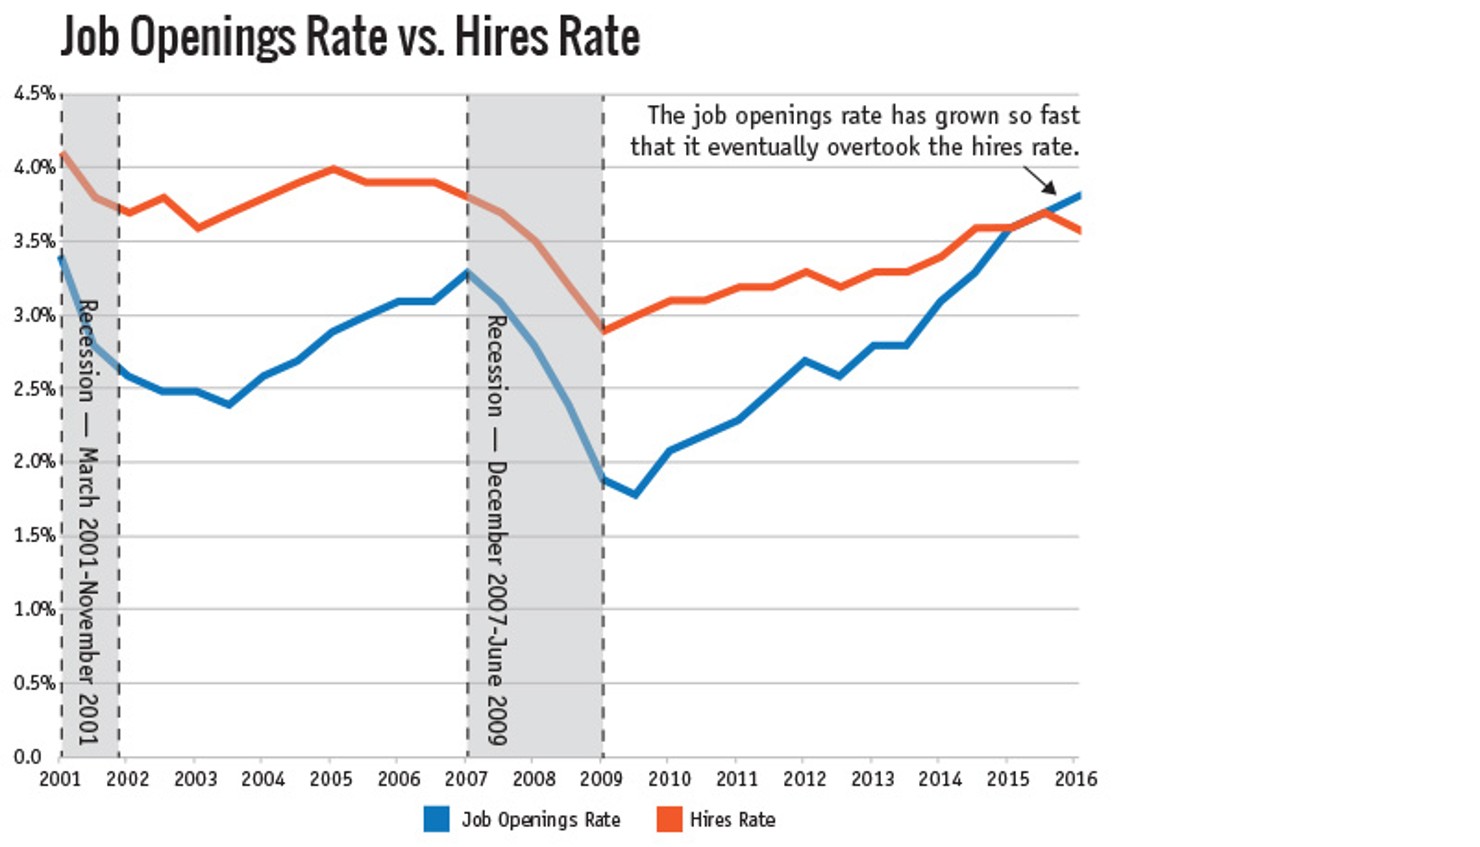
Ever since the BLS began reporting the job openings rate and the hires rate, the two series have moved in tandem, with a very close correlation. During downturns, job openings and hires slow together, and during expansions, they expand together. Between 2001 and 2013, the hires rate exceeded the job openings rate by about one percentage point.
But in 2014, this connection began to change. While the job openings rate has more than doubled since the recession, the hires rate has increased by only one-fifth.7 In other words, companies are posting a record number of job openings, but they’re just not filling all that many. As a result, the job openings rate began to exceed the hires rate in 2015—the first time this happened since the JOLTS report launched in 2000.
Source: U.S. Bureau of Labor Statistics, Job Openings and Labor Turnover, retrieved from FRED Economic Research, Federal Reserve Bank of St. Louis. Graph reflects semiannual averages.
What’s going on:
Fifteen years of JOLTS data indicate that the hires rate is generally higher than the job openings rate. But after the 2007-2009 recession, the job openings rate grew faster than the hires rate. By 2015, the two rates met. During the first five months of 2016, the job openings rate has either equaled or exceeded the hires rate.
Why, then, isn’t hiring keeping up with the apparent demand for labor? Is there something different about the way hiring is done in our new economy? Is it that employers who genuinely need workers can’t find what they want in applicant pools? Or are the companies’ needs not the same as the people looking for jobs?
Theory #1: It’s the skills gap
Some economists believe hires are falling short because of the skills gap: Employers are looking to hire, but seemingly can’t find applicants prepared to fill those roles. In fact, according to research by the Society of Human Resources Management, 84% of HR professionals reported that job applicants have demonstrated a shortage in applied skills.8
But there isn’t agreement among economists about whether the skills gap is real or not. Discussions of the skills gap often devolve into an argument between classical economists, who interpret the muted hires rate as a lack of qualified applicants, and Keynesian economists, who believe that it is the result of more labor supply than required by current output levels.
Both sides have a point. The Georgetown Center on Education and the Workforce, for example, projects that there will be a 5 million-person shortfall of workers with postsecondary credentials required by employers by 2020.9 And it’s not just a demand for college degrees; in fact, the hardest jobs to fill are skilled trades that require a serious investment in vocational training, like mechanics and electricians.10
On the other hand, some argue that the highly competitive job market of recent years has allowed employers to increase their expectations of applicants’ education and work experience. According to CareerBuilder, nearly one-third of employers have raised educational requirements for jobs in the past five years, and the biggest increase is in middle-skill jobs.11 These expectations should have come down as the recession subsided, but only 5% of employers globally have been willing to adjust their hiring standards to accept applicants that present a “teachable fit,” according to the Manpower Group.12 And as labor economist Peter Cappelli notes, the use of automation to screen resumes may inadvertently filter out qualified candidates who don’t have certain keywords on their submissions.13
The work experience gapThe skills gap is not just about educational levels; it also relates to job applicants’ amount of work experience. Research shows that employers are increasingly less likely to interview applicants who have long spells of unemployment.14 Here’s the problem: The Great Recession may be the biggest perpetrator of the work experience gap. The recession caused 8.8 million Americans to lose their jobs.15 Furthermore, average unemployment reached 35 weeks, well above previous recessions.16 There may be job applicants who turned down lower-quality, lower-paying jobs and remained unemployed in hopes that a higher-quality, higher-paying job would come along. By the same coin, there may also be employers who were unwilling to offer jobs to applicants who were otherwise qualified but were part of the long-term unemployed. |
Theory #2: It’s job seeker flexibility
A second possibility is that, as the St. Louis Fed puts it, “The unemployed may not be looking for the right jobs.”17 This suggests that job seekers’ preferences can be adjusted over time to meet demand. There are three broad dimensions to job seekers’ preferences: industry, function, and geography.
Of these three areas, industry is the easiest adjustment for a job seeker to make. For example, a bookkeeper working for a manufacturing firm should have few obstacles to getting the same type of job at a technology firm. Job seekers can even leverage the JOLTS report to identify high-growth industries since it tracks job openings and hiring at the industry level.
Changing function tends to be a more difficult barrier to a job search because it often requires acquiring a new educational credential. Even if certain high-quality jobs are available in large numbers today, it may take job seekers two to four years to obtain the education needed just to apply.
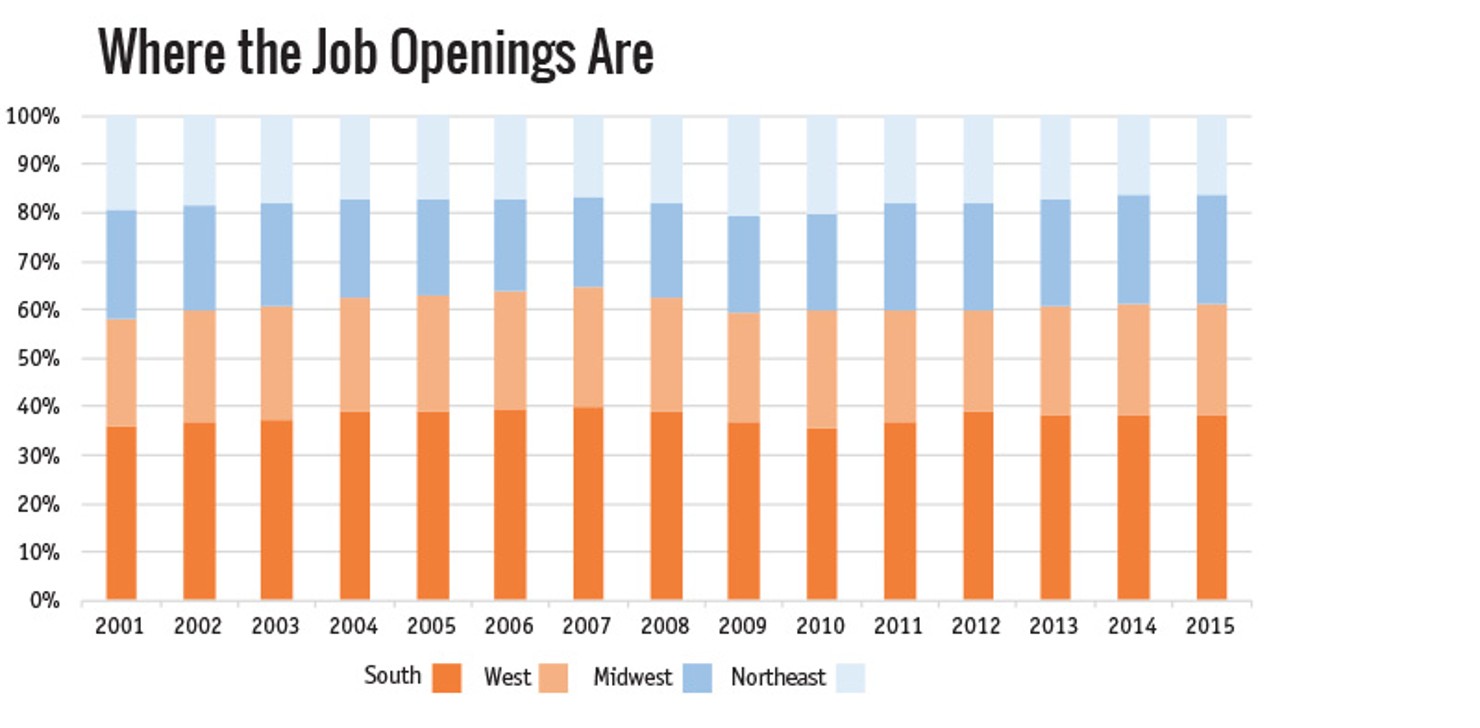
Finally, some job searches are stymied by geography. Americans have become less inclined to make permanent relocations. According to the JOLTS report, over the last 15 years there have been consistently more job openings in the South and West than the Northeast and Midwest. Yet economists have found that internal migration in the U.S. has fallen across all measures. Moves within the same county, within the same state, and state-to-state are all down.18
Source: U.S. Bureau of Labor Statistics, Job Openings and Labor Turnover, retrieved from FRED Economic Research, Federal Reserve Bank of St. Louis. Graph reflects semiannual averages.
What’s going on:
Over the past 15 years, there has been a consistent 60/40 distribution of job openings between two halves of the U.S.: 60% in the South and West and 40% in the Midwest and Northeast. In particular, the South, which spans from Oklahoma to Maryland in BLS materials, has had one-third or more of total national job openings each year.
Theory #3: Demand isn’t that strong
A final possibility is that the high rate of job openings just doesn’t reflect the actual strength of labor demand. This may have to do with the fact that the marketplace for jobs has moved almost entirely online. Back in 2005, when the Conference Board started its Help Wanted Online index, there were about 3.2 million job openings posted online. In 2015 and 2016, there have been well over 5 million.19 Because it is much easier and much less expensive to post a job on the web rather than in a newspaper, some have suggested that companies post open positions online merely to test the waters.
This is unlikely to be the case for the majority of online job openings. While it may be easy for a company to post a job description on its own website, they have had the ability to do so well before the recession started. And, as a reminder, the JOLTS survey only counts job openings if the firm has an active search underway for external candidates. This is an important distinction, because active recruiting comes with a cost. The cost per hire for professional and manufacturing jobs, the two most expensive industries for hiring, can exceed $5,000.20 Just using online-only platforms alone can still cost $100 to $500 per post.21
Still, the volume of openings may not be as positive as it appears, for other reasons. For example, the relative quality of the additional job openings coming online is not as strong as in past recoveries. The newest and fastest growing industries in America are so productive that they employ tiny amounts of workers. For example, Google, Facebook, and Twitter have massive valuations, but they employ a fraction of the workers that General Motors employed in its heyday. Because these companies are successful, their profits ripple through the economy and support jobs in other industries. But these secondary jobs are most prevalent in lower wage service industries, like restaurants and retail. This would explain the decline in labor force participation across age and gender groups: If the labor market has less to offer, people just won’t participate in it for as many years as they would have otherwise.
Proponents of the weak demand theory argue that other labor market measurements may be better indicators than the job openings rate. These may be much more subtle evaluations of relationships between labor market signals. For example, the lack of wage growth has been an ongoing concern to many economists. If demand for labor were high, workers would be able to negotiate higher wages, and wages would go up. Wages would also go up because more workers would be quitting their jobs. But, wage growth was slow to enter the current recovery, and while it is now occurring, it is doing so at a modest pace.
Conclusion
The level of job openings may be fundamentally higher today than during past economic expansions. What will it take for the hires rate to catch up? The most efficient public policies address both the supply and demand sides of the job market.
On the supply side, the U.S. could take advantage of this period of economic expansion to prepare workers for the jobs of the future. For example, Third Way has proposed establishing free, mid-career Prep for Success academies to achieve just that. Enhancing job seekers’ skills and flexibility can improve the outcomes of the matching process between the workers who supply labor to the economy and the employers who demand it to meet and increase economic output.
Third Way has also called for the establishment of a $400 billion Strategic Investment Initiative to boost public spending in engines of job creation such as infrastructure, domestic manufacturing, and research and development. It also includes a public-private partnership called the Mobility Fund to bring jobs to underserved communities. These proposals are designed to stimulate the demand side of the labor market and are tailored to ensure that job opportunities are available to workers of all skill levels and all communities.