Report Published February 12, 2015 · Updated February 11, 2015 · 10 minute read
Are Modern Trade Deals Working?
As the President and Congress work together to secure fast track authority to negotiate and conclude the largest trade agreement in history, the central question facing policymakers is whether trade deals live up to their hype. Do they actually increase “Made in the USA” exports and improve our balance of trade, thereby creating more middle class prosperity?
While some 20th Century trade deals didn’t always live up to their promise, deals in the 21st Century have generally been negotiated with higher standards making them a better proxy for the likely impact of new deals like the Trans-Pacific Partnership. In this paper, we analyzed all of the U.S. trade agreements that went into effect since the turn of the century—with 17 countries in all since 2000.* Because the U.S. has such a consistent and overwhelming trade surplus in services, in this paper we looked only at whether these deals improved the U.S. balance of trade in goods. Our analysis found the following: nearly all recent trade deals have improved our balance of trade in goods, and in the aggregate the gains have been substantial.
- For 13 of 17 countries, the balance of trade in goods improved for the United States after implementation of the free trade agreement (FTA).
- In the aggregate for all 17 countries, the balance of trade for goods improved after implementation by an average of $30.2 billion per year in 2014 dollars.
- On a per country basis, the balance of trade for goods improved on average by $1.8 billion per year for these 17 countries.
- Goods exports increased by 52.0% on an average annual basis after implementation; imports in goods increased by only 25.6%.
- In 2014, the U.S. had a $30.9 billion surplus in the goods trade with these 17 countries. In the final full year before each FTA implementation, the U.S. ran a $2.8 billion goods deficit with these same countries (in 2014 dollars).
Jordan, (12/2001), Chile (1/2004), Singapore (1/2004), Australia (1/2005), Morocco (1/2006), El Salvador (3/2006), Honduras (3/2006), Nicaragua (4/2006), Guatemala (7/2006), Bahrain (8/2006), Dominican Republic (3/2007), Costa Rica (1/2009), Oman (1/2009), Peru (2/2009), Korea (3/2012), Colombia (5/2012), and Panama (10/2012).
The Current Debate
In the State of the Union, President Obama made his strongest case to date for a sweeping new trade agreement with many of the major Asia-Pacific economies. Known as the Trans-Pacific Partnership (TPP), the intent of the agreement is to increase trade and broaden the economic links between the United States and 11 other economies in a region that represents nearly 40% of global GDP.1 It aims to do so by lowering tariffs, eliminating myriad trade barriers, and increasing the standards for labor and environmental practices and the rule of law. In addition, the President and others have made it a priority to have the U.S. and other like-minded countries set the trade rules in Asia rather than having those rules etched in place by China. China’s use of discrimination, opacity, and arbitrary and unpredictable business regulations keeps its companies competitive at home—and its trade rules reflect and promote this approach abroad.
From the U.S. perspective, the goal for agreements such as TPP is to increase middle class well-being—not simply by making imported consumer goods cheaper, but by increasing exported goods and services that create and support well-paying middle class jobs. Studies have frequently shown that jobs related to exports are higher paying than other similar jobs. For example, a widely cited International Trade Administration report found “that exports contribute an additional 18% to workers’ earnings on average in the U.S. manufacturing sector,” adding that “the export earnings premium for blue collar workers is approximately 20% greater than the export earnings premium for white collar workers.”2 And increased exports (and a better balance of trade) contribute to positive GDP growth which lifts both wages and employment.
Supporters of TPP contend that a broad new trade agreement would be of economic benefit to the middle class. They note that, by 2020, the Asia-Pacific middle class will expand by more than 1.2 billion and will make up half of the world’s middle class consumers.3 They point to high tariffs, discriminatory government subsidies, exclusionary standards, and regulatory practices that would be addressed in a high standards trade agreement. They argue that new benchmarks for labor and environmental practices move each country in the right direction. They warn that without such an agreement in place, America will cede the international commerce agenda to China and its efforts to place low standards, manipulative currency, and state-owned enterprise regimes in place.4 In sum, supporters note that the agreement will make U.S. exports much more competitive, thus expanding opportunities for the middle class.
However, skeptics abound. They contend past trade agreements made the same promise, but failed to deliver. They point to NAFTA as an agreement that changed our trade balance with Mexico from one of surpluses to one of deficits.5 They warn that international trade is responsible for much of the off-shoring of American jobs, particularly in the manufacturing sector. In sum, the agreement will continue to worsen America’s trade balance and continue the decline of the middle class.
As the President noted, “past trade deals haven’t always lived up to the hype… But 95% of the world’s customers live outside our borders, and we can’t close ourselves off from those opportunities.”6 While certain 20th Century trade deals didn’t deliver as promised, recent deals have been negotiated with higher standards and were meant to succeed where NAFTA fell short. To test that proposition, we studied all of the trade deals concluded by the United States post-NAFTA and since 2000 to see whether they increased “Made in the USA” exports to these countries or hurt it.
In this paper, we looked only at the balance of trade in what the U.S. government calls “goods.” Goods are defined as merchandise, supplies, raw materials, and other products by the U.S. Census Bureau.7 While expanding exports of U.S. services were a central goal of these agreements and critical to the U.S. economy, in our analysis of modern trade deals we omitted trade in services for the following three reasons: 1) The United States has already established enormous and sustained trade surpluses in this sector, so we didn’t want to obscure the other major sector of trade – that of goods. For example, in 2014, the U.S. had a $232 billion worldwide trade surplus in services.8 2) There is general acknowledgement that even in the deals that some criticize—like NAFTA—the service sector fared well. Indeed, the U.S. enjoyed a trade service surplus of $45 billion with Canada and Mexico in 2013.9 3) The goods sector is where millions of blue collar, middle class jobs reside, and there is universal concern in the U.S. about the hollowing out of these specific professions.
The Scorecard for Recent Trade Deals
We found that individually, nearly all recent trade deals have helped our balance of trade in goods, and in the aggregate, the gains have been substantial.
In all, we analyzed the 17 countries for which the United States concluded a trade pact that went into effect since 2000, which is all the post-NAFTA FTAs. For each of the countries, we measured U.S. exports and imports of goods in the ten years preceding the implementation of the FTA and all of the years after. We found:
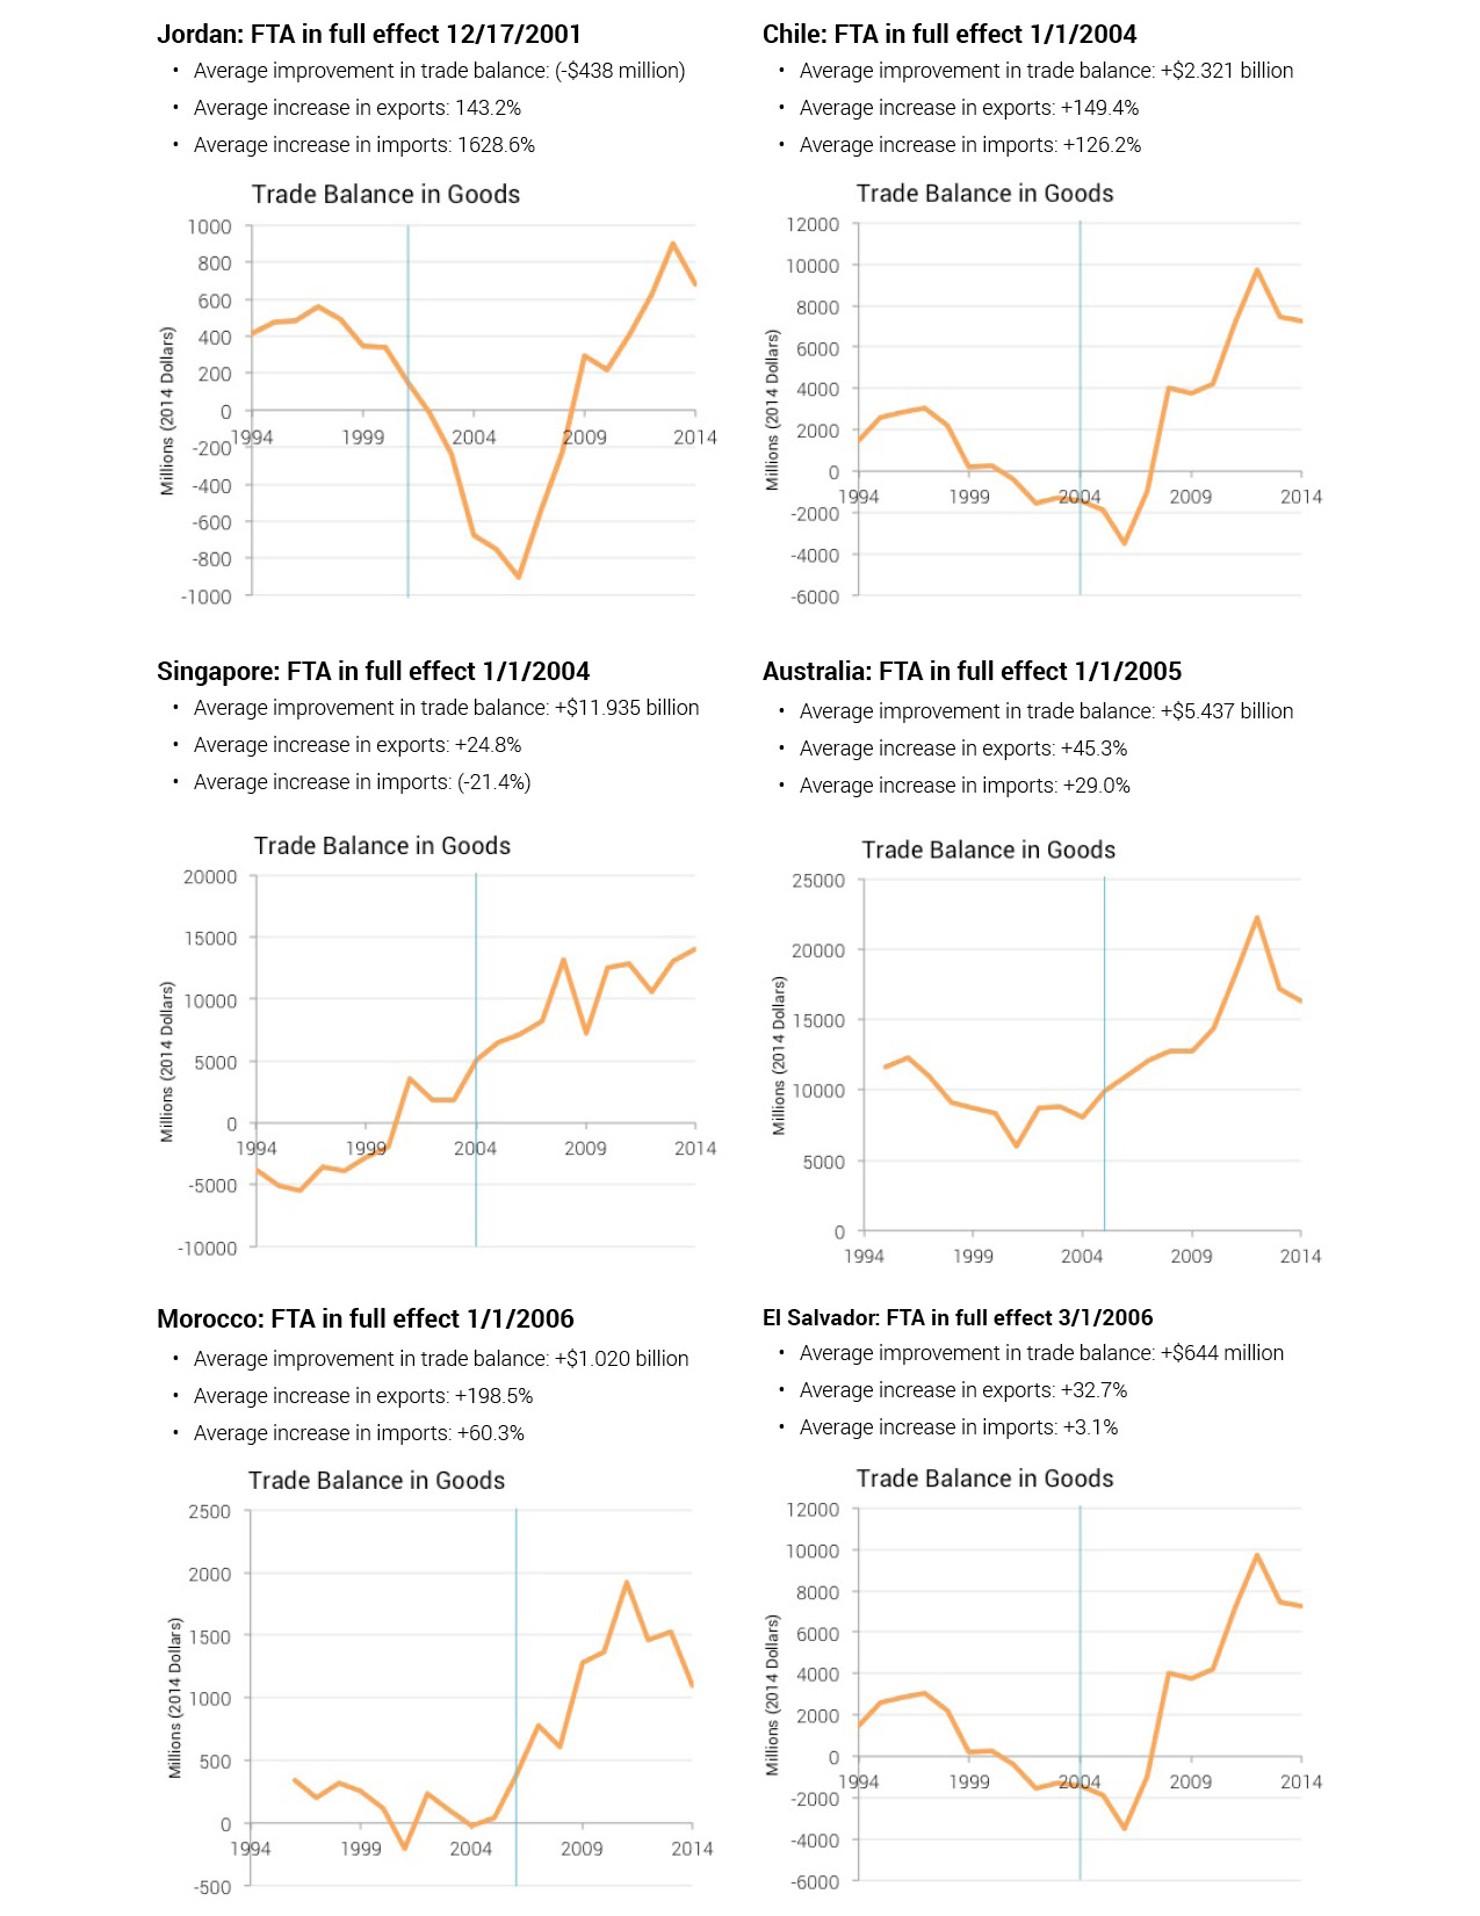
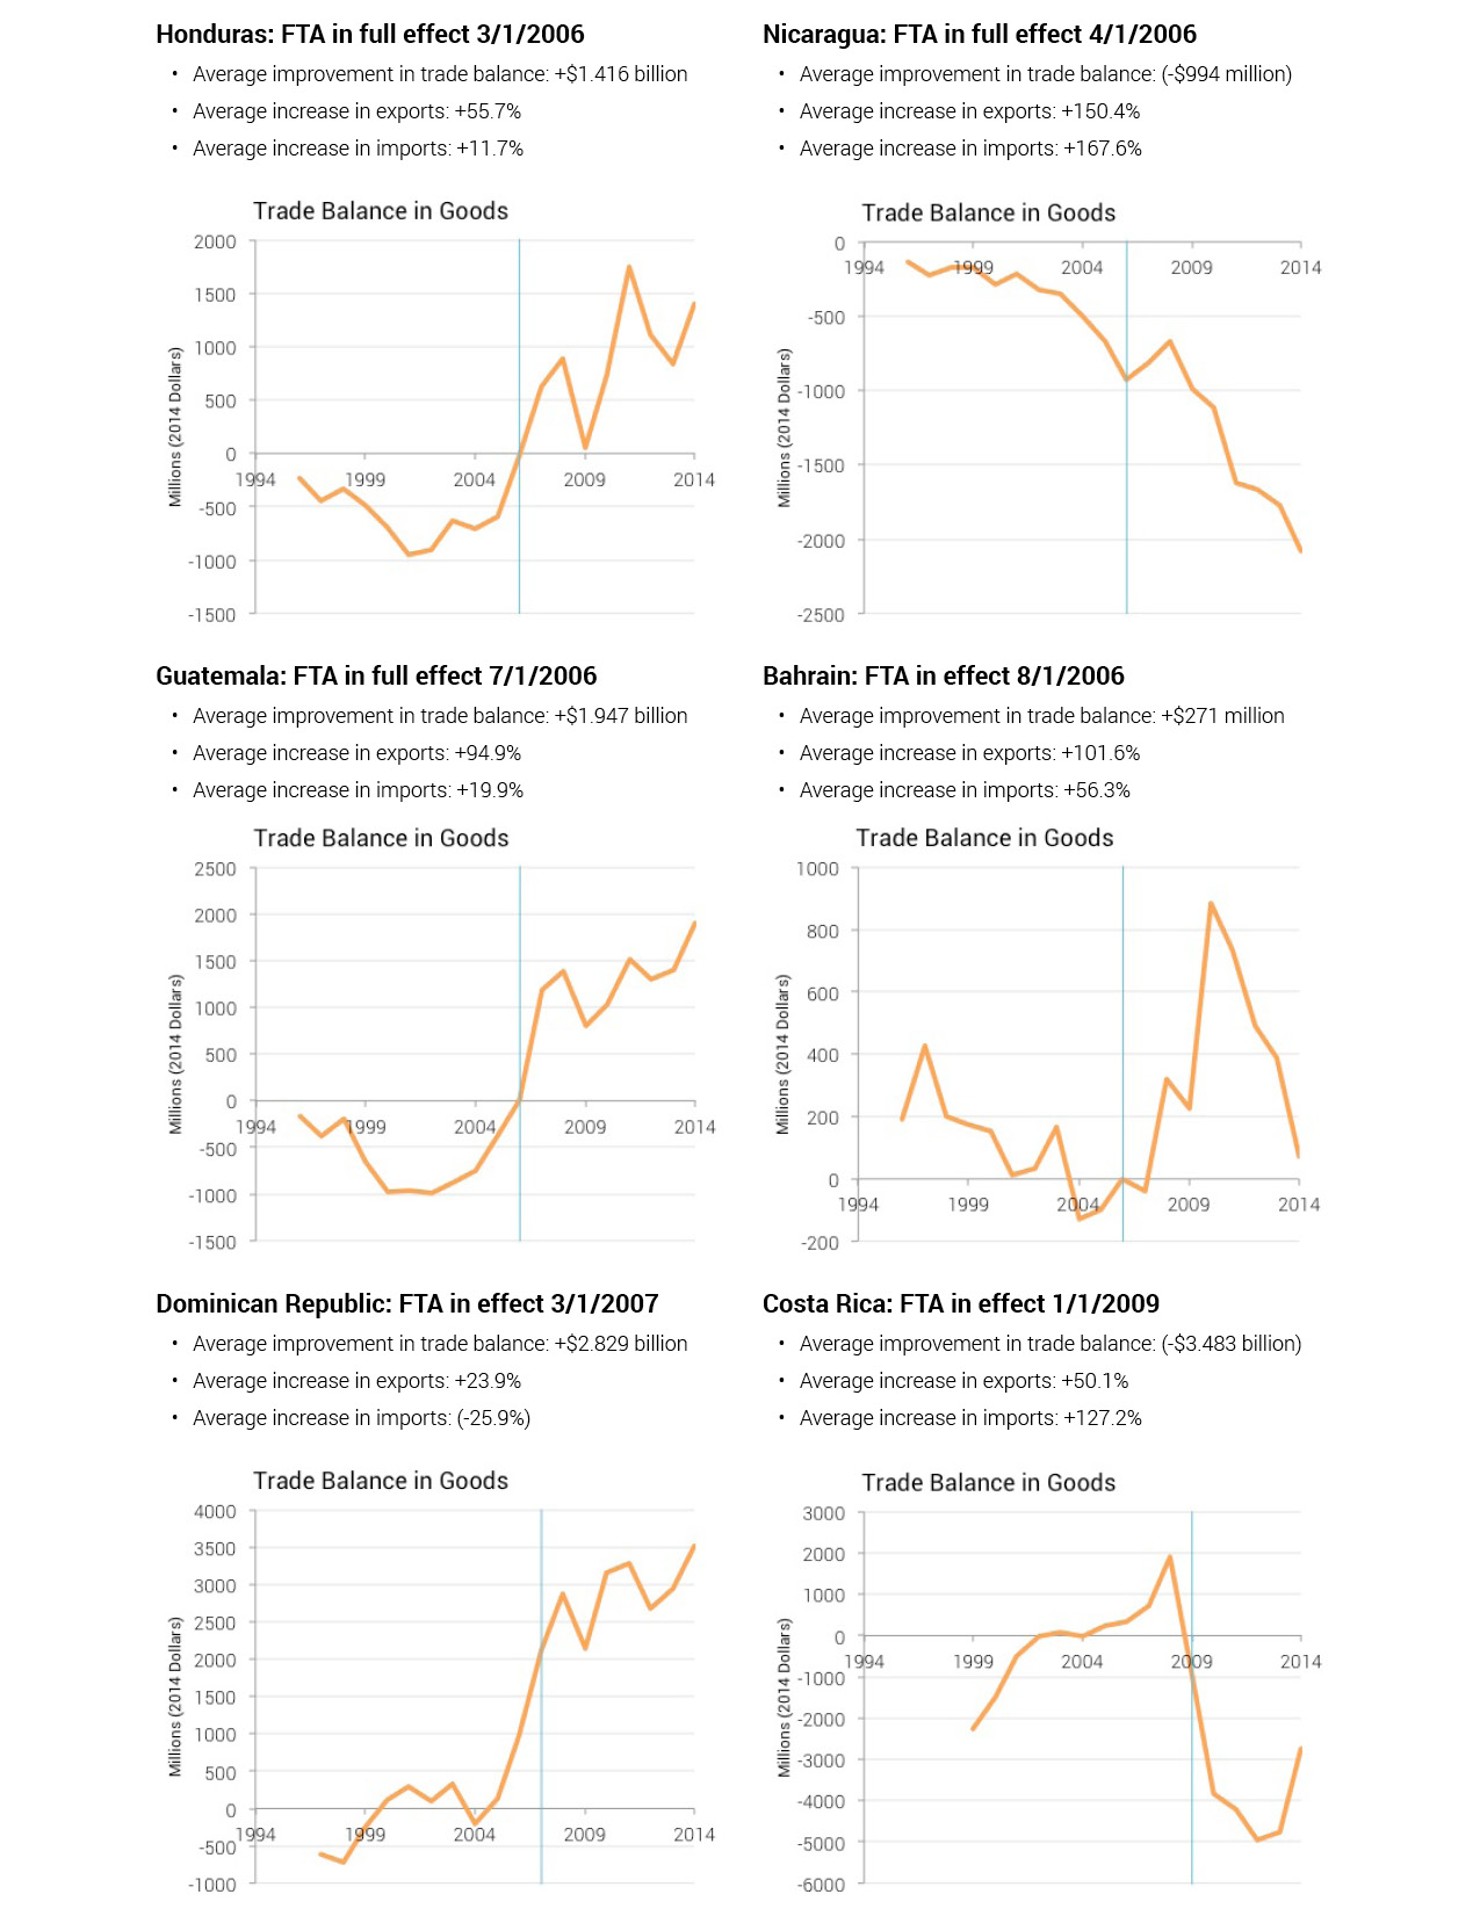
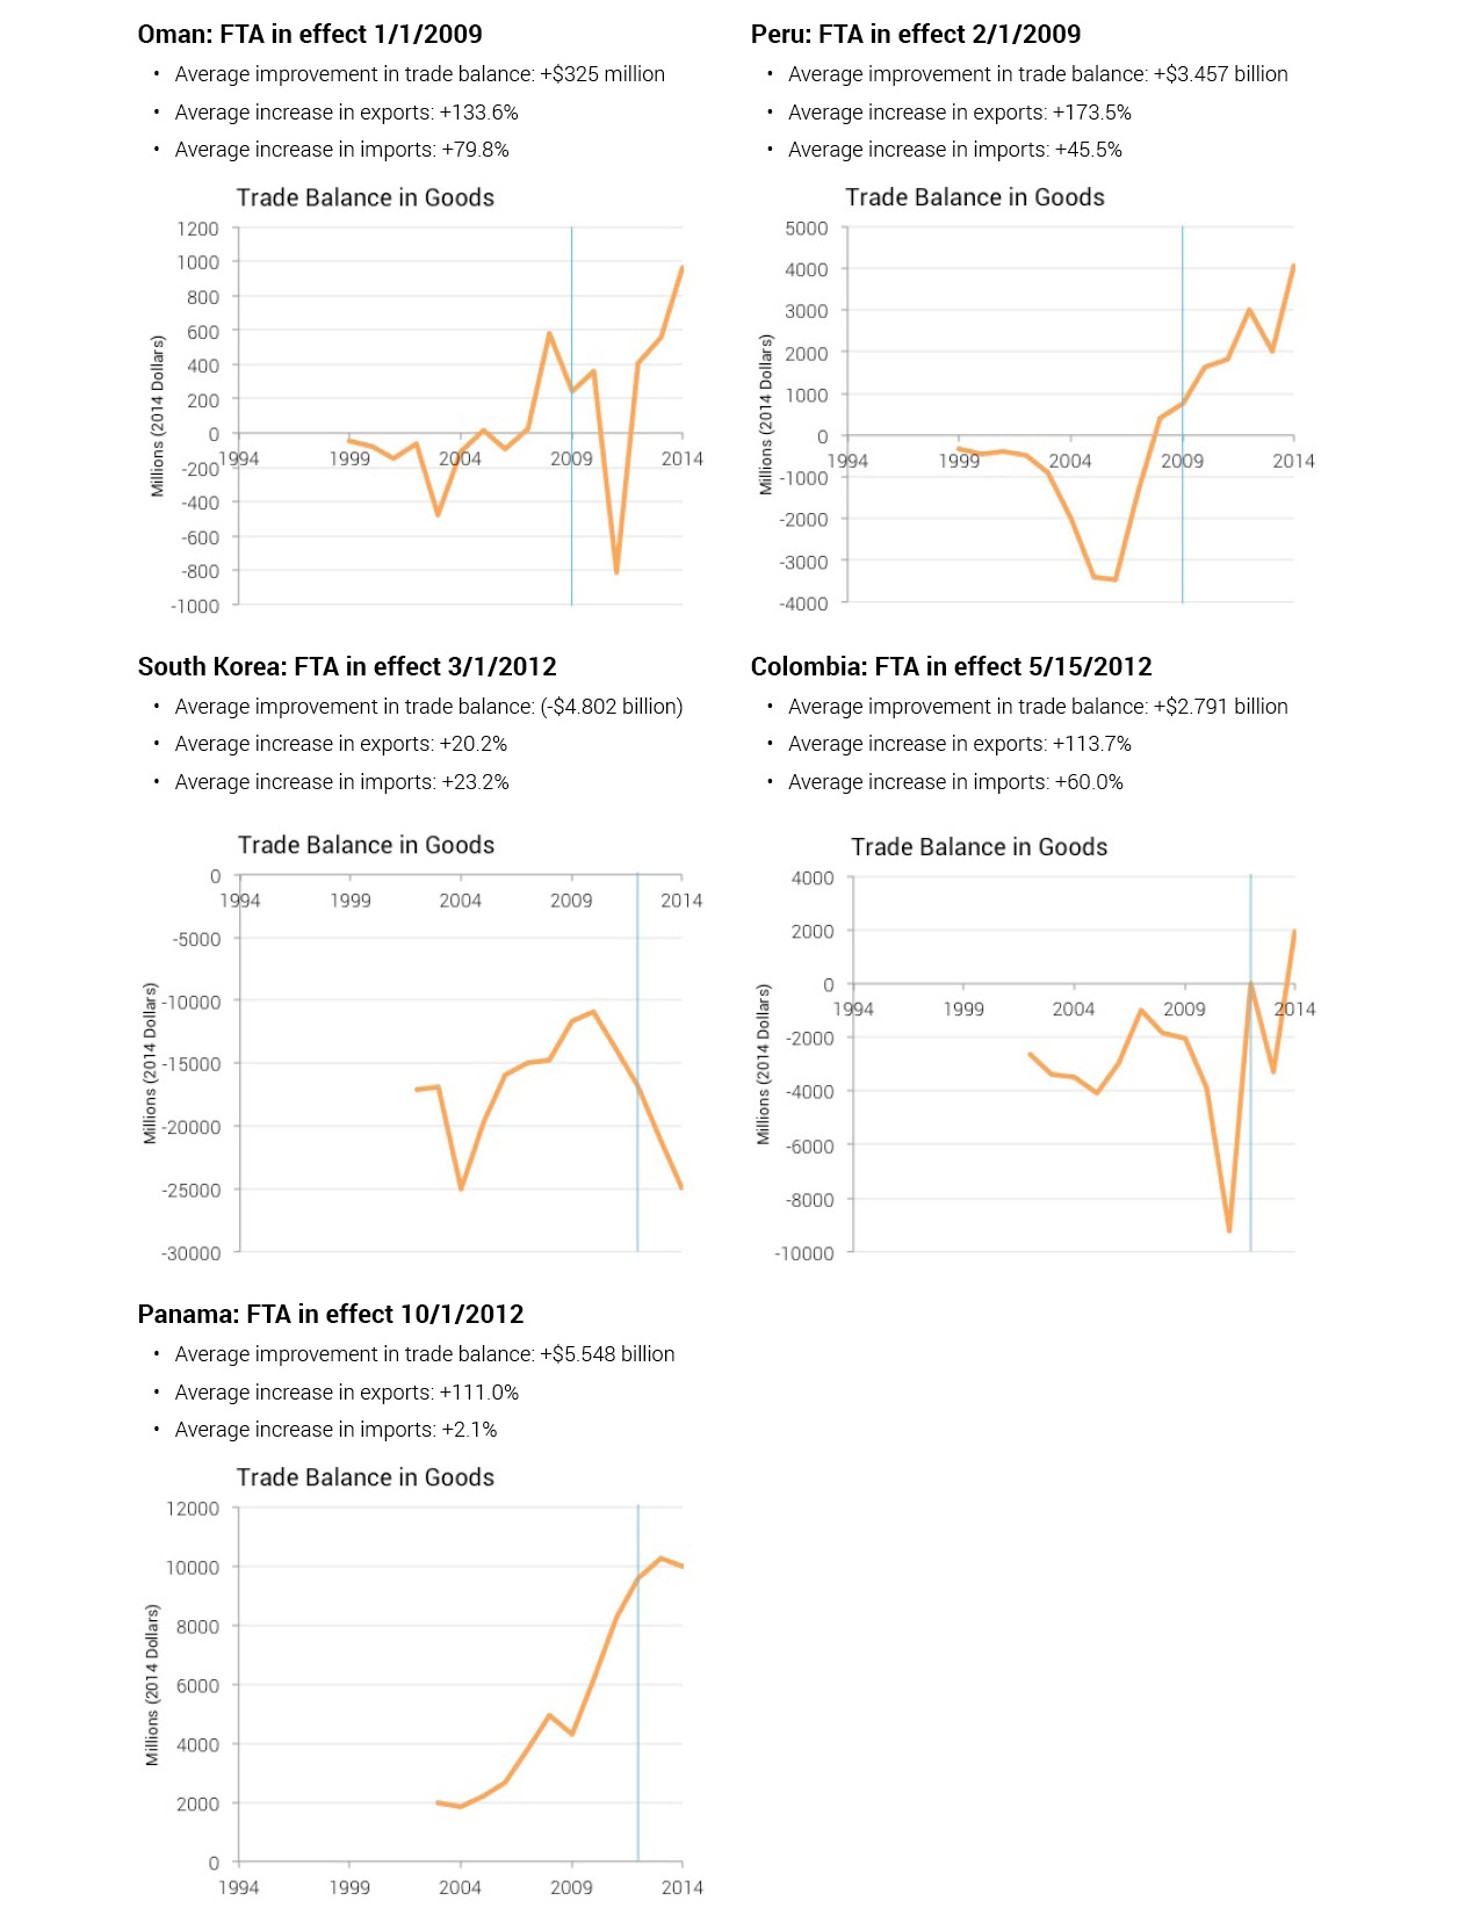
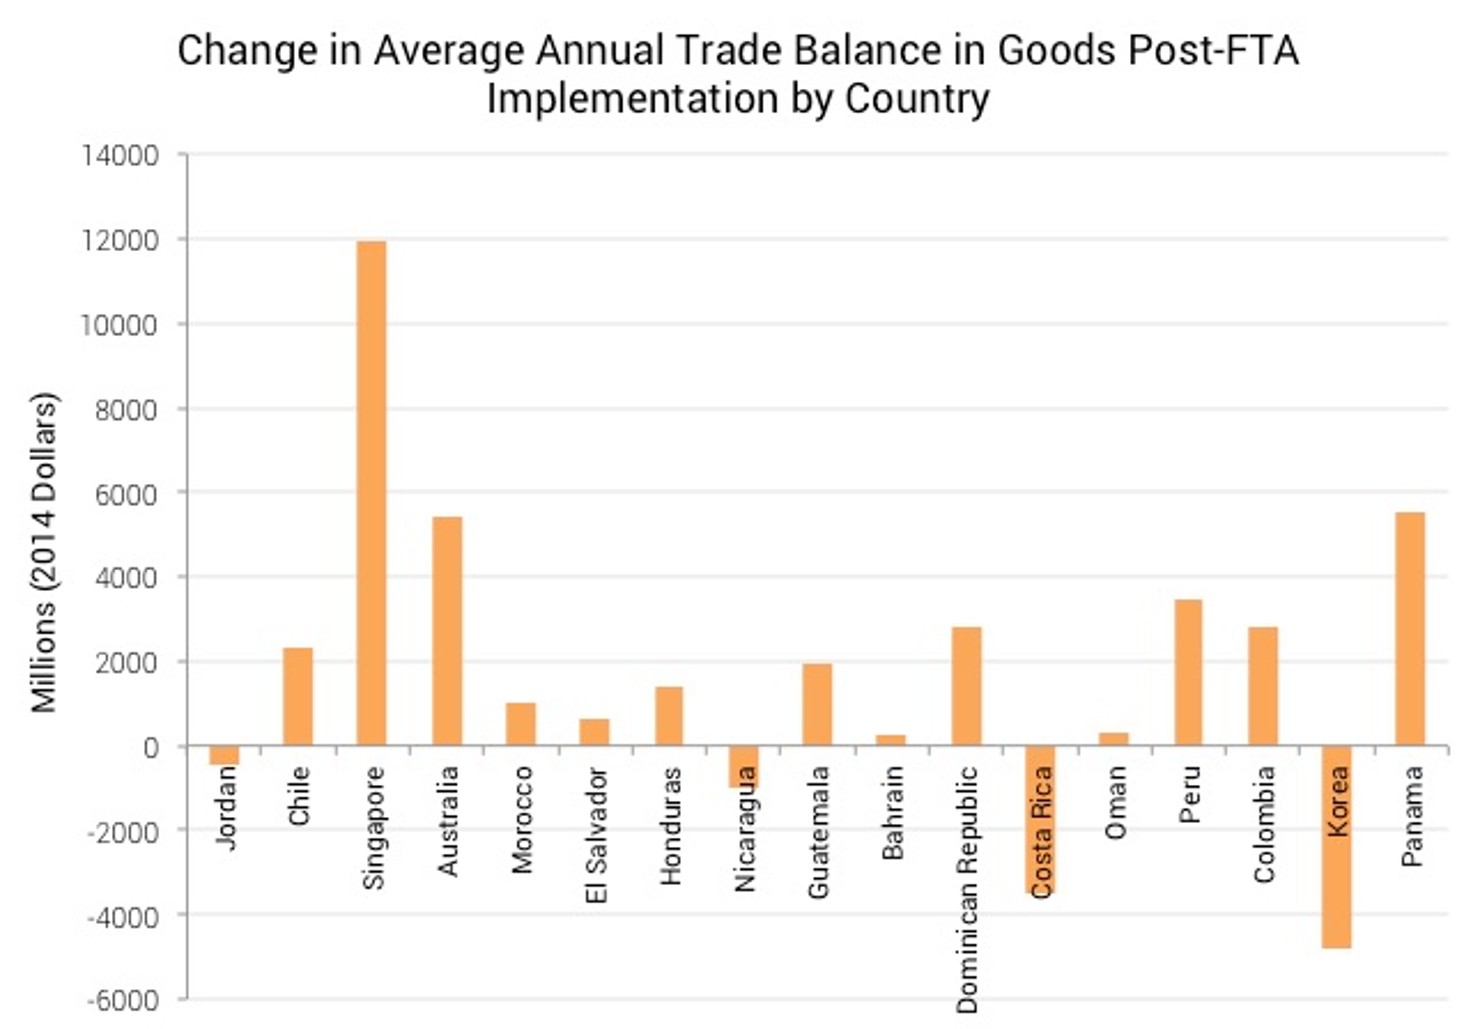
- In 13 of 17 countries, the U.S. balance of trade in goods improved after FTA implementation.10 Trade balances in goods improved in Singapore, Panama, Australia, Peru, Dominican Republic, Colombia, Chile, Guatemala, Honduras, Morocco, El Salvador, Oman, and Bahrain. Trade balances worsened in Korea, Costa Rica, Jordan, and Nicaragua.
- On an average annual basis, the balance of trade in goods improved by $30.2 billion in 2014 dollars post-FTA among all 17 nations in the aggregate. The balance of trade improved the most in Singapore ($11.9 billion)* and fared the worst with Korea where its slowing economy contributed to a weakened trade balance (-$4.8 billion). Beyond Singapore, the balance in the goods trade improved in Panama ($5.5 billion), Australia ($5.4 billion), Peru ($3.5 billion), Dominican Republic ($2.8 billion), Colombia ($2.8 billion), Chile ($2.3 billion), Guatemala ($1.9 billion), Honduras ($1.4 billion), Morocco ($1.0 billion), El Salvador ($644 million), Oman ($325 million), and Bahrain ($271 million). Beyond Korea, the balance in the goods trade worsened in Costa Rica (-$3.5 billion), Nicaragua (-$1.0 billion), and Jordan (-$438 million). When all 17 nations are put together, the average improvement in the trade balance on goods is $1.8 billion per nation after FTA implementation.
- In 2014, the U.S. had a $30.9 billion surplus in the goods trade with these 17 countries. This compares to a $2.8 billion deficit with these same countries in the final full year for each country pre-FTA.
- The rate of increase for U.S. exports doubled the rate of increase in U.S. imports for these 17 nations post-FTA. After FTA implementation, U.S. goods exports to these 17 nations increased by an average of 52.0% on an annual basis in 2014 dollars. U.S. goods imports increased by only 25.6%.
All dollar figures are in 2014 inflation adjusted dollars.
In 13 of 17 countries, the U.S. balance of trade in goods improved on an average annual basis. Data based on the 10 years preceding implementation and all the years following implementation.
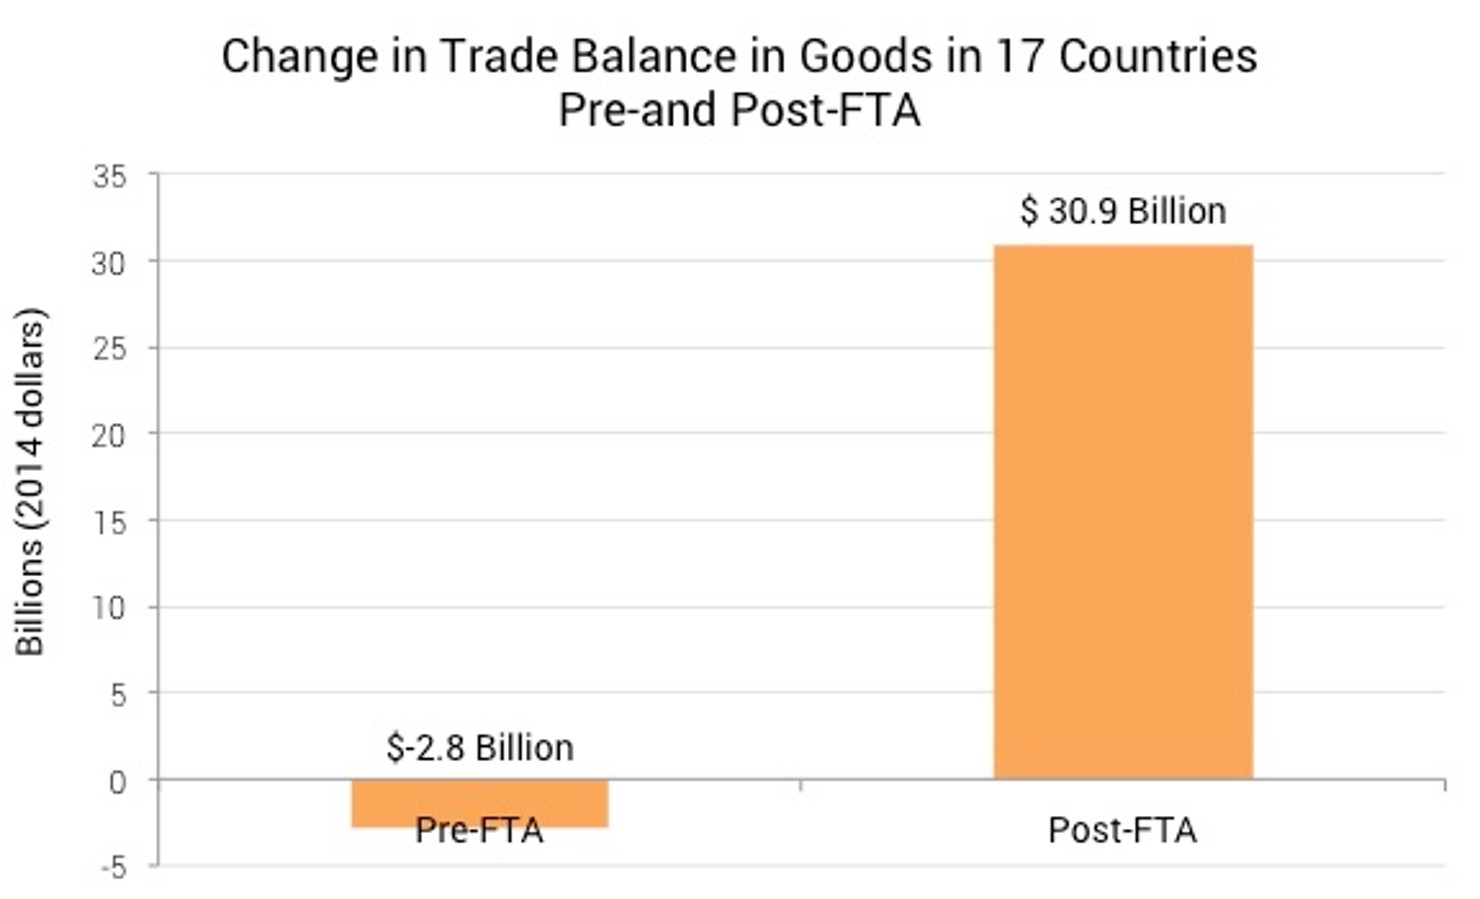
The U.S. had a $30.9 billion goods surplus in 2014, compared to a goods deficit of $2.8 billion in the 17 countries in the year prior to FTA implementation.
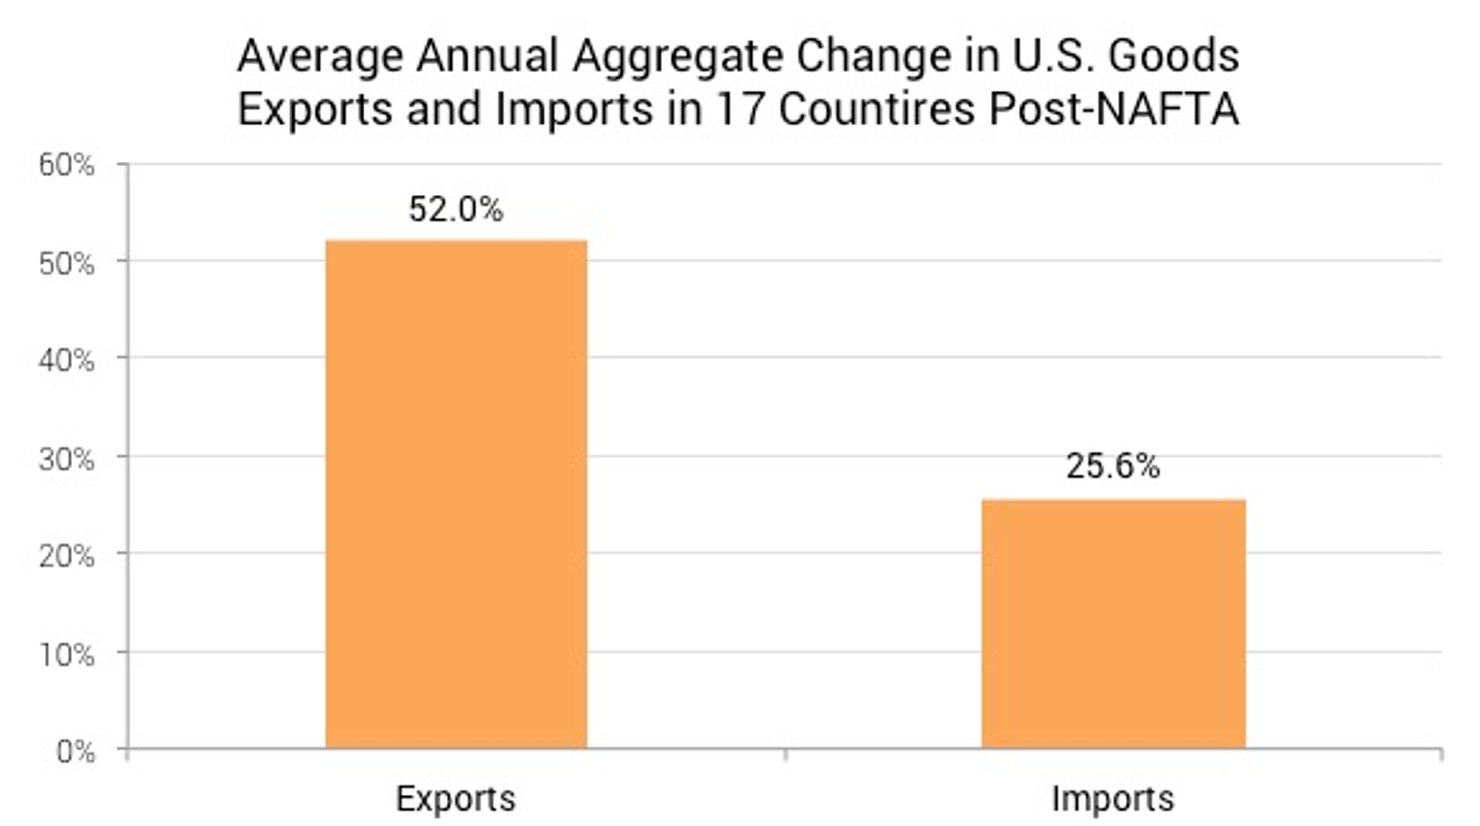
U.S. exports in goods increased at twice the rate of imports on an average annual basis in the years following FTA implementation.
Conclusion
If we judge the economic impact of trade deals and their benefits to the middle class on improving the balance of trade on goods, then our 21st century trade deals have delivered on that promise. They have increased exports at a far greater rate than imports, improved the balance of goods trade for 13 of 17 countries, turned previous goods deficits into surpluses, and have added a net improvement of $30.2 billion annually in our trade balance on goods alone. The fact that these figures omit our trade in services—America’s strength—significantly understates the powerful positive effect these agreements have had across the board. For example, even with the slowing Korean economy, a $3.2 billion gain in services nearly offset the deficit in goods.11
With the expectation that TPP will be our highest standard deal yet, there is substantial opportunity to further contribute to America's economic growth at a time of global economic stagnation. This deal has every potential to follow the same path as our 21st Century deals that contributed to more “Made in the USA” products on foreign shelves and increased middle class prosperity.
What follows is a country-by-country analysis of the pre- and post-FTA trade in goods.
Appendix
Methodology
- We looked at trade in goods data for all countries in which a free trade Agreement (FTA) with the United States was implemented in 2000 and beyond. That included the following 17 countries: Jordan (12/2001), Chile (1/2004), Singapore (1/2004), Australia (1/2005), Morocco (1/2006), El Salvador (3/2006), Honduras (3/2006), Nicaragua (4/2006), Guatemala (7/2006), Bahrain (8/2006), Dominican Republic (3/2007), Costa Rica (1/2009), Oman (1/2009), Peru (2/2009), Korea (3/2012), Colombia (5/2012), and Panama (1/2013).
- Using data from the U.S. Census Bureau, we compared export and import data for all the years after implementation and the 10 years prior to implementation for each country. For the 17 countries, 170 years of total data was measured for pre-FTA trade balances in goods and 130 years of total data was measured post-FTA.
- All data was converted to 2014 dollars using the Bureau of Labor Statistics inflation calculator.
- In instances when a trade agreement was implemented mid-year, when 9 or more months coincided with either pre- or post-agreement, the entire year was counted in the appropriate category (Jordan 2001, El Salvador 2006, Nicaragua 2006, Honduras 2006, Dominican Republic 2007, Peru 2009, and Korea 2012). If an agreement was implemented mid-year such that neither status had at least 9 months, that year was omitted (Bahrain 2006, Guatemala 2006, and Colombia 2012).
Data from 2014 was based on 11 months of data.
Free Trade Agreements: Balance in Goods by Country