Boatloads of Growth: Recapturing America’s Share of Asia-Pacific Trade

Boatloads of Growth: Recapturing America’s Share of Asia-Pacific Trade

Boatloads of Growth: Recapturing America’s Share of Asia-Pacific Trade
Photo of Ed Gerwin
Ed Gerwin

By 2020, the Asia-Pacific’s $10 trillion import market will present vast opportunities to support U.S. economic growth and wider prosperity for America’s Middle Class. But, over the past decade, the U.S. share of key Asia-Pacific markets has actually plummeted–by over 40%. Retaking America’s share of these rapidly expanding economies—beginning with trade deals like the TransPacific Partnership (TPP)—could pay huge dividends: over a half trillion dollars in additional U.S. exports, supporting millions of good American jobs.

The humble shipping container isn’t much to look at, but this ubiquitous metal box has revolutionized world trade. Since 1990, global container shipments have surged by almost 600%, lowering costs for shippers and customers worldwide.1

Containers also tell trade’s story.2 In 2008, for every five cargo containers that Asia sent to the United States, America sent back only two, resulting in gluts of empty containers at U.S. West Coast ports.3 Repositioning these unfilled containers can require sending entire boatloads of empty boxes back to Asia–floating illustrations of America’s trade deficits with countries like China and Japan.4 But, in the decade ahead, U.S. producers and workers will have growing opportunities to fill boxes bound for Asia-Pacific markets5 with more “Made in the USA” products.6

This report explains why it is vital for America to seize a greater share of growing Asia-Pacific import markets. Based on our analysis of trade data, we find that:

  • While the value of U.S. exports to 12 key Asia-Pacific markets has been increasing significantly, America’s share of these markets actually fell by 43% between 2000 and 2010;
  • By 2020, the annual value of goods imported by key Asia-Pacific markets will approach $10 trillion—equivalent to two-thirds of the entire American economy in 2010. This burgeoning import market will create huge new opportunities for U.S. exporters and workers; and
  • Regaining America’s historical share of key Asia-Pacific markets would—in 2020 alone—increase U.S. exports by almost $600 billion, supporting over 3 million jobs.

Our report recommends that America set an explicit goal of winning back a larger share of Asia-Pacific trade. To do this, the United States must shake off old notions about trade agreements and become a “rules maker” in the Asia-Pacific, leading a long-term effort to conclude the TransPacific Partnership and a growing circle of trade deals that establish strong, modern, and comprehensive trade rules throughout the region. And we must increase enforcement of trade rules and export promotion to ensure that our exporters can benefit from our existing trade arrangements.

The prize for cracking open the Asia-Pacific market is enormous. It is vital that America get a bigger share.

Finding #1

America’s Share of Exports to Key Asia-Pacific Markets has Plummeted 43% in 10 Years.

In the past, Asia was primarily a low-cost producer of goods destined for U.S. and European consumers. But, now, Asia’s own consumers are playing a growing role in boosting global demand.7 Container traffic into China is already expanding faster than China’s outbound shipments.8 In a recent survey of over 300 global CEOs, almost half responded that Asia’s growing spending power offers the single biggest opportunity to increase their sales.9

Asia’s consumers are increasingly demanding high-quality goods and wholesome foods. They travel more and need insurance and modern financial services. Growing Asian trade and commerce is driving added business spending and investment in modern infrastructure. And, as developing Asia becomes more prosperous and urbanized, it faces demands to weave stronger social safety nets, improve living standards, and increase spending on education, health care, and the environment.10

How well positioned is America to tap into emerging Asia’s strong growth? If past is prologue, America’s track record as an exporter to the Asia-Pacific offers two seemingly contradictory answers.

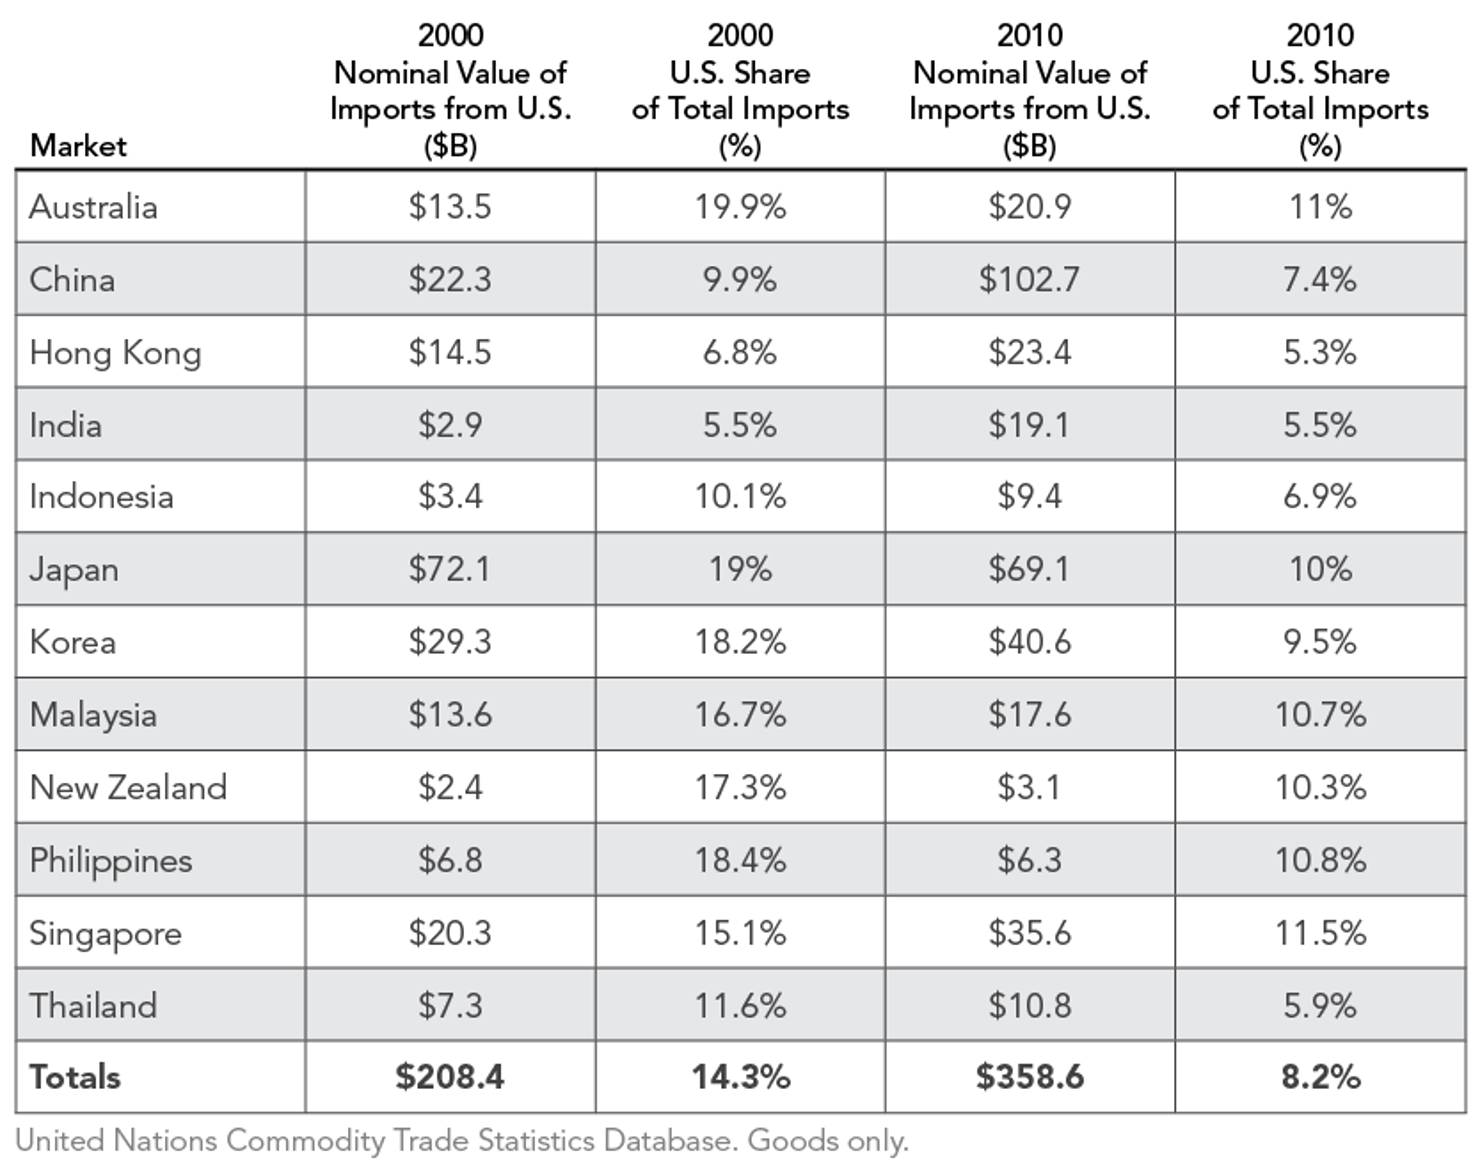
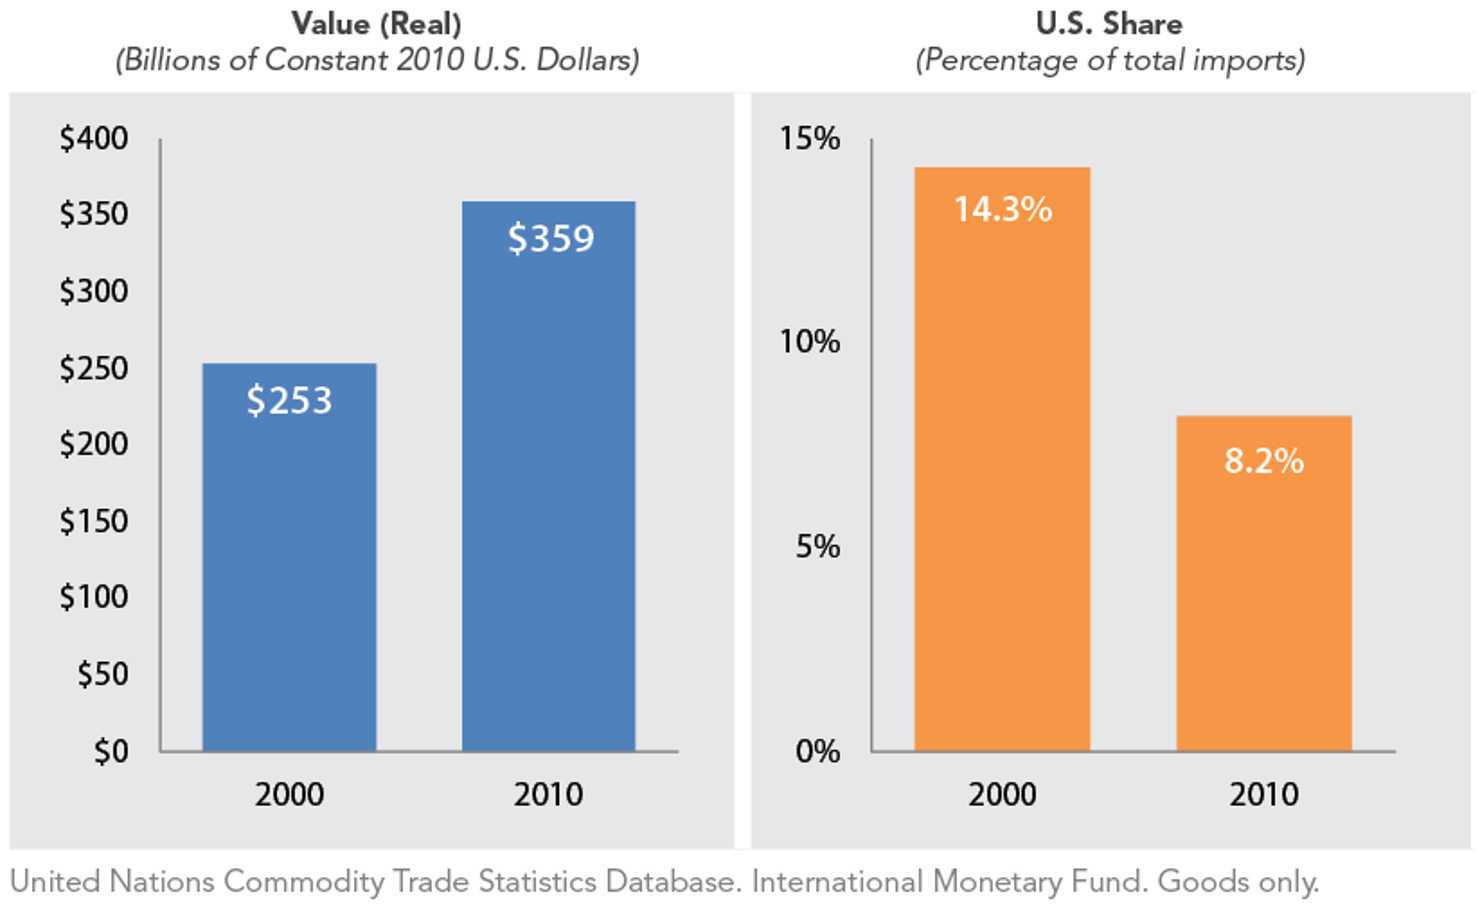
On the one hand, the value of U.S. exports to Asia has been growing substantially and is poised to continue to grow. Over the past decade, the Asia-Pacific region has been the fastest-growing destination for U.S. exports, expanding by 89% between 2001 and 2010, compared to 48% growth in U.S. exports to Europe.11 Our own analysis of UN and IMF data shows that the value of U.S. imports into 12 key Asia-Pacific markets12 rose from $208.4 billion in 2000 ($253 billion in 2010 dollars) to $358.6 billion in 2010.13

Yet, at the same time, America’s share of Asia-bound trade has been declining—in many cases quite significantly.14 According to our analysis, from 2000 to 2010, the U.S. share of total goods imports into these same 12 Asia-Pacific markets fell by 43%—from 14.3 to 8.2%—even as the value of those same imports consistently increased:

Imports from United States into Key Asia-Pacific Markets

Imports from United States into Key Asia-Pacific Markets

U.S. Goods Exports to 12 Leading Asia-Pacific Economies

U.S. Goods Exports to 12 Leading Asia-Pacific Economies

Why is this happening?

One of the most significant reasons for the falling U.S. market share in the Asia-Pacific is the continuing proliferation of trade deals among other countries in the region. In 2000, the Asia Pacific region had four major trade arrangements. Today, there are 39 major deals. The ASEAN countries15 now collectively have separate trade agreements with China, Japan, and Korea. The region is exploring new trade architectures, including a possible ASEAN+6 deal (ASEAN plus China, Japan, Korea, Australia, India, and New Zealand).16 And China, Japan, and South Korea have recently opened exploratory talks on a trilateral trade agreement.17

Because most of these trade arrangements exclude the United States, American exporters are increasingly on the outside looking in when it comes to new opportunities in growing Asian markets. As countries in the region continue to pursue trade deals that reduce trade barriers among themselves, their existing barriers to U.S. exports will loom even larger.18 Experts warn that regional trade arrangements that shut out the United States would significantly reduce America’s ability to tap into future Asian growth.19

America’s share of Asian markets is falling for other reasons, as well. Asia’s highly competitive producers are worthy rivals and aren’t giving up new regional opportunities and consumers without a fight.20 Other countries have also been highly aggressive in promoting their trade in the region, through means that are both legitimate (e.g., Germany) and unfair (e.g., certain Chinese practices). And, as we detailed in our July 2010 Third Way report, “Why We Need Fairer Trade: How Export Barriers Cost America Jobs,” countries throughout Asia continue to use a wide array of highly discriminatory, unfair, and illegal barriers to block American exports.21

Why is this important?

The long-term decline in the U.S. share of Asia-Pacific markets points to the risk that strong headwinds will keep U.S. exports from meeting their full potential in the region. Our exports to the region will grow, but not as robustly as they could. And that means America would get a much smaller economic boost from the vast growth in Asia-Pacific trade in the years ahead.

Finding #2

Key Asia-Pacific Markets Will Import Almost $10 Trillion in Goods in 2020.

The world’s top eight container ports are in the Asia-Pacific.22 In the coming decade, these already-busy container hubs will need to ramp up even further to serve a rapidly growing Asia.

Asia-Pacific economies have been on a growth tear for the past two decades23 and strong, continued economic growth is forecast for the region through 2020 and beyond. Six of the world’s ten fastest-growing major economies in the coming decade (including China and India) will be Asian countries. Virtually all of the Asia-Pacific region will be growing at rates much faster than the United States.24

Growing Asian demand will be propelled by a rapidly expanding flock of new middle class consumers. The Asia-Pacific middle class is expected to triple by 2020, growing from 525 million in 2009 to 1.75 billion in 2020, vaulting from less than one-third to over one-half of the world’s total.25 In turn, this swelling and increasingly urban middle class will power a huge escalation in private consumption across developing Asia, in countries including Indonesia, Malaysia, and Vietnam. (By 2020, China’s private consumption alone is forecast to increase some ten-fold–to $10 trillion.26)

Most importantly from America’s perspective, this robust growth will power surging trade in the Asia-Pacific, creating countless opportunities for U.S. exporters.27 Third Way projects that, by 2020, annual imports of goods by 12 leading Asia-Pacific economies will surge to $9.63 trillion (in 2010 dollars), more than double their value ($4.38 trillion) in 2010.28

Total Goods Imports by 12 Leading Asia-Pacific Economies (Trillions of Constant 2010 U.S. Dollars)

Total Goods Imports by 12 Leading Asia-Pacific Economies

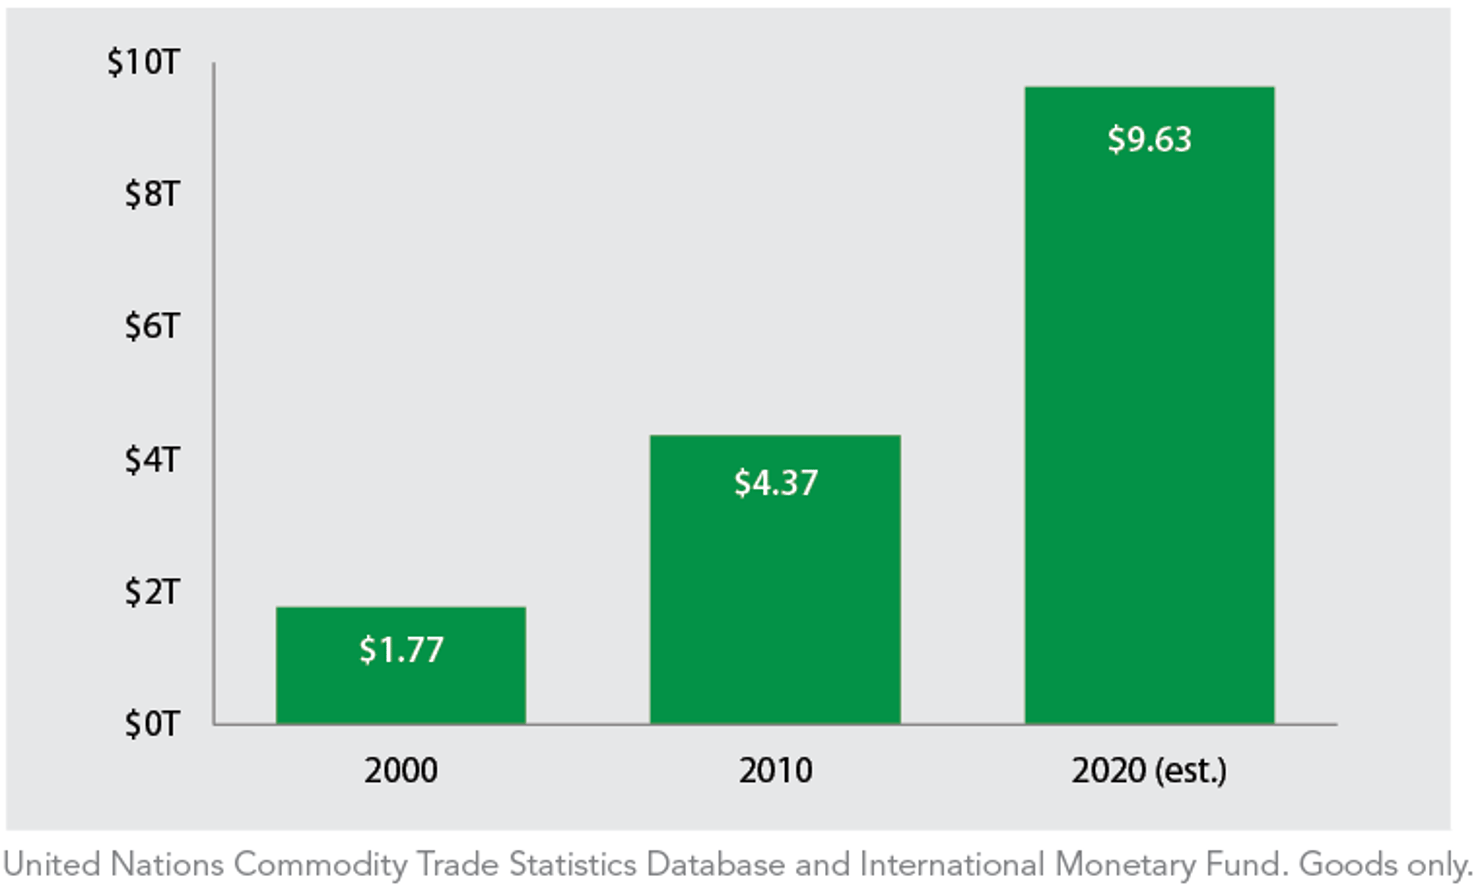
To put this vast 2020 Asia-Pacific import market into perspective, an import market of $9.63 trillion (in 2010 dollars) would be two-thirds the size of the entire U.S. economy in 2010.29 And our projection does not include Asian imports of services, such as finance, logistics, entertainment, and professional services, which will account for hundreds of billions of dollars or more in additional imports in 2020.30

Finding #3

A Bigger U.S. Share of Asia-Pacific Markets Would Increase U.S. Exports in 2020 by Almost $600 Billion.

What would it mean for America if the United States could help our highly competitive exporters and workers31 grab a bigger slice of the growing Asia-Pacific economic pie?

Based on our import projections for 12 key Asia-Pacific markets, in 2020 alone:

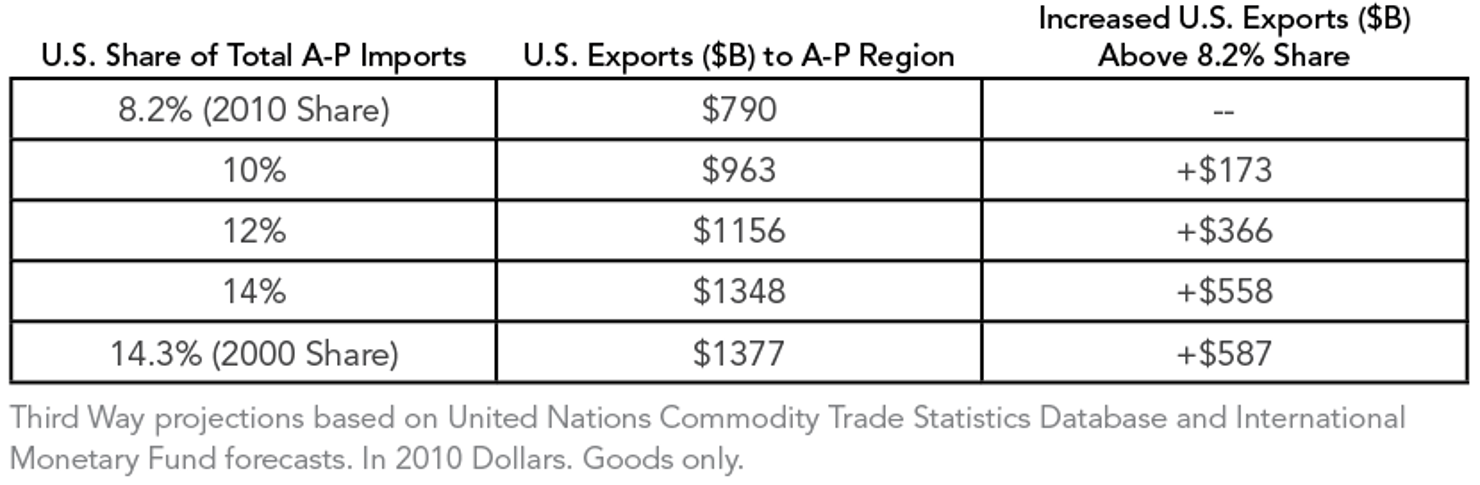
  • Recapturing America’s year 2000 14.3% share of these markets would mean $1.38 trillion in U.S. goods exports to these markets, supporting over 7 million U.S. jobs; and
  • A 14.3% import share would yield $587 billion more in U.S. exports and over 3 million more U.S. jobs than America’s 2010 share of 8.2%.32

To put these added exports into perspective, $587 billion in additional exports is equivalent to almost half of America’s total goods exports to the entire world in 2010.33 And these projections cover only goods. America’s highly competitive service providers could add even more exports and jobs through an increased share of Asia’s lucrative and growing market for services.34

Projected U.S. Exports from Higher U.S. Shares of 12 Key Asia-Pacific Markets (2020)

Projected U.S. Exports from Higher U.S. Shares of 12 Key Asia-Pacific Markets (2020)

But for America’s exporters to capture a larger share of growing Asia-Pacific markets, the United States must continue to pursue a sustained, long-term effort to clear away trade barriers that keep American trade from achieving its full potential throughout the Asia-Pacific. We offer below a number of recommendations for this important effort—recommendations which we will expand upon in future reports.

Recommendations

To ensure that America’s economy benefits fully from emerging Asia’s dynamic growth, the United States should set the ambitious goal of returning the U.S. share of exports to key Asia-Pacific markets to the higher levels America enjoyed in 2000.

To do this, the United States must be an active “rules-maker” in the Asia-Pacific region. It must shake off old notions about trade agreements, conclude a strong TPP agreement, and set the ambitious goal of establishing a comprehensive, rules-based trade deal spanning the Asia-Pacific–and including India and China–within the next decade.

Trade integration in the Asia-Pacific has strong momentum; it will proceed whether America engages or not. If America does not fully engage in Asia, our exporters will lose valuable access to Asian markets. Studies project that we would lose billions of dollars in current trade and hundreds of thousands of current jobs, and we’d lose even more in future trade and jobs,35 And if we settle for being “rules-takers” and let China and others set rules, Asia’s trade template won’t include strong disciplines on issues that matter to the United States, such as IP protection, sound regulation, state-owned enterprises, and labor and environmental rules.

On the other hand, if the United States and like-minded partners can establish strong, modern, and comprehensive trade rules for the overall Asia-Pacific, America would be poised to expand its share of Asia’s vibrant growth.36

The TransPacific Partnership trade agreement would create a vital new trade architecture: an American-influenced, comprehensive, rules-based model for Asia-Pacific trade. The TPP would break down barriers on an across-the-board basis with eight countries that, together, comprise the fourth largest export market for U.S. goods and services. Perhaps even more importantly, the TPP would provide a firm foundation on which America and its partners can build a broader architecture for rules-based trade among the nations of the greater Asia-Pacific, eventually including India, Japan, China and others.37

Finally, the United States must ensure that American exporters and their workers can fully seize opportunities in Asia-Pacific markets under current trade rules. This will require:

  • Ramped up trade enforcement, focusing especially on the most economically significant and pernicious trade barriers in emerging Asia;38
  • Smart investments in trade resources to assure that America has enough boots on the ground to open up key Asian markets to U.S. trade;39 and
  • A comprehensive initiative to promote U.S. exports to Asia that builds on the successes of the Administration’s National Export Initiative.40

Building a comprehensive, rules-based structure for Asia-Pacific trade will pose novel issues and countless challenges, both at home and abroad. It will require great patience and years of sustained effort. But, like America’s transformative work in building durable transatlantic institutions in the aftermath of World War II, a sound system of rules for Asia-Pacific trade will yield important benefits for the United States and vast opportunities for America’s Middle Class.

And it will ensure that more and more of the containers arriving at busy Asian ports are filled with “Made in the USA” products.

Topics
  • All Topics
  • Foreign Relations144
  • Trade99

Endnotes

  1. Joe Nocera, “A Revolution that Came In a Box,” The New York Times, May 13, 2006. Accessed April 11, 2012. Available at: http://query.nytimes.com/gst/fullpage.html?res=9406E5DB143EF930A25756C0A9609C8B63&pagewanted=all; See also “Review of Maritime Transport 2011,” United Nations Conference on Trade and Development, 2011, pp. 10, 23, UNCTAD/RMT/2001. Accessed April 11, 2012. Available at: http://www.unctad.org/en/docs/rmt2011_en.pdf.

  2. Container traffic is an important measure of world commerce, and imbalances in container flows can vividly reflect imbalances in global trade. “Container Port Traffic,” The World Bank. Accessed April 11, 2012. Available at: http://data.worldbank.org/indicator/IS.SHP.GOOD.TU. For example, strong growth in global trade since the 2008-09 downturn has resulted in a shortage of shipping containers on the world market. United Nations Conference on Trade and Development, p.22.

  3. Jean-Paul Rodrigue, Claude Comtois, and Brian Slack, The Geography of Transport Systems, Second Edition, New York. Accessed April 11, 2012. Available at: http://people.hofstra.edu/geotrans/; See also United Nations Conference on Trade and Development, p. 24.

  4. Jean-Paul Rodrigue, Claude Comtois, and Brian Slack, The Geography of Transport Systems, Second Edition, New York. Accessed April 11, 2012. Available at: http://people.hofstra.edu/geotrans/; See also United Nations Conference on Trade and Development, p. 24.

    Imports from Asia provide significant economic benefits to the United States, supporting millions of good jobs, furnishing intermediate materials that keep U.S. manufacturers competitive, and helping American consumers stretch tight household budgets. Our focus in this report is on enhancing American economic growth and employment by increasing U.S. exports, especially to emerging Asia.

  5. There are various definitions of “Asia” and “Asia-Pacific.” In this report, our focus is primarily on the export opportunities available to the United States in the countries of East Asia and Oceana, as well as India. Our discussion of Asia-Pacific trade agreements generally encompasses trade deals among East Asian countries as well as trans-Pacific deals involving the United States and other Pacific Rim countries in the Americas. Other sources, analyses, and groupings use different definitions of these terms.

  6. By 2020, Asia-Pacific countries will be home to over one billion new, middle class consumers, who will power trillions of dollars in new demand for goods and services. “Trading Places: The emergence of new patterns of international trade,” Ernst & Young, 2011, p. 7. Accessed April 11, 2012. Available at: http://www.ey.com/GL/en/Issues/Business-environment/Trading-places--New-patterns-of-international-trade; See also Karen Harris, Austin Kim, and Andrew Schwedl, “The Great Eight: Trillion Dollar Growth Trends to 2020,” Bain & Company, September 9, 2011. Accessed April 11, 2012. Available at: http://www.bain.com/publications/articles/eight-great-trillion-dollar-growth-trends-to-2020.aspx.

  7. “The future redefined: Asia Pacific at an inflection point,” PwC, (PwC’s 2011 APEC CEO Survey), Main Report, p. 3. Accessed April 12, 2012. Available at: http://www.pwc.com/jp/en/japan-news/assets/pdf/apec-ceo-summit2011-111108.pdf.

  8. “Trading Places: The emergence of new patterns of international trade,” Ernst & Young, 2011, p. 7. Accessed April 11, 2012. Available at: http://www.ey.com/GL/en/Issues/Business-environment/Trading-places--New-patterns-of-international-trade.

  9. “The future redefined: Asia Pacific at an inflection point,” PwC, (PwC’s 2011 APEC CEO Survey), Main Report, pp. 3, 8. Accessed April 12, 2012. Available at: http://www.pwc.com/jp/en/japan-news/assets/pdf/apec-ceo-summit2011-111108.pdf.

  10. “Asia’s Role in the New United States Export Economy,” Asian Development Bank, ADB Economics Working Paper Series, No. 250, February 2011. Accessed April 13, 2012. Available at: http://www.adb.org/Documents/Working-Papers/2011/Economics-WP250.pdf; See also “HSBC Global Connections, Trade Forecast Update: Global,” HSBC, February 2012. Accessed April 13, 2012. Available at: http://tradeconnections.corporate.hsbc.com/en/News-and-Opinion/~/Media/TradeConnections/Files/trade-forecast/february-2012/Global%20Trade%20Forecast%20-%20February%202012.pdf; See also “U.S. Metro Economies: Exports in the Next Decade,” IHS Global Insight, Prepared for the United States Conference of Mayors and the Council on the Metro Economies and the New American City, February 2012, p. 10. Accessed April 12, 2012. Available at: http://usmayors.org/exportsandports/media/metro-exports-report.pdf.

  11. Grace Ruch, “Fast and Furious: Asia-Pacific Fastest Growing Market for US Exports,” Japan Matters for America, June 15, 2011. Accessed April 16, 2012. Available at: http://www.japanmattersforamerica.org/2011/06/us-asia-export-growth/.

  12. China, Japan, Hong Kong, Korea, India, Singapore, Australia, Thailand, Malaysia, Indonesia, Philippines and New Zealand. We excluded smaller markets and markets, like Taiwan and Vietnam, for which no 2010 UN data is currently available.

  13. United Nations Commodity Trade Statistics Database. Accessed May 2, 2012. Available at: http://comtrade.un.org/db; See also “World Economic Outlook,” International Monetary Fund, April 2012. Accessed May 2, 2012. Available at: http://www.imf.org/external/pubs/ft/weo/2012/01/weodata/index.aspx.

  14. The U.S. share of imports into the markets of its 20 Asia-Pacific Economic Cooperation (APEC) partners and its eight TransPacific Partnership (TPP) negotiating partners has also seen significant erosion in recent years. From 1989 to 2007, the U.S. share of exports to its 20 APEC partners fell from 25% to less than 17%. “Trade Creation in the APEC Region: Measurement of the Magnitude of and Changes in Intra-regional Trade since APEC’s Inception,” Asia-Pacific Economic Cooperation, October 2009, p. 11. Accessed April 12, 2012. Available at: http://publications.apec.org/publication-detail.php?pub_id=944. APEC’s members are Australia, Brunei Darussalam, Canada, Chile, China, Hong Kong, Indonesia, Japan, Korea, Malaysia, Mexico, New Zealand, Papua New Guinea, Peru, Philippines, Russia, Singapore, Taiwan, Thailand, United States, and Vietnam. Ibid. Between 2000 and 2010, the U.S. share of exports to the eight other countries negotiating the TPP (Australia, Brunei Darussalam, Chile, Malaysia, New Zealand, Peru, Singapore, and Vietnam) slid from 16 to 11%.

    See also Brock Williams, “Trans-Pacific Partnership (TPP) Countries: Comparative Trade and Economic Analysis,” Congressional Research Service, February 8, 2012, p. 24. Accessed April 19, 2012. Available at: http://digitalcommons.ilr.cornell.edu/cgi/viewcontent.cgi?article=1899&context=key_workplace.

  15. The Association of Southeast Asian Nations (ASEAN) consists of Brunei Darussalam, Cambodia, Indonesia, Laos, Malaysia, Myanmar, Philippines, Singapore, Thailand, and Vietnam. “ASEAN Member States,” Association of Southeast Asian Nations. Accessed May 28, 2012. Available at: http://www.aseansec.org/18619.htm.

  16. Brock Williams, “Trans-Pacific Partnership (TPP) Countries: Comparative Trade and Economic Analysis,” Congressional Research Service, February 8, 2012, p. 8. Accessed April 19, 2012. Available at: http://digitalcommons.ilr.cornell.edu/cgi/viewcontent.cgi?article=1899&context=key_workplace; See also Peter A. Petri, Michael G. Plummer, and Fan Zhai, “The Trans-Pacific Partnership and Asia-Pacific Integration: A Quantitative Assessment,” East-West Center Working Papers, Economics Series, No. 119, October 24, 2011, p. 5. Accessed April 20, 2012. Available at: http://www.eastwestcenter.org/publications/trans-pacific-partnership-and-asia-pacific-integration-quantitative-assessment.

  17. Aaron Back, Toko Sekiguchi, and Yuka Hayashi, “China, Japan, South Korea Agree to Trade Talks,” The Wall Street Journal, May 13, 2012. Accessed May 18, 2012. Available at: http://online.wsj.com/article/SB10001424052702304371504577402773076428202.html.

  18. For instance, the U.S. Department of Agriculture forecasts that duty eliminations under new ASEAN trade deals with China, Australia, and New Zealand will reduce U.S. fruit and processed food exports to the region by some $350 million. See United States, Department of Agriculture, Economic Research Service, “Are Competitors’ Free Trade Agreements Putting U.S. Agricultural Exporters at a Disadvantage?’” June 11, 2011. Accessed April 20, 2012. Available at: http://www.ers.usda.gov/AmberWaves/June11/Features/CompetitorsFTA.htm.

  19. “Trading Places: The emergence of new patterns of international trade,” Ernst & Young, 2011, p. 31. Accessed April 11, 2012. Available at: http://www.ey.com/GL/en/Issues/Business-environment/Trading-places--New-patterns-of-international-trade; See also Peter A. Petri, Michael G. Plummer, and Fan Zhai, “The Trans-Pacific Partnership and Asia-Pacific Integration: A Quantitative Assessment,” East-West Center Working Papers, Economics Series, No. 119, October 24, 2011, p. 5. Accessed April 20, 2012. Available at: http://www.eastwestcenter.org/publications/trans-pacific-partnership-and-asia-pacific-integration-quantitative-assessment

  20. Indeed, exporters in Asian countries are forecast to be the biggest beneficiaries of future Asian growth. “Trading Places: The emergence of new patterns of international trade,” Ernst & Young, 2011, p. 22. Accessed April 11, 2012. Available at: http://www.ey.com/GL/en/Issues/Business-environment/Trading-places--New-patterns-of-international-trade.

  21. Ed Gerwin and Anne Kim, “Why We Need Fairer Trade: How Export Barriers Cost America Jobs,” Report, Third Way, July 2010. Accessed May 1, 2012. Available at: http://www.thirdway.org/subjects/8/publications/318; See also Ed Gerwin and Ryan McConaghy, “China’s Trade Barrier Playbook: Why America Needs a New Game Plan,” Report, Third Way, February 2012. Accessed May 1, 2012. Available at: http://www.thirdway.org/subjects/8/publications/483.

  22. “Review of Maritime Transport 2011,” United Nations Conference on Trade and Development, 2011, p. 89, UNCTAD/RMT/2001. Accessed April 11, 2012. Available at: http://www.unctad.org/en/docs/rmt2011_en.pdf

  23. Between 1989 and 2007, 13 of the 21 members of APEC grew faster than the world average. Nine grew at annual rates of over 8%. Asia-Pacific Economic Cooperation, pp. 4-6.

  24. IHS Global Insight, p. 2. All but four of the 21 member economies of APEC are projected to grow faster than the U.S. forecast of under 2.5%. Korea, Malaysia, Thailand, Philippines, and Indonesia are projected to grow by over 4% annually, Vietnam by over 6%, and China at 8%. “The future redefined: Asia Pacific at an inflection point,” PwC, (PwC’s 2011 APEC CEO Survey), Data Points. Accessed April 12, 2012. Available at: http://www.pwc.com/us/en/apec-ceo-summit-2011/download.jhtml.

  25. Ernst & Young, p.7. This estimate is based on OECD forecasts of growth in the number of individuals living in households with incomes of $10 to $100 per day in PPP terms. “The future redefined: Asia Pacific at an inflection point,” PwC, (PwC’s 2011 APEC CEO Survey), Data Points. Accessed April 12, 2012. Available at: http://www.pwc.com/us/en/apec-ceo-summit-2011/download.jhtml.. 

  26. “The future redefined: Asia Pacific at an inflection point,” PwC, (PwC’s 2011 APEC CEO Survey), Main Report, p. 8. Accessed April 12, 2012. Available at: http://www.pwc.com/jp/en/japan-news/assets/pdf/apec-ceo-summit2011-111108.pdf.

  27. Over the next five years, Asia-Pacific trade is forecast to expand by 6.5% a year, much faster than global trade (3.78%) or U.S. trade (2%). By 2026, Asia-Pacific trade is projected to grow by 120%, versus 86% for the world and 69% for the United States. “HSBC Global Connections, Trade Forecast Update: Global,” HSBC; See also “HSBC Global Connections, Trade Forecast Update: USA,” HSBC, February 2012. Accessed April 13, 2012. Available at: http://www.joc.com/joc_inc/pdf/FINAL_HSBC_US_TRADE_FORECAST_FEB_21_2012.pdf; See also Greg Knowler, “Good times lie ahead in Asia Pacific trade,” Cargonews Asia, March 5, 2012. Accessed April 13, 2012. Available at: http://www.cargonewsasia.com/secured/article.aspx?id=32&article=27881.

  28. Our projection is based on 2010 United Nations import data for China, Japan, Hong Kong, Korea, India, Singapore, Australia, Thailand, Malaysia, Indonesia, Philippines, and New Zealand, and on International Monetary Fund projections of import growth into these markets.United Nations Commodity Trade Statistics Database; See also International Monetary Fund.

  29. United States, Department of Commerce, Bureau of Economic Analysis, “National Economic Accounts – Gross Domestic Product (GDP).” Accessed May 28, 2012. Available at: http://www.bea.gov/national/index.htm#gdp.

  30. According to forecasts, by 2020, U.S. services exports to the Asia-Pacific region will increase by some $214 billion. “Trading Places: The emergence of new patterns of international trade,” Ernst & Young, 2011, p. 7. Accessed April 11, 2012. Available at: http://www.ey.com/GL/en/Issues/Business-environment/Trading-places--New-patterns-of-international-trade.

  31. “Asia’s Role in the New United States Export Economy,” Asian Development Bank, ADB Economics Working Paper Series, No. 250, pp.5-11, February 2011. Accessed April 13, 2012. Available at: http://www.adb.org/Documents/Working-Papers/2011/Economics-WP250.pdf.

  32. The Commerce Department estimates that, in 2011, each $1 billion in exports supported 5,080 jobs. United States, Department of Commerce, International Trade Administration, “Jobs Supported by Exports: An Update,” March 12, 2012. Accessed May 22, 2012. Available at: http://www.trade.gov/mas/ian/build/groups/public/@tg_ian/documents/webcontent/tg_ian_003639.pdf.

  33. United States, Census Bureau, Foreign Trade Division, “U.S. International Trade in Goods and Services, 1992-Present.” Accessed May 28, 2012. Available at: http://www.census.gov/foreign-trade/statistics/historical/exhibit_history.pdf. Total U.S. goods exports in 2010 were $1.29 trillion; See also United States, Department of Commerce, International Trade Administration, “Jobs Supported by Exports: An Update,” March 12, 2012. Accessed May 22, 2012. Available at: http://www.trade.gov/mas/ian/build/groups/public/@tg_ian/documents/webcontent/tg_ian_003639.pdf

    .

  34. “Trading Places: The emergence of new patterns of international trade,” Ernst & Young, 2011, p. 7. Accessed April 11, 2012. Available at: http://www.ey.com/GL/en/Issues/Business-environment/Trading-places--New-patterns-of-international-trade.

  35. C. Fred Bergsten and Jeffrey J. Schott, “Submission to the USTR in Support of a Trans-Pacific Partnership Agreement,” Peterson Institute for International Economics, January 25, 2010. Accessed April 23, 2012. Available at: http://www.iie.com/publications/papers/paper.cfm?ResearchID=1482. An East-Asian trade agreement that excludes the United States could cost the United States at least $25 billion in trade in the first year alone, and some 200,000 high-paying jobs; See also “Trading Places: The emergence of new patterns of international trade,” Ernst & Young, 2011, p. 7. Accessed April 11, 2012. Available at: http://www.ey.com/GL/en/Issues/Business-environment/Trading-places--New-patterns-of-international-trade.

  36. Peter A. Petri, Michael G. Plummer, and Fan Zhai, “The Trans-Pacific Partnership and Asia-Pacific Integration: A Quantitative Assessment,” East-West Center Working Papers, Economics Series, No. 119, October 24, 2011, p. 5. Accessed April 20, 2012. Available at: http://www.eastwestcenter.org/publications/trans-pacific-partnership-and-asia-pacific-integration-quantitative-assessment. Comprehensive trade agreements can play a key role in increasing the share of U.S. exports to foreign markets. The U.S. share of Chile’s import market has grown from 12.4% in 2003 (the year before the United States implemented its FTA with Chile) to 17.6% in 2010. Similarly, America’s share of imports into Peru has grown from 17.6% in 2005 (the year before implementation of the FTA with Peru) to 19.4% in 2010. Third Way calculations based on the United Nations Commodity Trade Statistics Database.

  37. Beyond TPP, U.S. efforts to expand rules-based trade in the Asia-Pacific must also proceed aggressively in other forums (e.g., APEC) and with other groups of countries (e.g., ASEAN). Office of United States Trade Representative, “Remarks of U.S. Trade Representative Ron Kirk at Singapore Management University on U.S. Asia-Pacific Trade,” April 26, 2012. Accessed May 1, 2012. Available at: http://www.ustr.gov/about-us/press-office/press-releases/2011/april/remarks-us-trade-representative-ron-kirk-singapore-m.

  38. Office of the United States Trade Representative, “Launch of the Interagency Trade Enforcement Center.” Accessed April 24, 2012. Available at: http://www.ustr.gov/about-us/press-office/blog/2012/february/launch-interagency-trade-enforcement-center-itec.

  39. United States, Department of Commerce, “The Department of Commerce Budget in Brief, Fiscal Year 2013,” John E. Bryson, Secretary, pp. 53-58. Accessed April 24, 2012. Available at: http://www.osec.doc.gov/bmi/budget/FY13BIB/fy2013bib_final.pdf.

  40. United States, Department of Commerce, “On the Two-Year Anniversary of the National Export Initiative Successes Abound,” Guest Blog Post by Commerce Secretary John Bryson, March 12, 2012. Accessed April 24, 2012. Available at: http://www.commerce.gov/print/blog/2012/03/12/two-year-anniversary-national-export-initiative-successes-abound.

Subscribe

Get updates whenever new content is added. We'll never share your email with anyone.