Report Published June 23, 2017 · Updated June 23, 2017 · 16 minute read
How to Build a House [Majority]
Lanae Erickson & Ryan Pougiales
Takeaways
All eyes are on the House in 2018. The conversation about which districts are competitive and how Democrats might establish a broad electoral path to take back the majority will consume political circles. Yet the current framework that divides districts into Clinton-Republican or Trump-Democratic groupings doesn’t provide much substantive guidance and lumps together districts that are actually quite dissimilar. Instead, we offer a new set of categories for thinking about the competitive House districts—one that’s built on characteristics that tell you more about voters’ concerns and motivations in these majority-making places.
Introduction
To the chagrin of many Americans, last year’s presidential race persists as a daily part of our national political dialogue. One vestige of 2016 is that it has shaped how we classify competitive U.S. House districts. It has become convenient shorthand to break down some of the most competitive districts that will determine control of the House in 2018 as Clinton-Republican districts (districts that voted for Hillary Clinton and a Republican U.S. House member), and conversely, Trump-Democratic districts.
But using a 2016 framework to assess the baseline competitiveness of districts falls short on an analytical level. Lumping together districts this way overlooks crucial internal distinctions within these categories. For instance, looking at educational attainment in Clinton-Republican districts, 51% of adults in New Jersey’s Seventh Congressional District have bachelor’s or professional degrees, compared to 17% in California’s 10th District. This makeshift framework simply isn’t useful for understanding the underlying factors driving voters in these divergent districts.
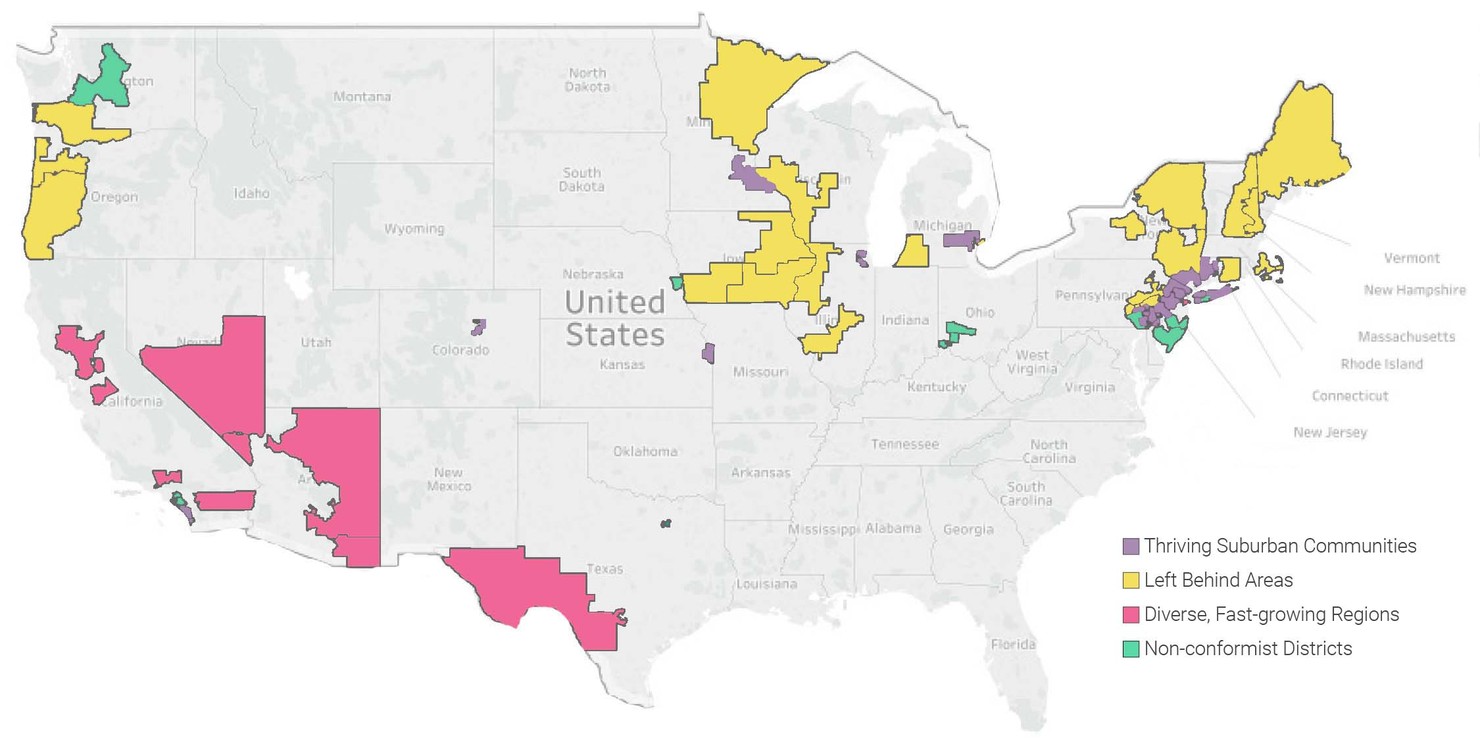
To address this shortcoming, we dug into 65 of the most competitive U.S. House districts and came up with a new framework. We call these top 65 districts Majority Makers, since they form the battleground where Congressional majorities are won. We used 48 Census characteristics to explore the underlying forces at work in these districts. This process yielded four distinct kinds of Majority Maker districts:
- Thriving Suburban Communities;
- Left Behind Areas;
- Diverse, Fast-Growing Regions; and,
- Non-Conformist Districts that don’t fit neatly into the other categories.
Majority Maker Districts
This report will lay out this new framework for understanding the Majority Maker districts, and it will serve as a more useful analytical frame going into 2018.
Majority Maker Districts
The 65 Majority Maker districts categorized in this report were identified using Cook Political Report’s Partisan Voter Index (PVI) data. Cook’s PVI scores use results from the last two presidential elections to measure the partisan nature of each Congressional district. The set of Majority Maker districts consists of those with PVI scores within the D+5 to R+5 range—potentially competitive districts that could foreseeably change hands. The Majority Makers were then categorized by analyzing district-level Census measures and grouping them together based on underlying characteristics shared among like districts. Note, a handful of districts were excluded from this analysis because key data were unavailable for them. Please see the methodology section at the end for more.
Before proceeding, it’s worth noting that Majority Maker districts as an aggregate group do have a profile that distinguishes them from red and blue districts. Generally, these districts are doing better than the country at large. Looking at the table below, they’re more educated and have higher median household incomes. On racial demographics, they’re moderately more diverse than red districts, but far less diverse than blue districts.
Congressional District Universes
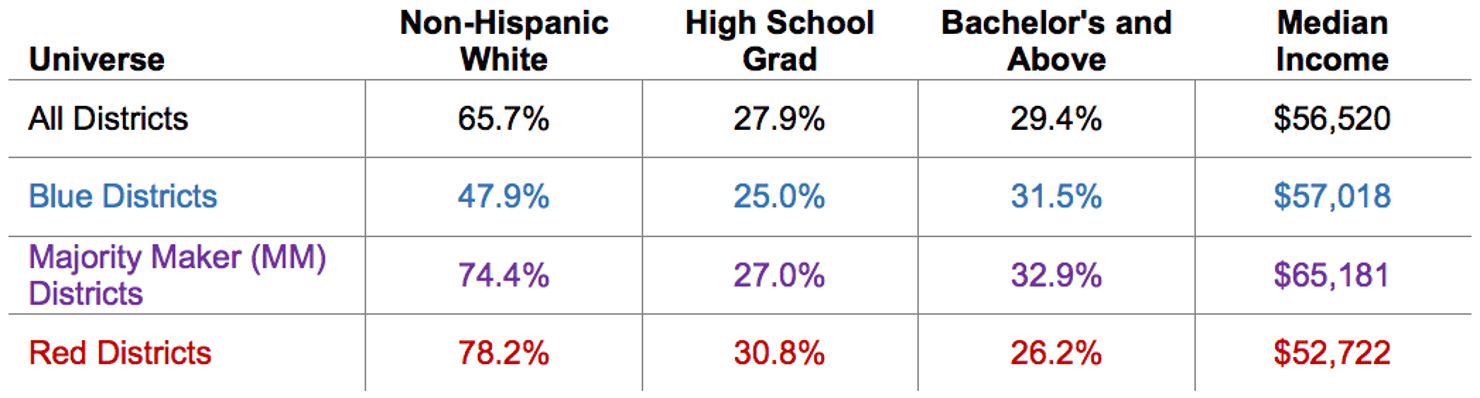
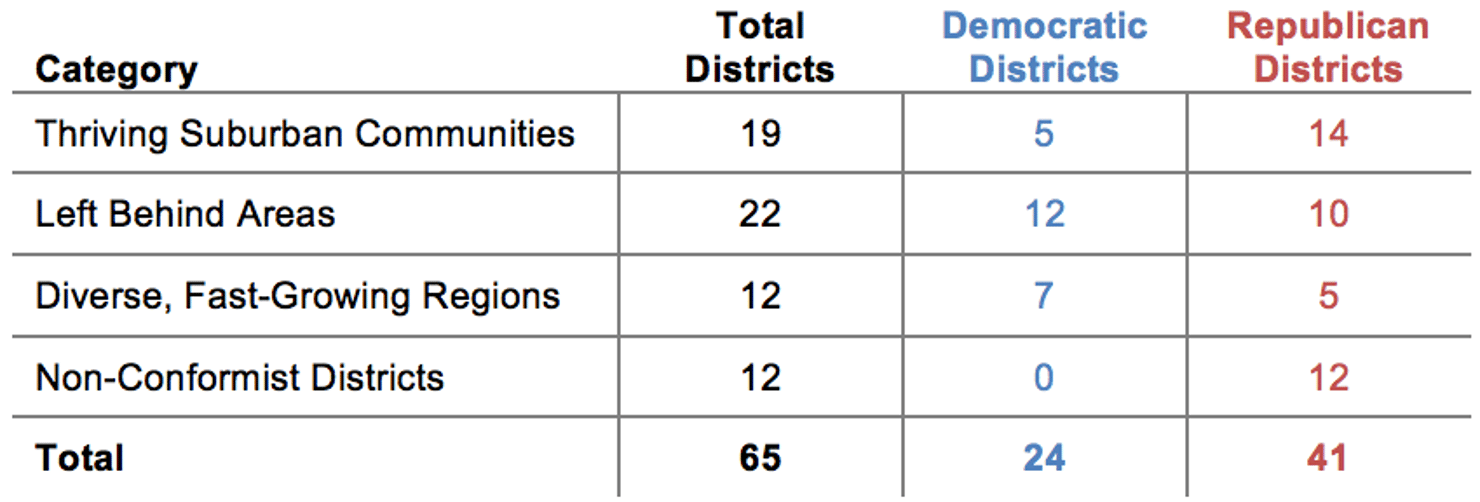
Currently, Democrats control 24 of these seats, while Republicans hold 41. To retake the House, Democrats would need to hold every seat they have and pick up 24 more.
Majority Maker Categories
Thriving Suburban Communities
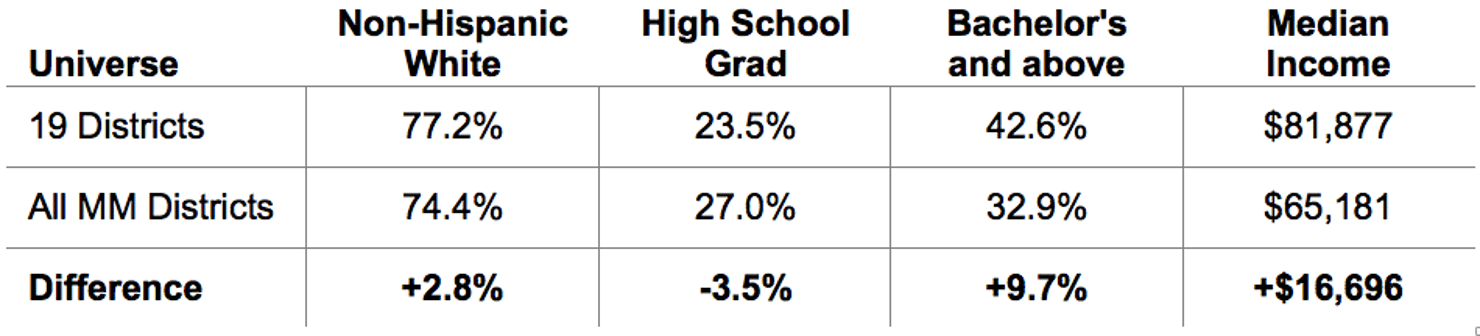
Districts in Thriving Suburban Communities are flourishing; they’re plugged into the new economy and powered by robust human capital. In total, 19 districts fall within this category: five are held by Democrats, 14 by Republicans. The average PVI in these districts is R+1.4. They’re less diverse than Majority Maker districts as a whole, but not racially homogeneous. A logical correlate to educational attainment is income and, unsurprisingly, these districts are well-off. Electorally, when evaluating how presidential candidates have done in these districts since 2008, they’re becoming more Democratic—but the change isn’t drastic, yet.
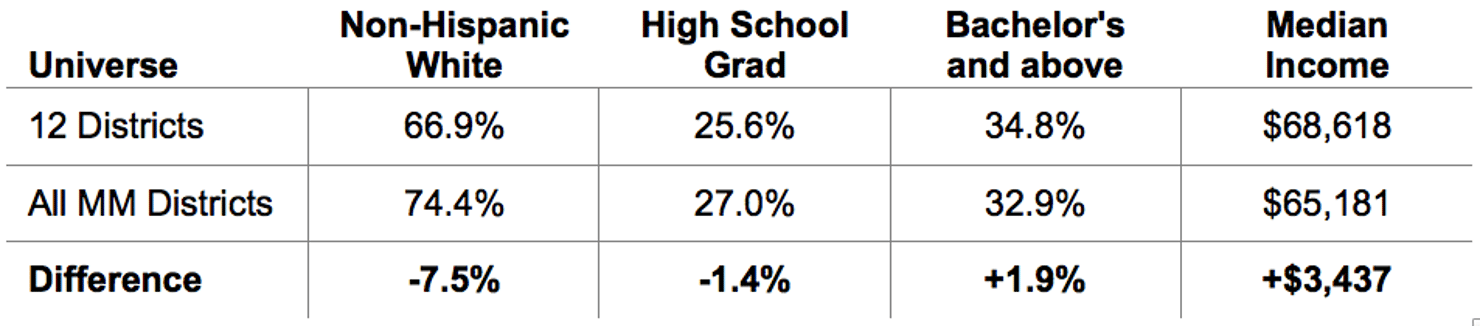
Digging into the Census characteristics, the statistic that stands out is educational attainment. On average, 42.6% of adults in these districts have a bachelor’s or professional degree, compared to 32.9% of adults in all Majority Maker districts. Relatedly, the districts are high-income; the average median household income is $81,877. The average voting-age population is 77.2% non-Hispanic white. This is marginally less diverse than Majority Maker districts as a whole, but it doesn’t stand out as a defining characteristic. Georgia’s Sixth Congressional District, site of the special election between Jon Ossoff and Karen Handel, resembles the districts in this category, but its PVI score is too Republican-leaning to qualify as a Majority Maker district.
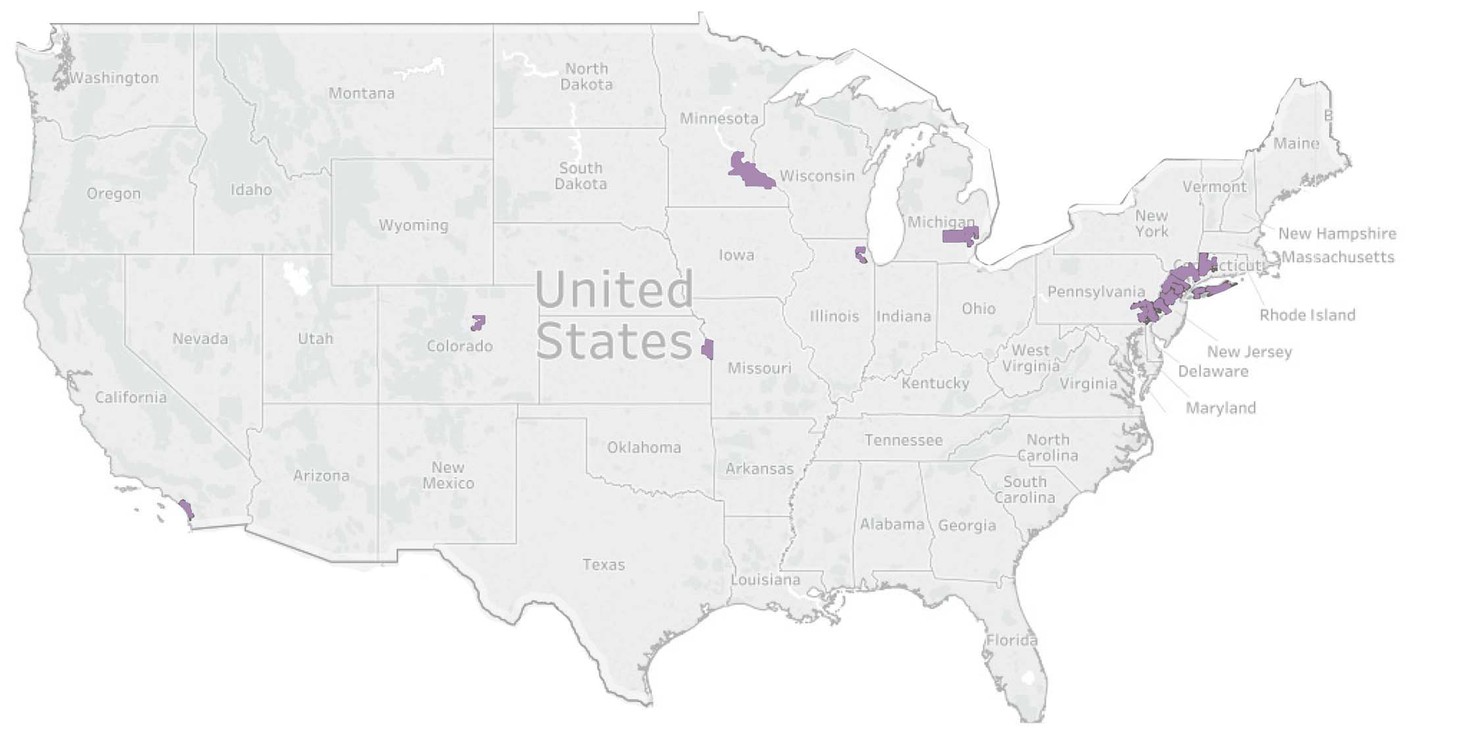
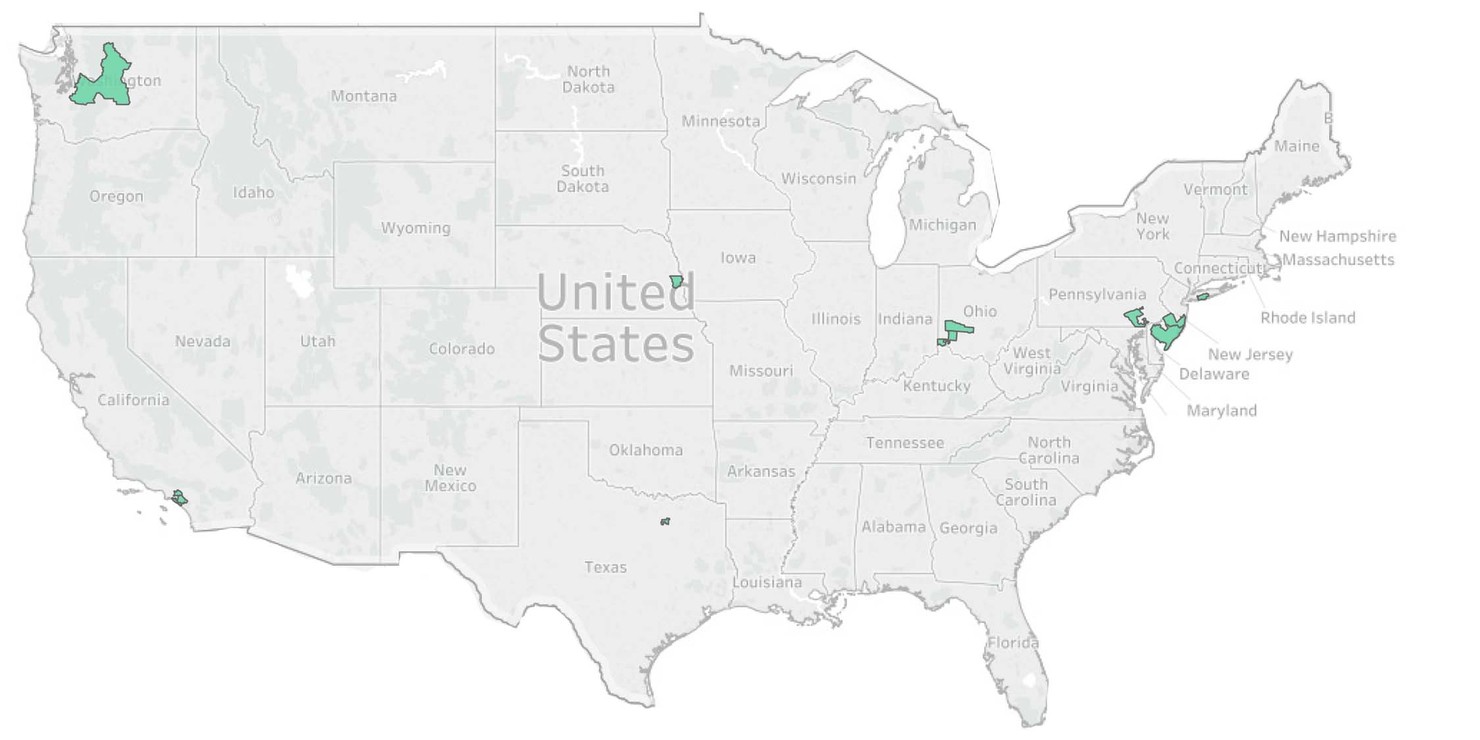
Thriving Suburban Communities – Characteristics
As the category name implies, these districts are concentrated in the immediate vicinity of urban hubs. Shown below in the map, several of these districts line the Acela Corridor—an economically vibrant stretch of the Northeast that runs from Washington, D.C., through Philadelphia, New York City, and ending in Boston—and the remaining districts are located near major cities elsewhere in the country. The housing occupancy rate in these districts is 93.1%, more than four points above the average in Majority Maker districts, and the median age here is above average at 40.2.
Thriving Suburban Communities – Districts
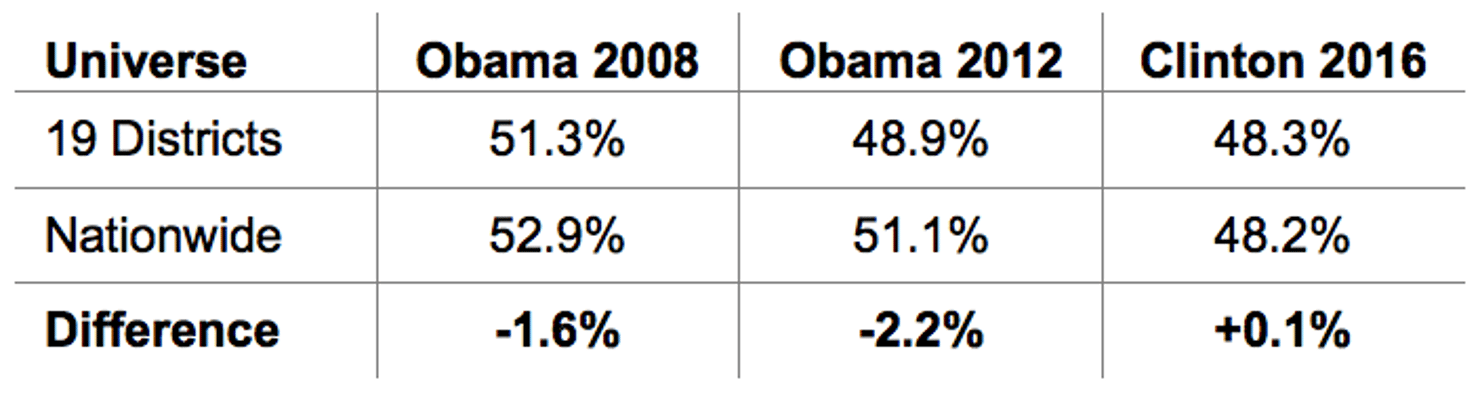
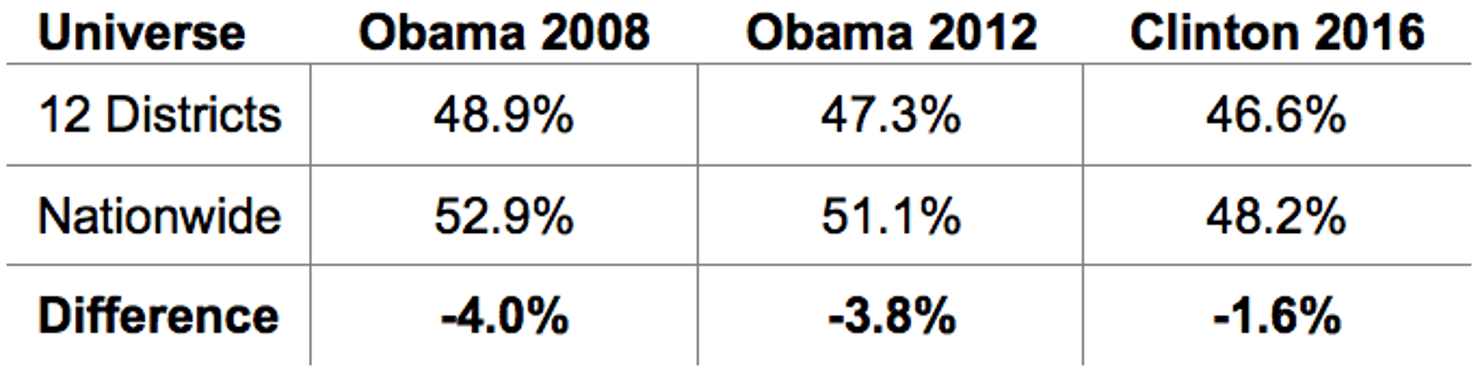
By comparing how Democratic presidential candidates have done in these districts, relative to national performance, we get a sense of the partisan trajectory in these communities. In 2008, districts classified as Thriving Suburban Communities voted 1.6 points less Democratic than the country as a whole, but last year these districts voted one-tenth of a point more Democratic than the country. This makes for a 1.7-point Democratic swing over the last three presidential elections.
Thriving Suburban Communities – Election Results
Democrats must net 24 seats to win back the U.S. House majority in 2018. Republicans control 14 of the 19 districts in this category. However, Democratic performance has improved in these districts at the presidential level. Democrats need to flip a significant number of these districts if they want a reasonable shot at retaking the majority. But even if they were able to sweep them—which is near impossible—they’d still be 10 seats short of a majority.
Example Districts
New Jersey’s Seventh Congressional District
This northern New Jersey district is represented by Republican Leonard Lance, a five-term incumbent from Clinton Township who has attempted to carve out a moderate reputation in Congress.1 District residents have very high educational attainment, with more than half of adults completing a bachelor’s or professional degree. The voting-age population here is 74.8% non-Hispanic white; this matches the average for Majority Maker districts.
Minnesota’s Third Congressional District
This suburban Minneapolis district is represented by Republican Erik Paulsen, a five-term incumbent from Eden Prairie who has been described as a “chamber of commerce Republican.”2 Educational attainment here is far above average, with nearly half of adults completing a bachelor’s or professional degree. The voting-age population is 82.9% non-Hispanic white. While this is almost 10 points above the average for Majority Maker districts, there are still 22 other top districts that have less racial diversity than here.
Left Behind Areas
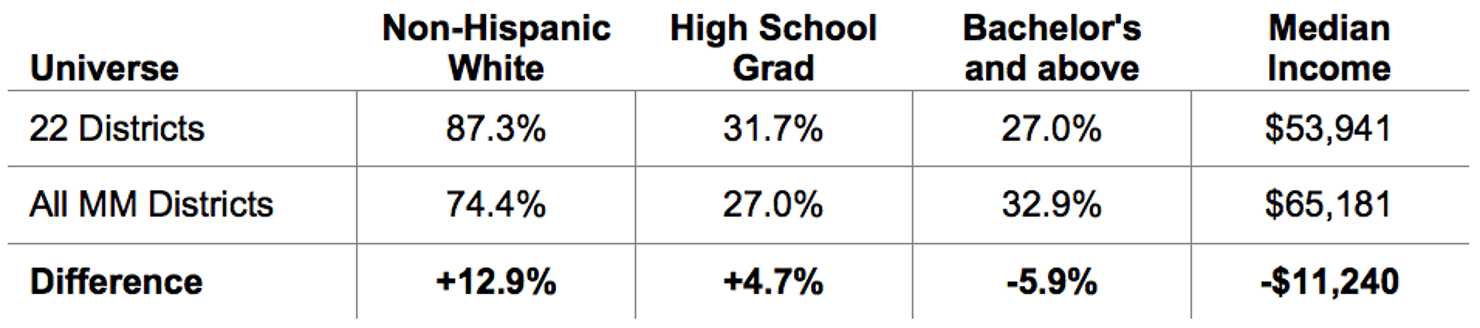
Districts in the Left Behind Areas feel like a world away from the Thriving Suburban Communities. They haven’t experienced the demographic changes or socio-economic gains of urban and suburban areas. They’re overwhelmingly non-Hispanic white, adults have low educational attainment, and the median household income is well below average. Twenty-two districts fall within this category, making it the largest group. Democrats represent 12 of these districts, while Republicans represent 10. The average PVI is R+0.5.
Non-Hispanic whites make up 87.3% of the voting-age population in these districts, which is almost 13 points above average for Majority Maker districts. The percentage of adults with bachelor’s or professional degrees lags by almost six points, while the percentage of those who graduated high school but did not go to college is almost five points higher. The median household income here is around $54,000, or by comparison $28,000 below districts in Thriving Suburban Communities.
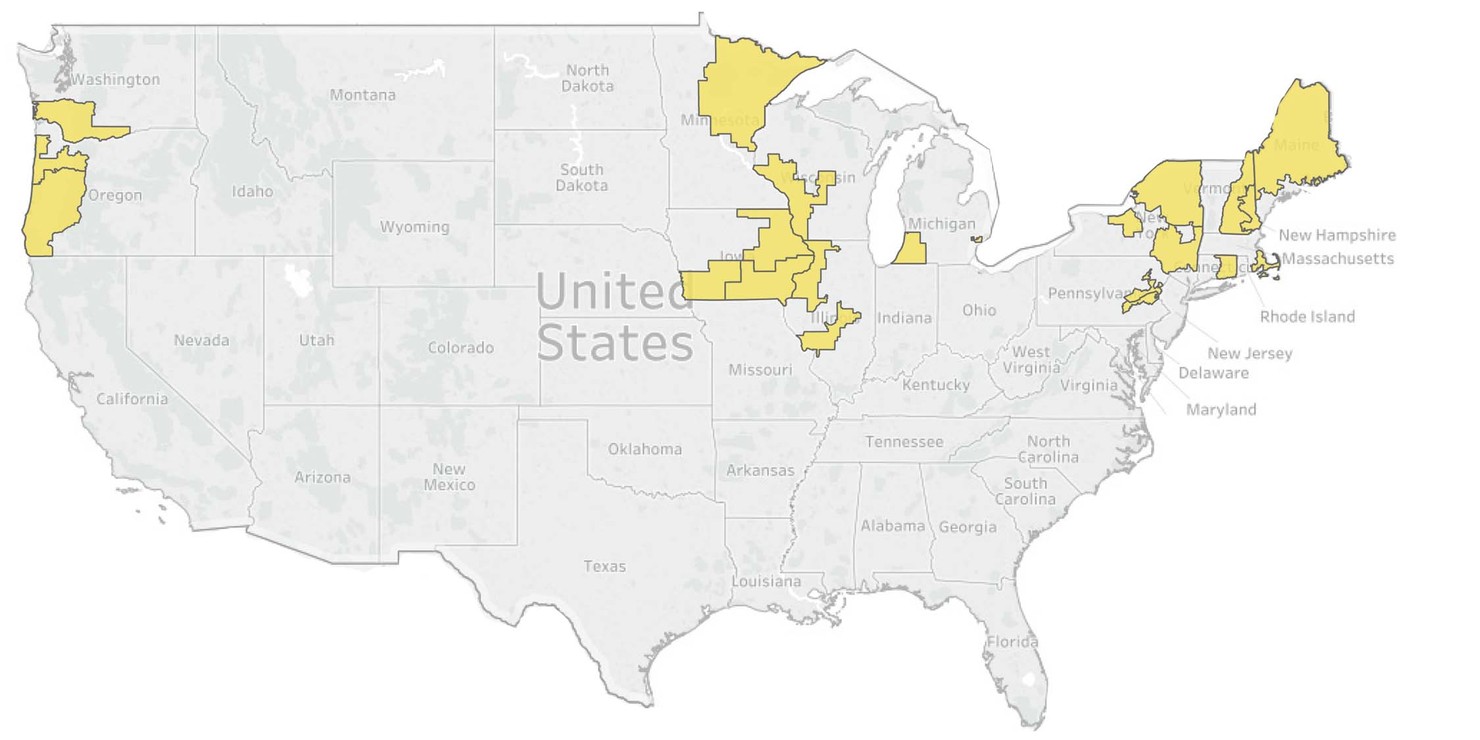
Left Behind Areas – Characteristics
These districts are concentrated in rural or exurban parts of the Northeast, along the northern stretch of the Mississippi River, and in the Pacific Northwest. People in these districts are more likely to have served in the military, while they’re also the oldest group in the framework. Just 85.6% of housing is occupied across these districts, which is three points below average. While incomes are low here, this isn’t fully represented in the surveyed unemployment rate. Under eight percent of adults indicated they’re unemployed, about a point higher than in Thriving Suburban Communities districts.
Left Behind Areas – Districts
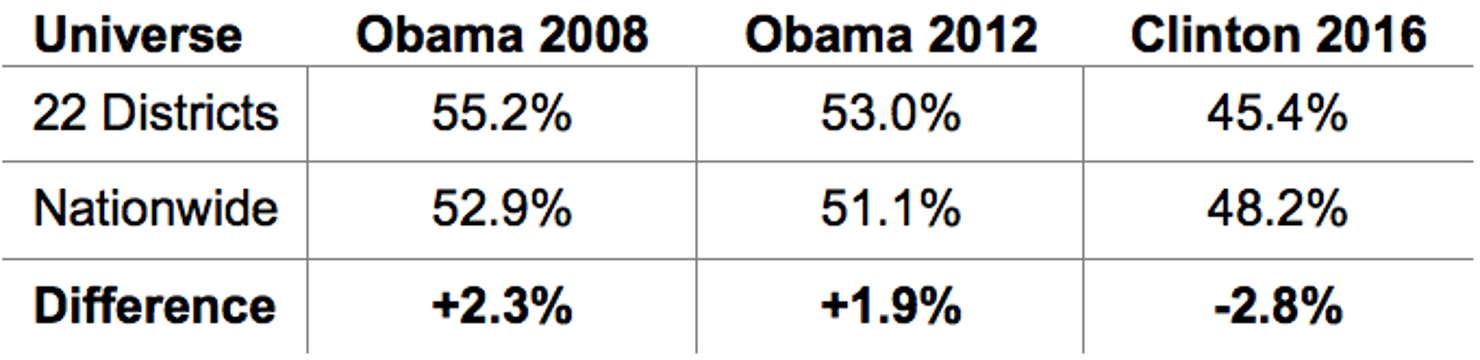
Democratic presidential performance in these districts has fallen off a cliff since 2008. During Obama’s first run, these districts were 2.3 points more Democratic than the country. Jumping ahead to 2016, they underperformed Clinton’s national support by 2.8 points. This 5.1-point Republican swing was the largest change in either direction out of the four categories.
Left Behind Areas – Election Results
While Democrats are on offense in the Thriving Suburban Communities, they’re on defense in some of the districts in the Left Behind Areas. Democrats control 12 of 22 districts in this category, but their support here has plummeted in presidential races since 2008. In their effort to retake the majority, Democrats need to maintain their Democratic incumbents in this category, while also looking for pickup opportunities.
Example Districts
Pennsylvania’s 17th Congressional District
This northeast Pennsylvania district is represented by three-term incumbent Matt Cartwright, a Democrat from Moosic.3 The educational attainment makeup in the district is very working-class; 20.6% of adults have a bachelor’s or professional degree, while 40.8% graduated high school but did not go to college. In terms of racial demographics, this district is 85.9% non-Hispanic white.
Maine’s Second Congressional District
This district, which covers nearly 80% of Maine’s land area, is represented by two-term incumbent Bruce Poliquin, a Republican from Oakland.4 The district is 95.5% non-Hispanic white, which is the second-highest rate of any Congressional district in the country. Twenty-two percent of adults here completed a bachelor’s or professional degree, compared to 37.6% who graduated high school but did not go to college.
Diverse, Fast-Growing Regions
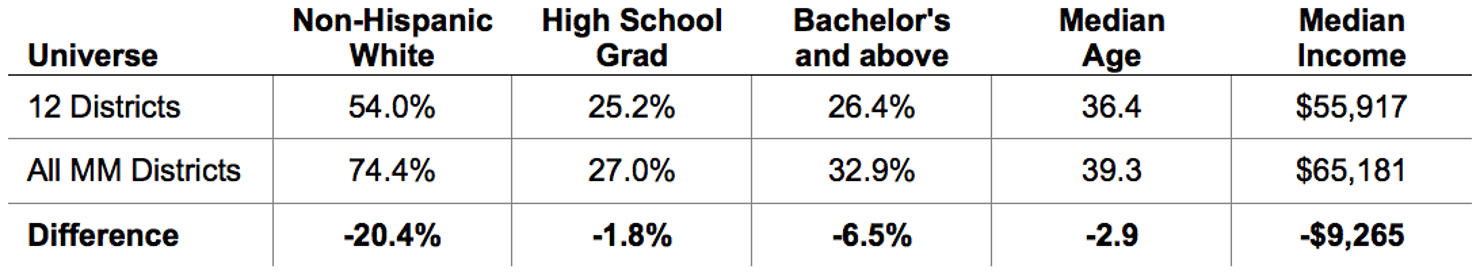
Districts in this category are growing. They’re racially diverse, many residents are foreign-born, the population is young, and people are moving to these areas at high rates. Economically, these communities aren’t thriving yet, and overall educational attainment is low. Twelve districts fall within this category: seven are represented by Democrats, while Republicans represent five. The average PVI is D+0.7.
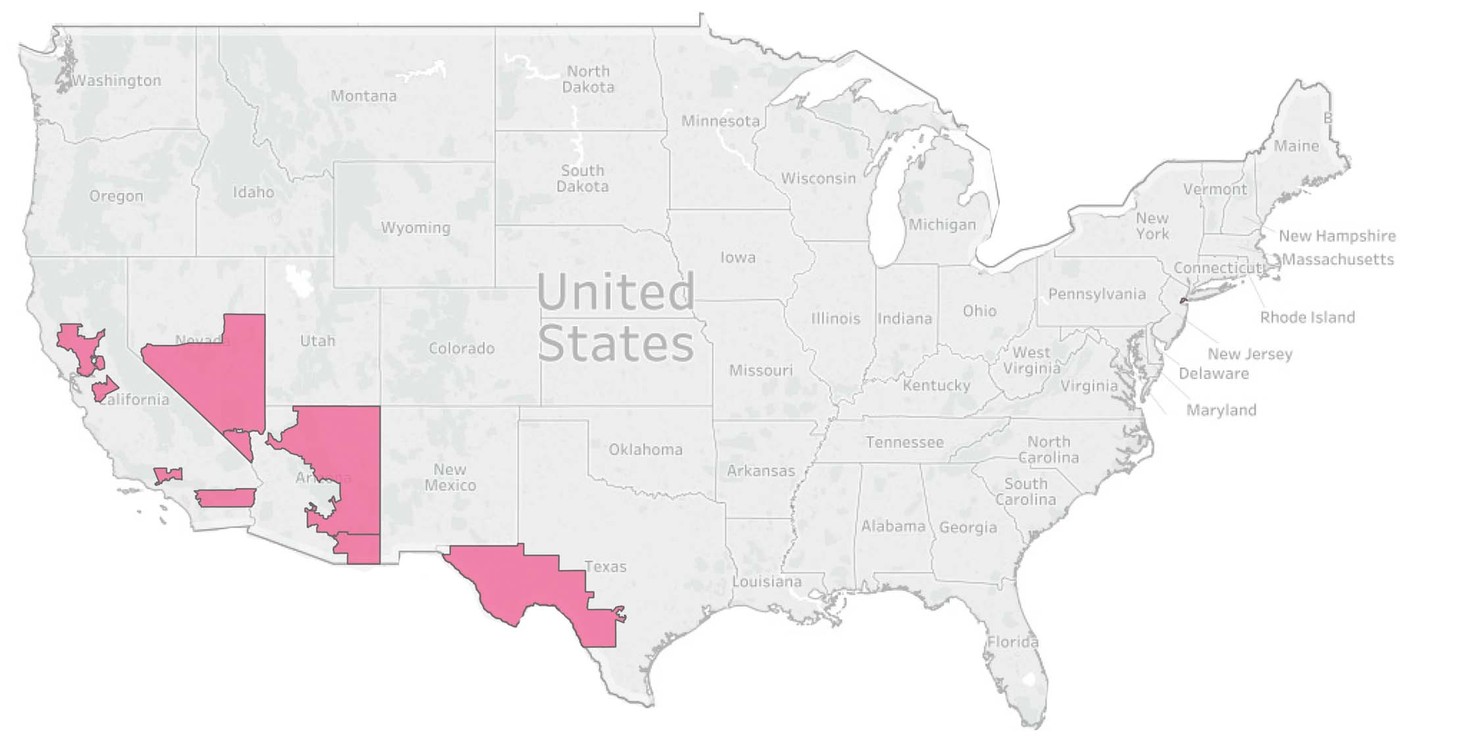
The districts in this category are regionally concentrated in the West and Southwest. The average voting-age population is 54.0% non-Hispanic white, which is almost as low as in blue districts. Relatedly, 17.7% of residents are foreign-born, while one-third speak a language other than English in the home. This is the youngest group in the framework with a median age of 36.4. The median household income across these districts is $55,917, while just 26.4% of adults have a bachelor’s or professional degree. However, there is a sense that this economic hardship is related to the nascent nature of the populations, and as such, may not seem as intractable as in the Left Behind Areas.
Diverse, Fast-Growing Regions – Characteristics
Diverse, Fast-Growing Regions – Districts
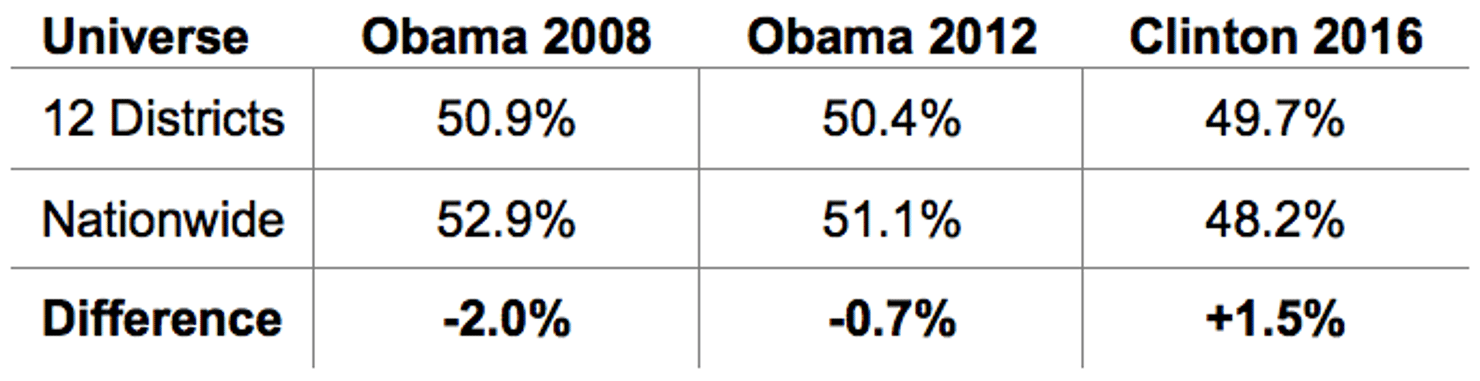
Like the Thriving Suburban Communities, these districts have been moving toward Democrats at the presidential level. In 2008, they were two points less Democratic than the country, but last year they were 1.5 points more Democratic. This makes for a 3.5-point Democratic swing over the last three presidential elections.
Diverse, Fast-Growing Regions – Election Results
For Democrats to net the 24 seats they need to retake the U.S. House majority, they’ll likely need to flip a few of the seats in this category. Democrats currently hold seven of the 12 seats, but some of the Republican incumbents are very vulnerable. In Texas’s 23rd Congressional District, for example, Republican Will Hurd won his re-election bid by just over 3,000 votes in 2016.5
Example Districts
Texas’s 23rd Congressional District
This district, which covers most of southwest Texas, is represented by two-term Republican Will Hurd, who hails from Helotes.6 This is the most racially diverse Majority Maker district; its non-Hispanic white population makes up just 28.0% of the voting-age population. Educational attainment is low here, with 21.1% of adults completing a bachelor’s or professional degree. The median age here is just 32.9.
Nevada’s Third Congressional District
Located south of Las Vegas, this district is represented by Jacky Rosen, a freshman Democrat from Henderson.7 The district’s voting-age population is 61.9% non-Hispanic white. It has marginally higher educational attainment than others in this category, with 31.6% of adults finishing college, while the median household income is $63,360. Still, these figures lag behind the average for all Majority Maker districts.
Non-Conformist Districts
Non-Conformist Districts fall outside of the framework’s categories. There is an inherent incongruity in the district-level characteristics with these districts, and so this category lacks a cogent description. Some districts are racially diverse, but they don’t fit into the Diverse, Fast-Growing Regions category because they also have very high educational attainment and median household incomes. Other districts have high educational attainment, but low income. Notably, all 12 of these districts are represented by Republicans in Congress. The average PVI is R+3.
Non-Conformist Districts – Characteristics
As seen in the map, these districts are scattered around the country, which reinforces this jumbled nature.
Non-Conformist Districts
The Non-Conformist Districts, to the extent that conclusions can be drawn about them as a group, have been moving toward Democrats at the presidential level. Since 2008, they’ve gone from underperforming the national average by four points to an underperformance of 1.6 points. This is a 2.4-point Democratic shift over the last three presidential elections.
Non-Conformist Districts – Election Results
Similar to the Thriving Suburban Communities, Non-Conformist Districts feature several pickup opportunities—since Republicans control all 12 of these seats. If Democrats were able to pull even with this set of districts, meaning they’d flip six seats in 2018, it would get them one-quarter of the way to retaking the U.S. House majority.
Example Districts
California’s 45th Congressional District
This Orange County district is represented by two-term Republican Mimi Walters.8 The key incongruity that puts this district outside of the coherent categories is that it’s racially diverse and it also has very high educational attainment and income. Non-Hispanic whites make up just 55.7% of the district’s voting-age population, while 52.2% of adults have a bachelor’s or professional degree and the median household income is $92,378.
New York’s Second Congressional District
Located on the south shore of Long Island, this district is represented by thirteen-term Republican Peter King.9 The incongruity in this district is between educational attainment and income, two characteristics that are typically highly correlated. Overall, educational attainment is low for a Majority Maker district, with 28.6% of adults completing a bachelor’s or professional degree. At the same time, the median household income here is $88,543, which is well above average.
Moving Ahead
The intent of this first look was to outline a more useful framework for understanding key Majority Maker U.S. House districts. Given this information and new analytical outlook, what can be learned about Democrats’ path to a majority in 2018? It’s clear that Democrats need a broad path if they’re going to flip the 24 seats they need to seize the majority. They have the most to gain in the Thriving Suburban Communities and Non-Conformist Districts. In these categories, Republicans control 26 of 31 seats. If Democrats could reach rough parity in these categories, the number of seats they’d need would drop from 24 to 14. In the other two categories, Left Behind Areas and Diverse, Fast-Growing Regions, Democrats control 19 of 34 seats. They have fewer pickup opportunities, but it’s just as important that they hold onto the seats they already control here. Finally, there are at least five districts outside of the PVI range used in this analysis that could be competitive in 2018. Please see the methodology section at the end for more.
The bottom line is no single category is sufficient to get Democrats to the magic number of 24 seats. They need a broad path. They need to flip suburban districts that are trending their direction. At the same time, they need to make gains with rural and Rust Belt voters and also beat a handful of Sun Belt Republicans in districts ranging from California to Texas. On top of all this, Democrats will likely need to win a seat or two that’s not on anyone’s radar—yet. But it is clear that there is no one kind of voter or district that can deliver the majority to Democrats in 2018.
Methodology
Please use this attached link to download the full data set of 65 Majority Maker districts with Census characteristics.
We identified this list of Majority Maker districts using Cook Political Report’s Partisan Voter Index (PVI) data. Cook’s PVI scores use results from the last two presidential elections to measure the partisan nature of each Congressional district. Specifically, the set of districts consists of those with PVI scores that fall within the D+5 to R+5 range. Generally speaking, these are potentially competitive districts that could foreseeably change hands. There are two exclusions that should be noted on the set of districts in this analysis. One, districts from Florida, North Carolina, and Virginia were omitted. These states recently underwent mid-decade redistricting, and the Census Bureau does not yet have 5-year American Community Survey data for new district lines in these states. Second, there are five districts that fall outside of the D+5–R+5 range that may be highly competitive: CA-21; FL-27; FL-26; MN-01; and, MN-07. The California and Florida districts are represented by Republicans and have PVI scores greater than D+5, while the Minnesota districts are represented by Democrats and have PVI scores greater than R+5.
The grouping of the Majority Maker districts into distinct categories was done through an analysis of 48 Census characteristics. Each district was analyzed using several buckets of characteristics—core demographics, workforce, housing, and educational data, as well as socio-economic factors—to ascertain the key factors distinguishing and linking the districts. Ultimately, standard deviation calculations were done for all characteristics, to determine which characteristics had the broadest dispersion in values. This led us to find that educational attainment and voting-age population by race had the largest standard deviation values, and these characteristics serve as the backbone of our four categories. That said, no single characteristic should be the sole basis for analyzing electoral geographies of any size, so additional factors are integrated throughout the analysis.
Using this methodology, our research yielded four unique categories for Majority Maker districts: Thriving Suburban Communities; Left Behind Areas; Diverse, Fast-Growing Regions; and, Non-Conformist Districts that don’t fit into the categories.
In addition to analyzing characteristics, the recent partisan trajectory for each category is evaluated. This is done by tracking Democratic presidential results in these categories from 2008 through 2016, and comparing the category-level average against national Democratic performance from the same elections.