Report Published April 26, 2016 · Updated April 26, 2016 · 9 minute read
Night and Day: Post-NAFTA Trade Deals Yield Steady Surpluses
Jim Kessler & Jay Chittooran
The North American Free Trade Agreement (NAFTA) has dominated the trade debate, but it was implemented 22 years ago. Since then, the United States has signed free trade agreement (FTA) with 17 other countries.
In a previous report, we examined whether these 17 modern trade deals are beneficial. Now, a year later and with more data, we are updating this report.
In this paper, we focused again on how modern trade deals have affected the blue-collar goods sector, as the trade discussion has centered on its effect on U.S. manufacturing. For each of these 17 countries, we compared the U.S. trade balance in goods with each country over two different periods of time: the three years immediately preceding the agreement and the latest three years of available data (2013 through 2015, all post-agreement). The reason for these periods is two-fold: we now have at least three years of trade data for every post-NAFTA deal, and three-year periods show a deeper picture than a single year which could skew for various reasons.
We found that:
- Our trade balance in goods improved in 14 of the 17 countries post trade deal.
- Post FTAs, our balance of trade in goods in these 17 countries totaled an $85.5 billion surplus, compared to a $3.7 billion deficit pre FTA, an improvement of nearly $90 billion.
- U.S. goods exports to these 17 countries grew twice as fast as imports, increasing by 42% versus 21%.
- The United States previously had trade deficits with nine countries pre FTA implementation. Now, the United States has deficits with only three.
- U.S. trade balances from these modern FTAs remain positive despite a strong dollar.
The trade debate is stuck in the 1990s. Modern deals and old NAFTA-style deals are as different as night and day. And so are the results.
Introduction
You wouldn’t buy a 1994 car, but our trade debate is stuck on a 1994 trade deal. Since the implementation of the NAFTA in 1994, the United States has concluded trade deals with 17 countries. Just as the quality of automobiles or computers has vastly improved since 1994, so have our trade deals. Modern deals, all concluded post 2000, have improved as a result of the lessons we learned from NAFTA. These new deals have strong labor standards that benefit U.S. workers, while NAFTA did not. These new deals have environmental protections in the agreements, while NAFTA did not. Enforcement measures have been strengthened as has access to foreign markets. We’ve come a very long way since NAFTA.
By 2030, the world economy is expected to grow by roughly $60 trillion, with almost 90% of that growth occurring outside the United States.1 Meanwhile, the United States derives a smaller share of its GDP from exports than 38 of 40 of the largest world economies.2 There is not path to middle-class prosperity without increasing exports.
The Trans-Pacific Partnership (TPP), the largest trade deal in history, will soon be before Congress. Policymakers will rightly be asking: How does this deal help America, and how does it help the middle class? There will be attempts to compare it to NAFTA, but TPP is a far cry from NAFTA. The labor, environmental, and human rights provisions are considered the strongest ever. Tariffs are reduced on over 18,000 goods. And for the first time in any trade deal, there are standards for the internet economy, protections against state-owned enterprises, and rules to stop currency manipulation. TPP is, in fact, much stronger than any modern trade deal, and those modern deals—as we show below—are already delivering.
The Findings
Using public data from the U.S. Census Bureau, we found that post-NAFTA trade deals have improved our goods trade balance in most countries. In the aggregate, the gains have been substantial.
For deals with each of these 17 countries, we compared our trade balance in American goods with each country over two different periods of time: the three years immediately preceding the agreement and then the latest three years of available data (2013 through 2015, all post-agreement). The reason for these periods is two-fold: we now have at least three years of trade data for every post-NAFTA deal, and three-year periods show a deeper picture than a single year, which could skew the results. This means that for the 17 countries, we looked at 102 country-years of data. What we found was remarkable:
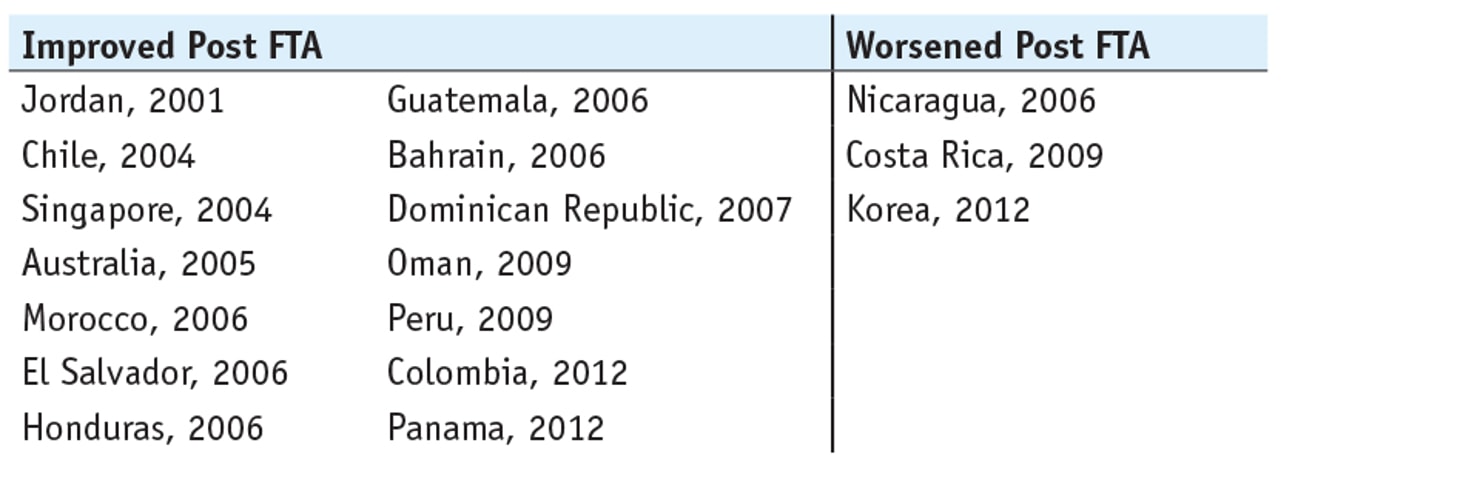
Finding #1: Our trade balance in goods improved in 14 of the 17 countries post trade deal.
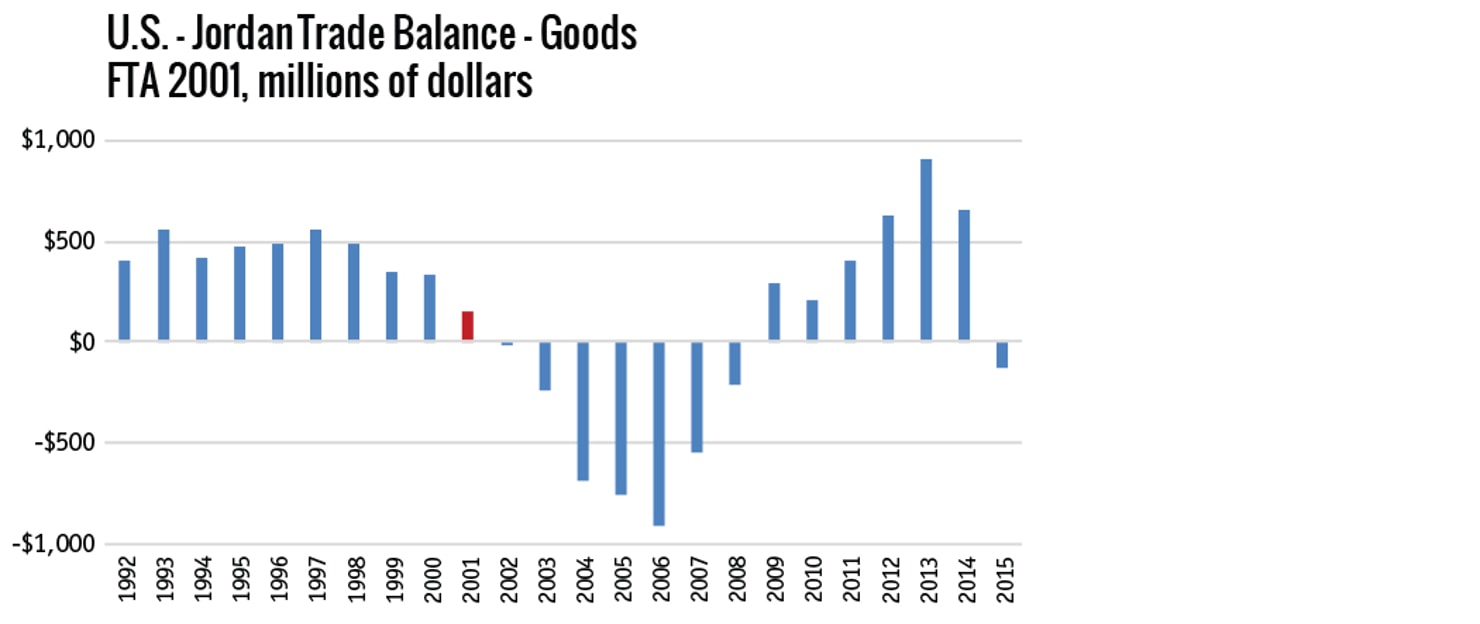
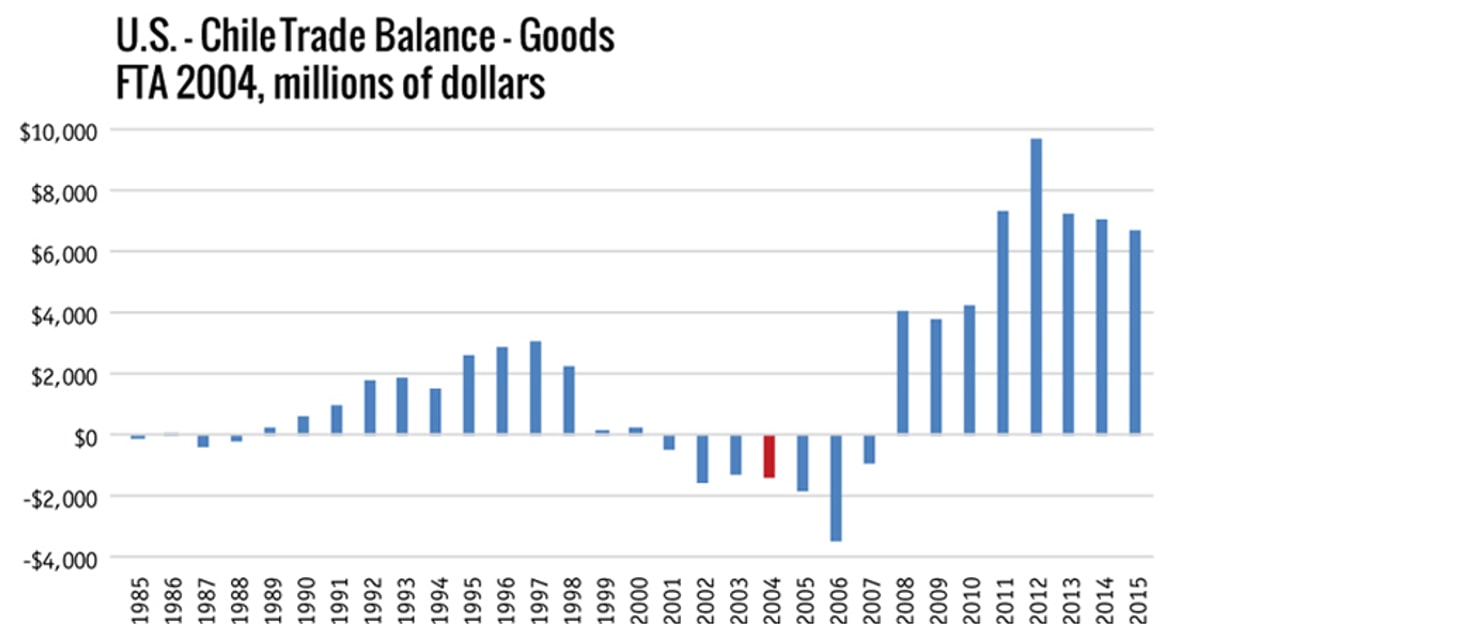
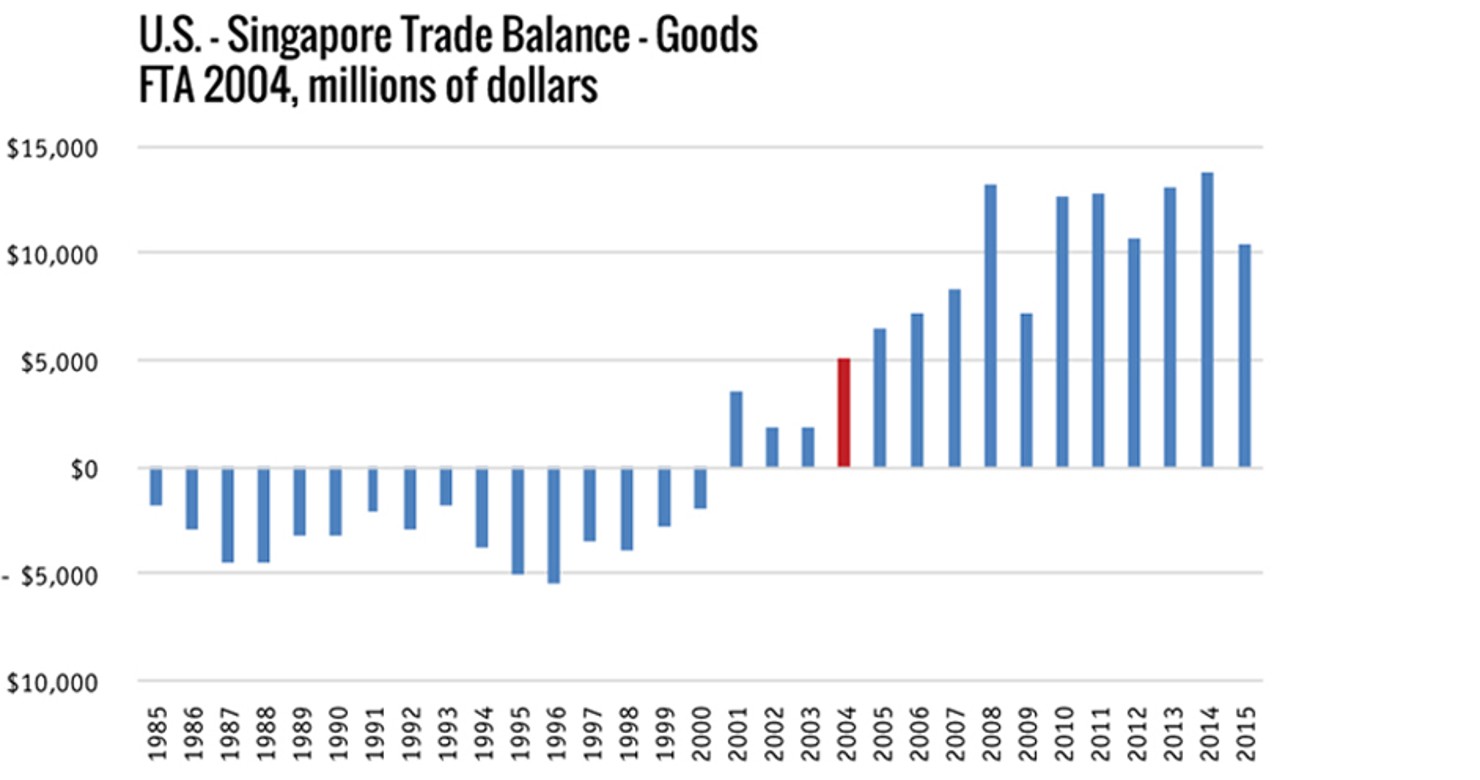
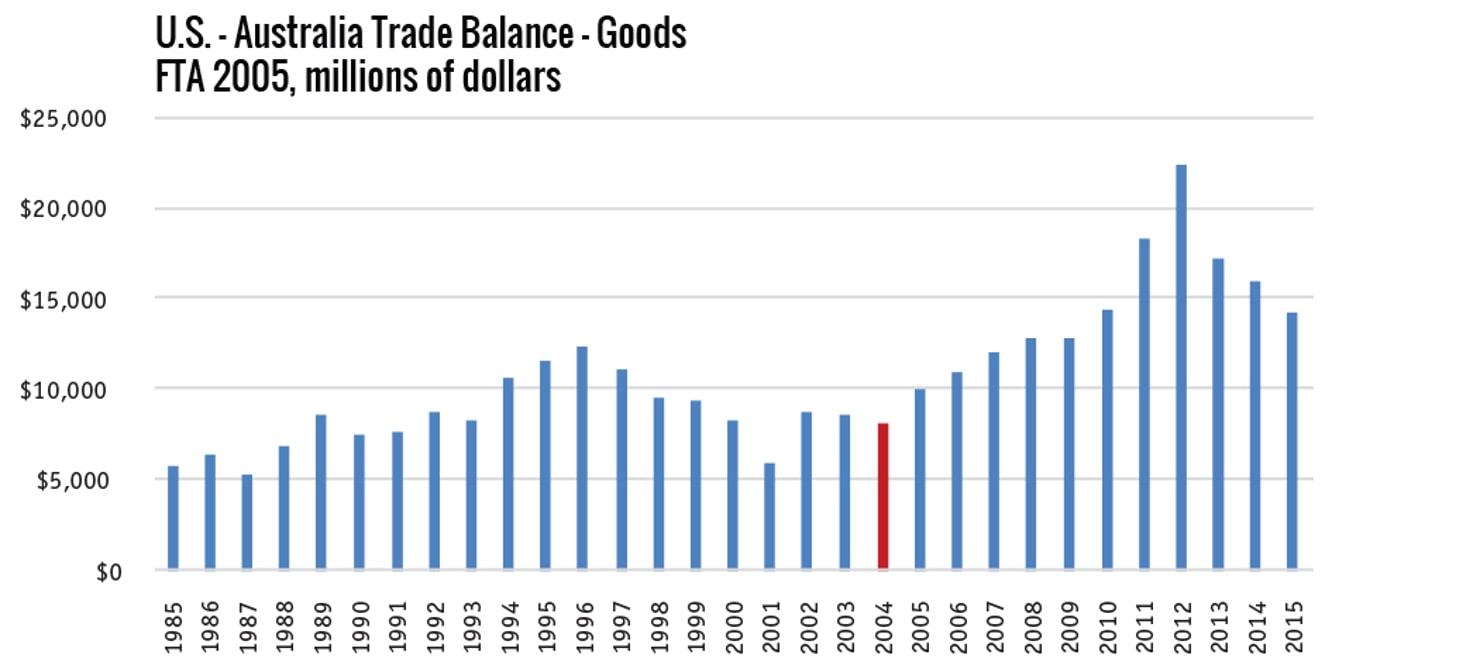
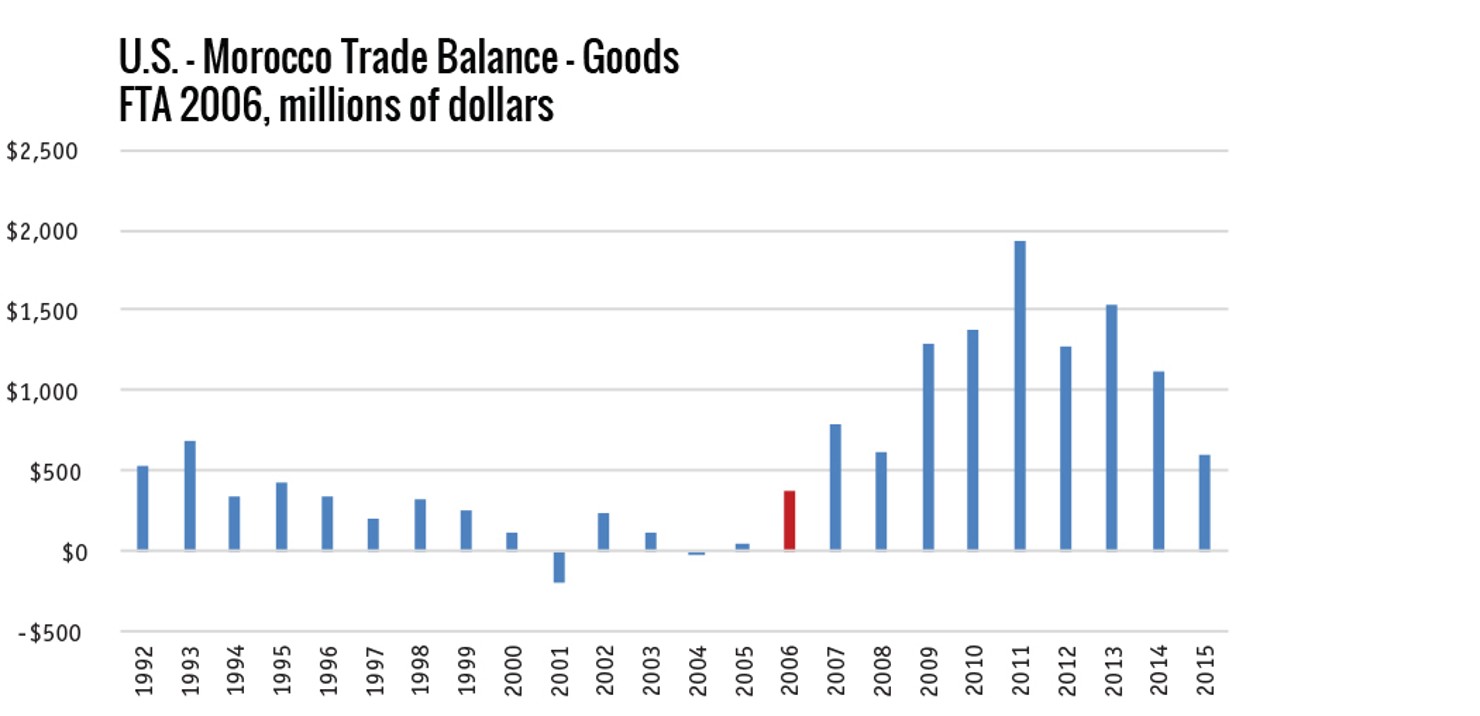
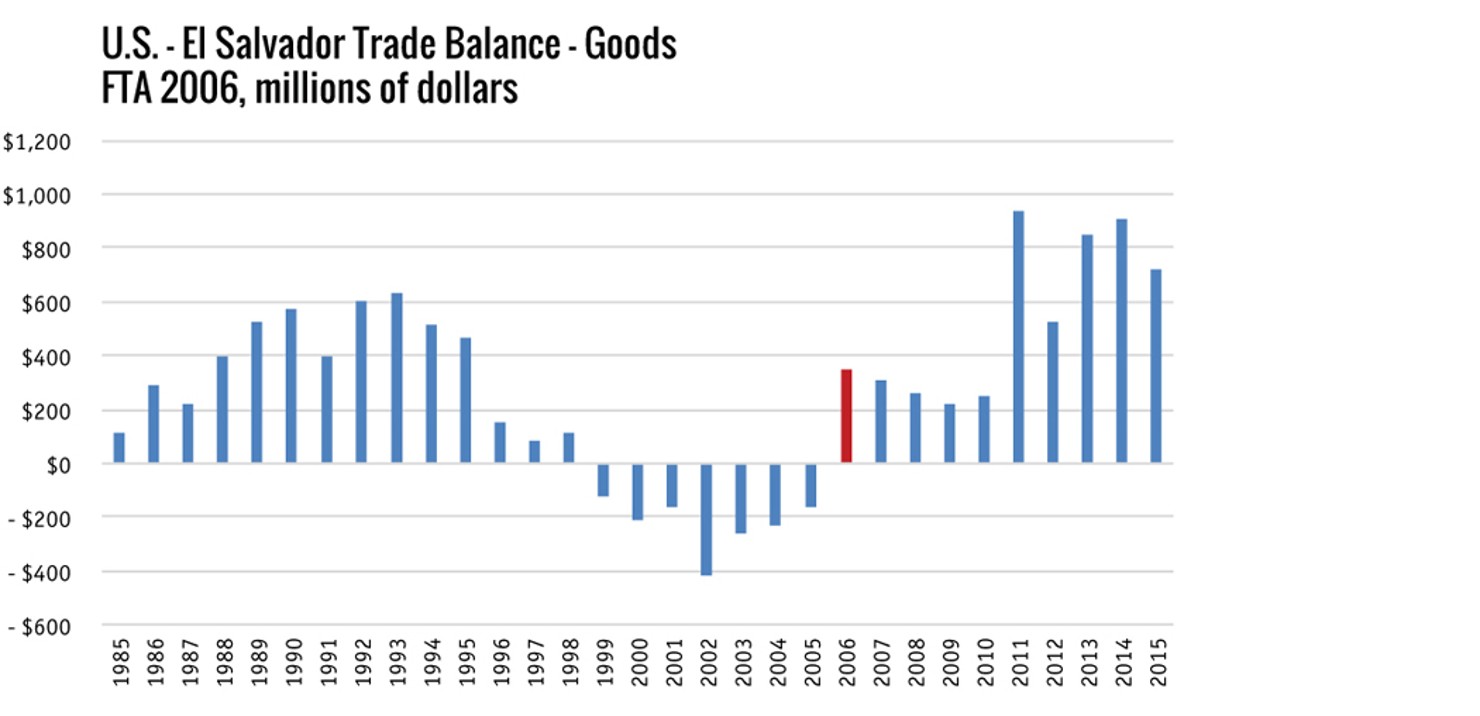
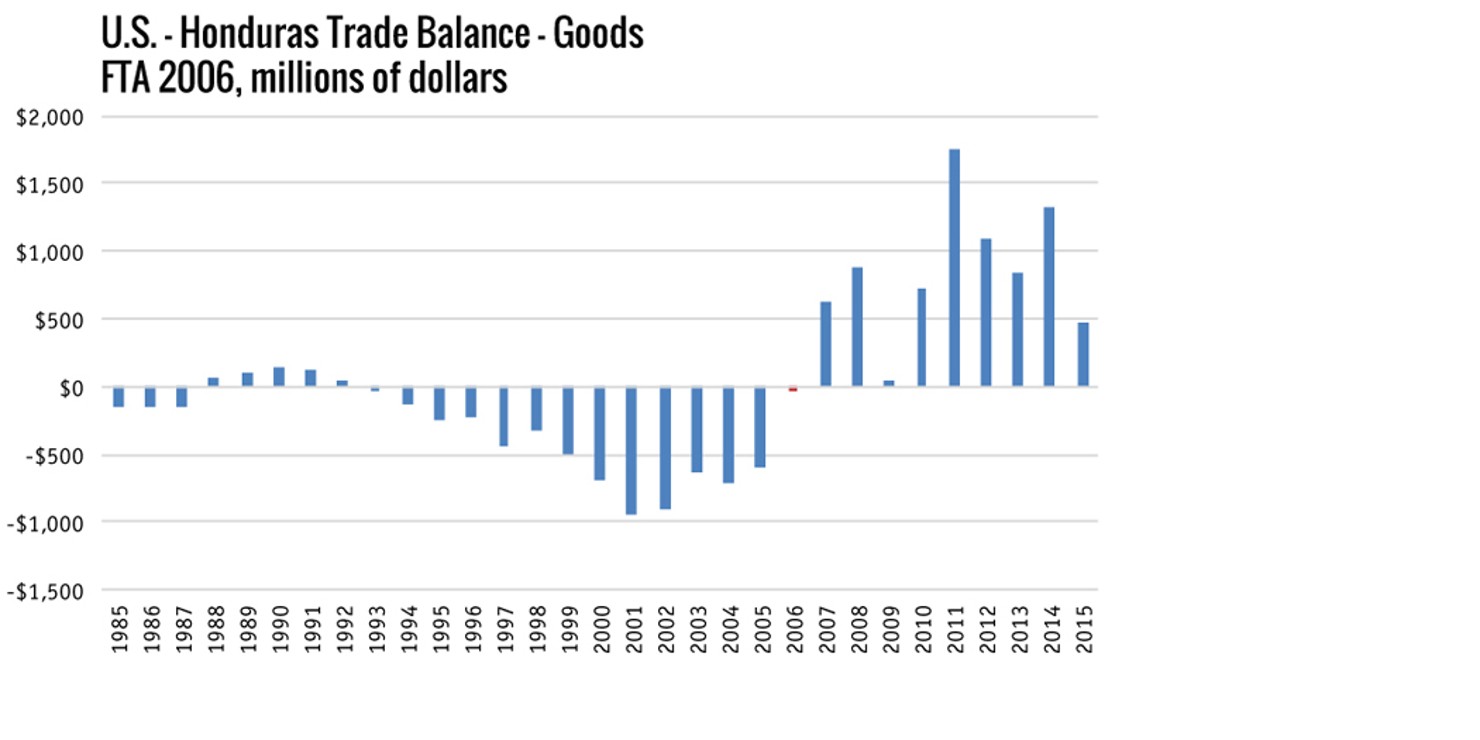
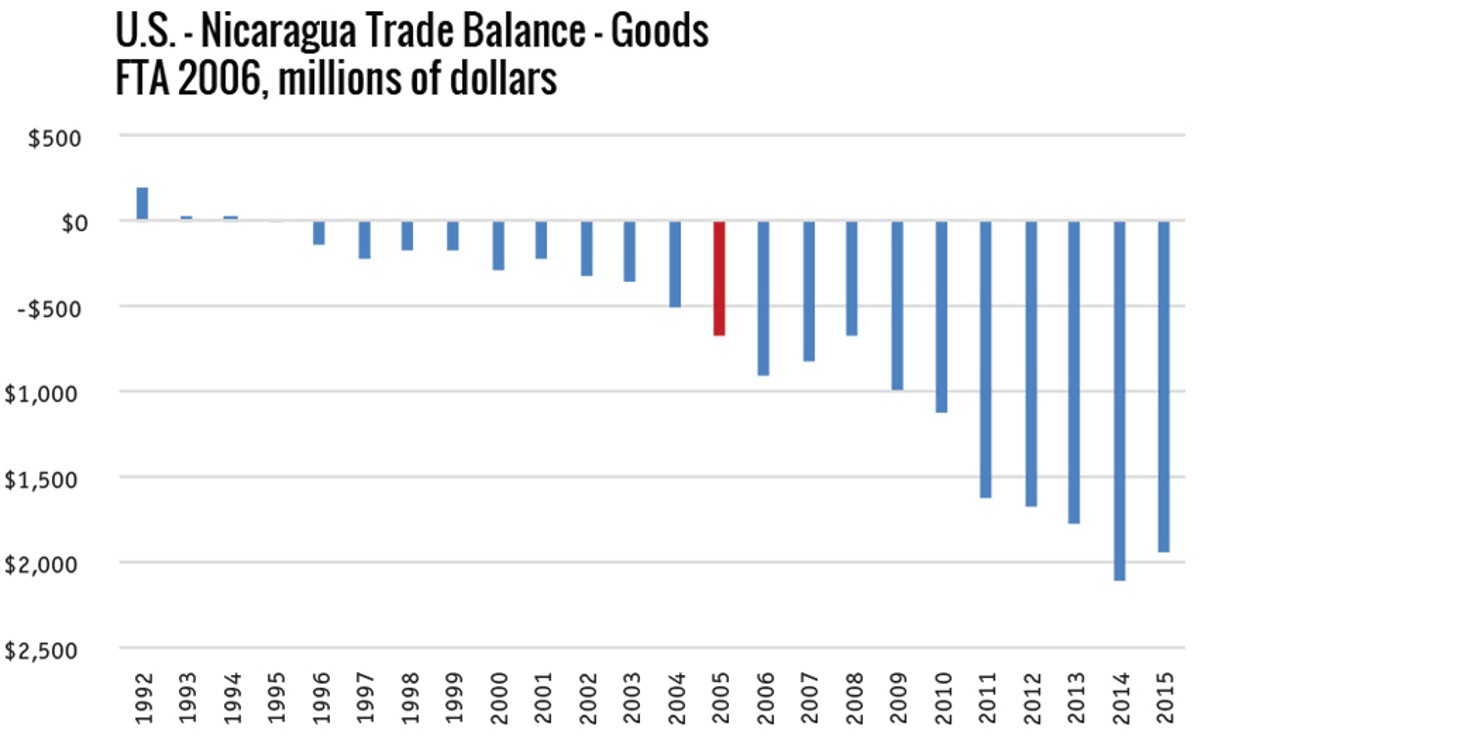
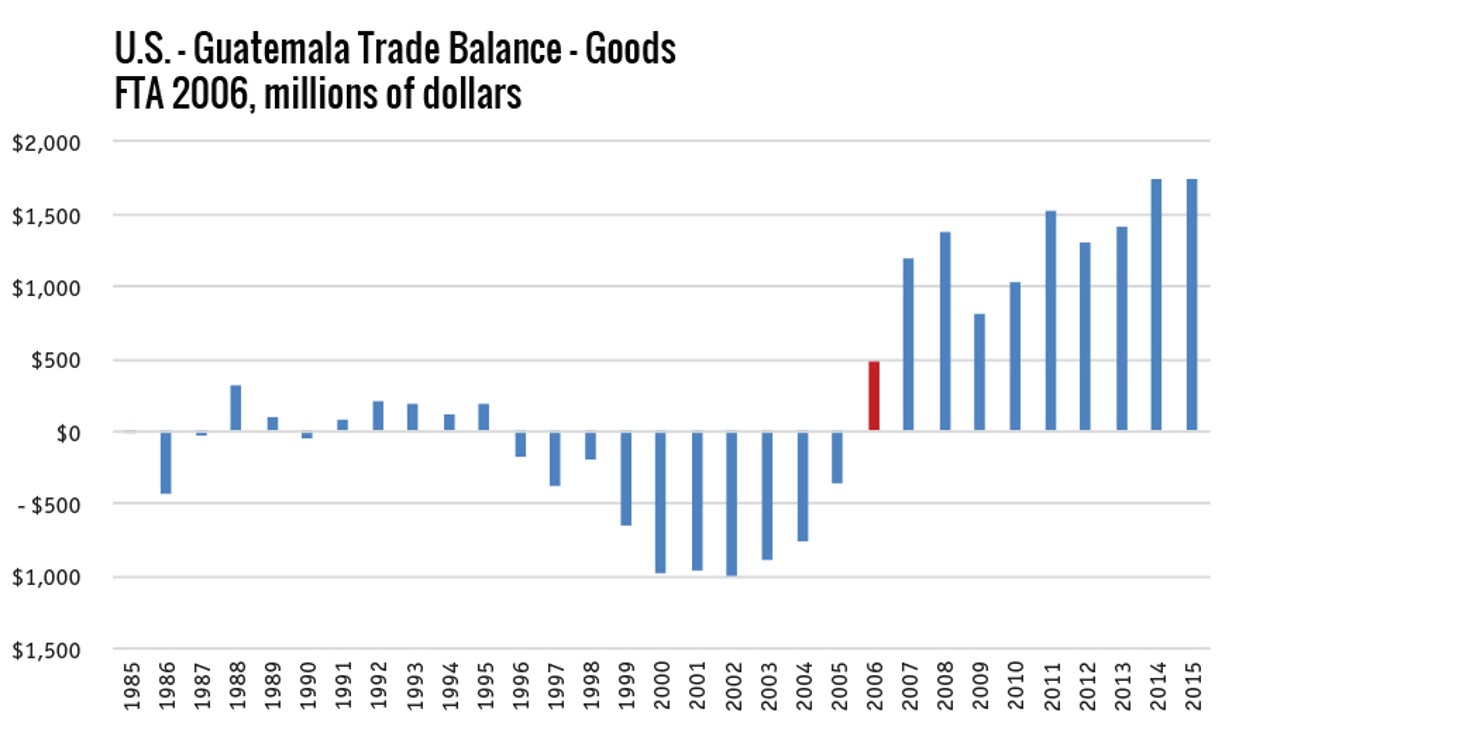
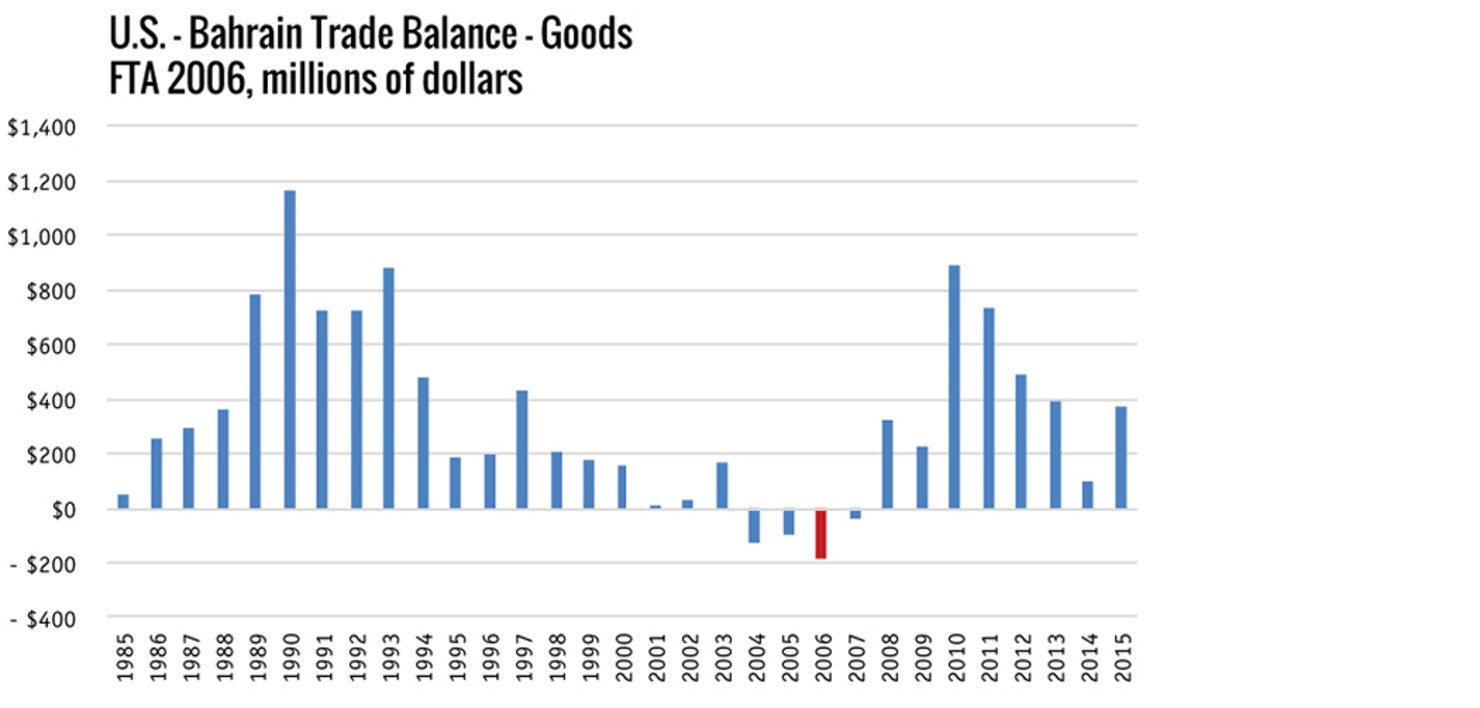
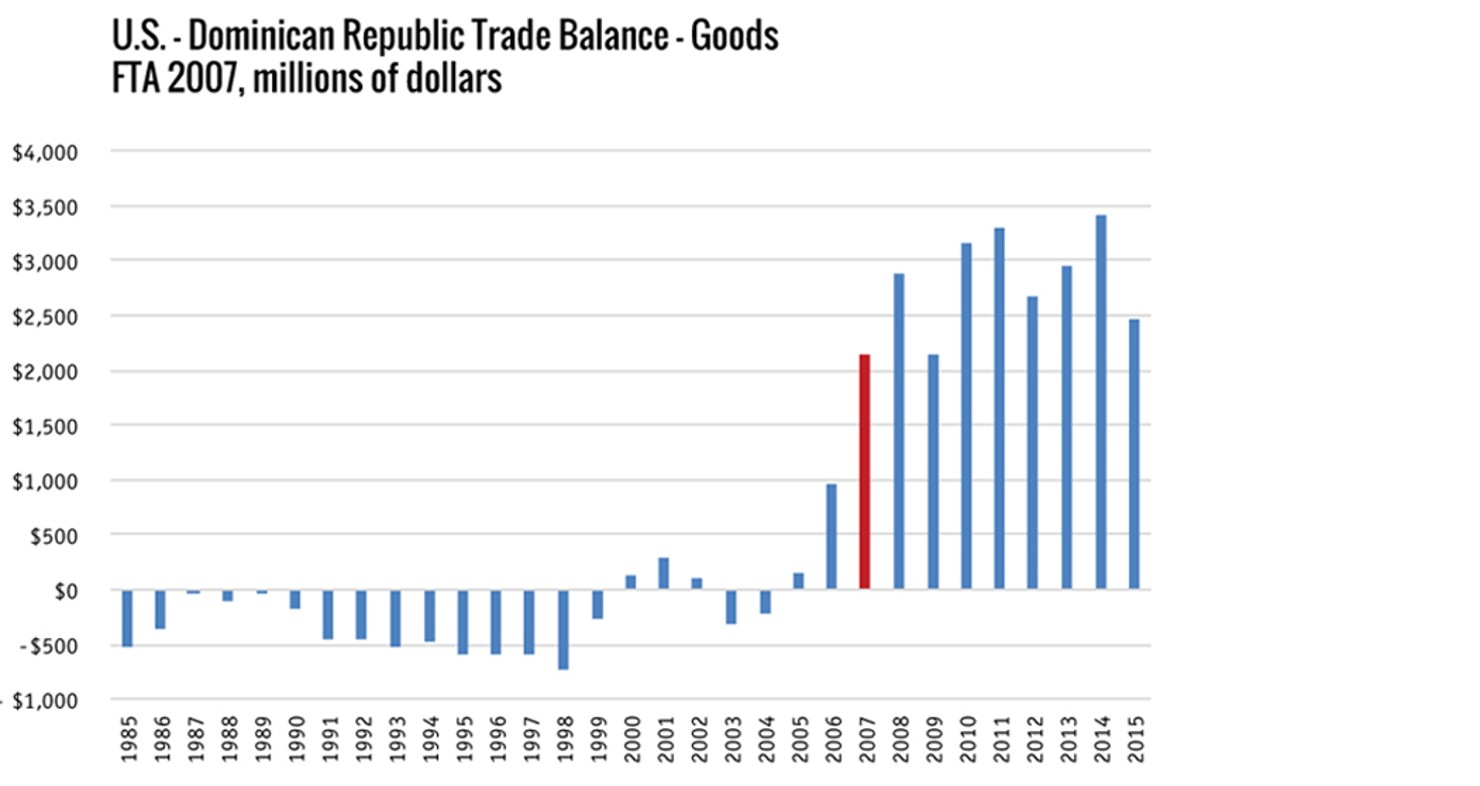
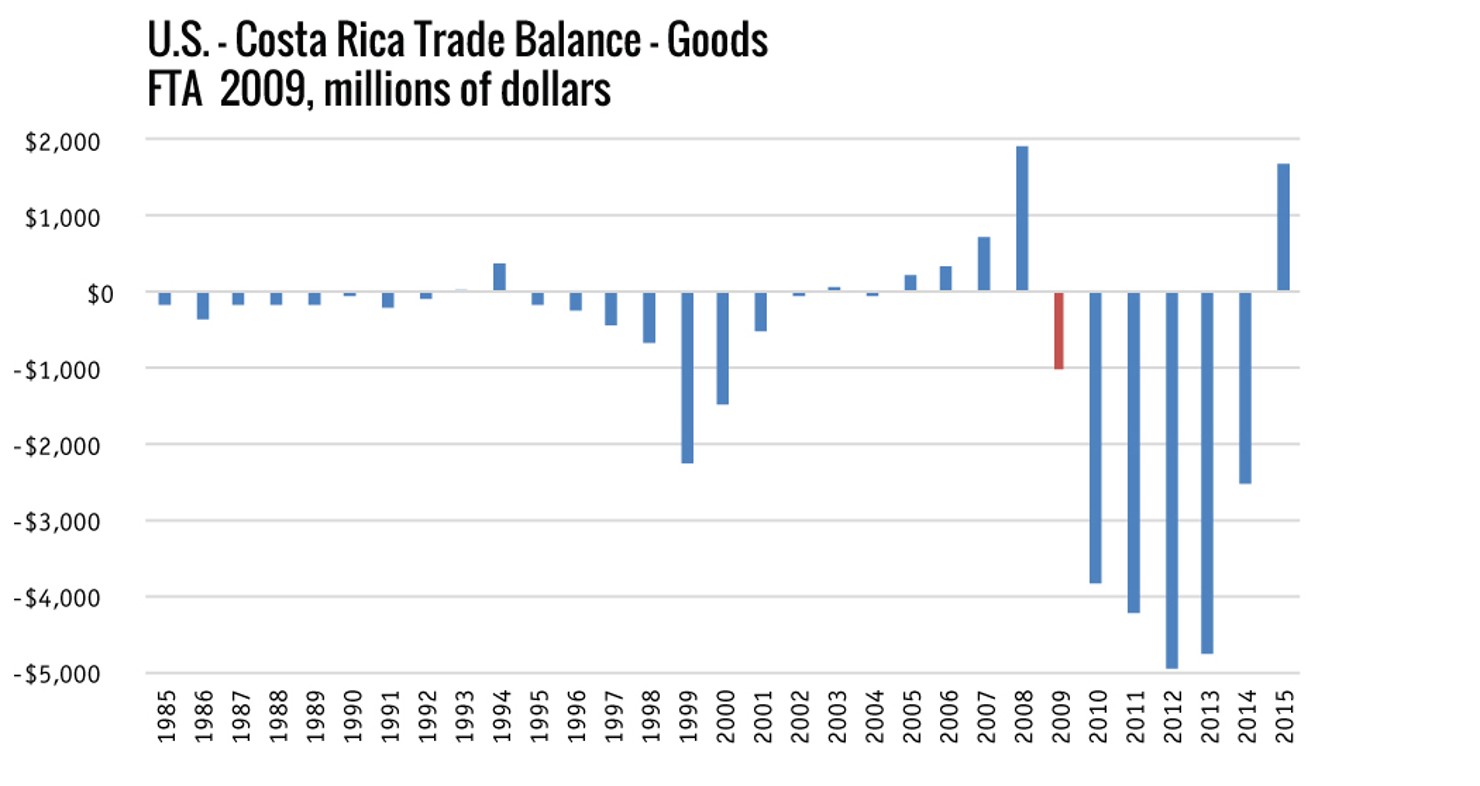
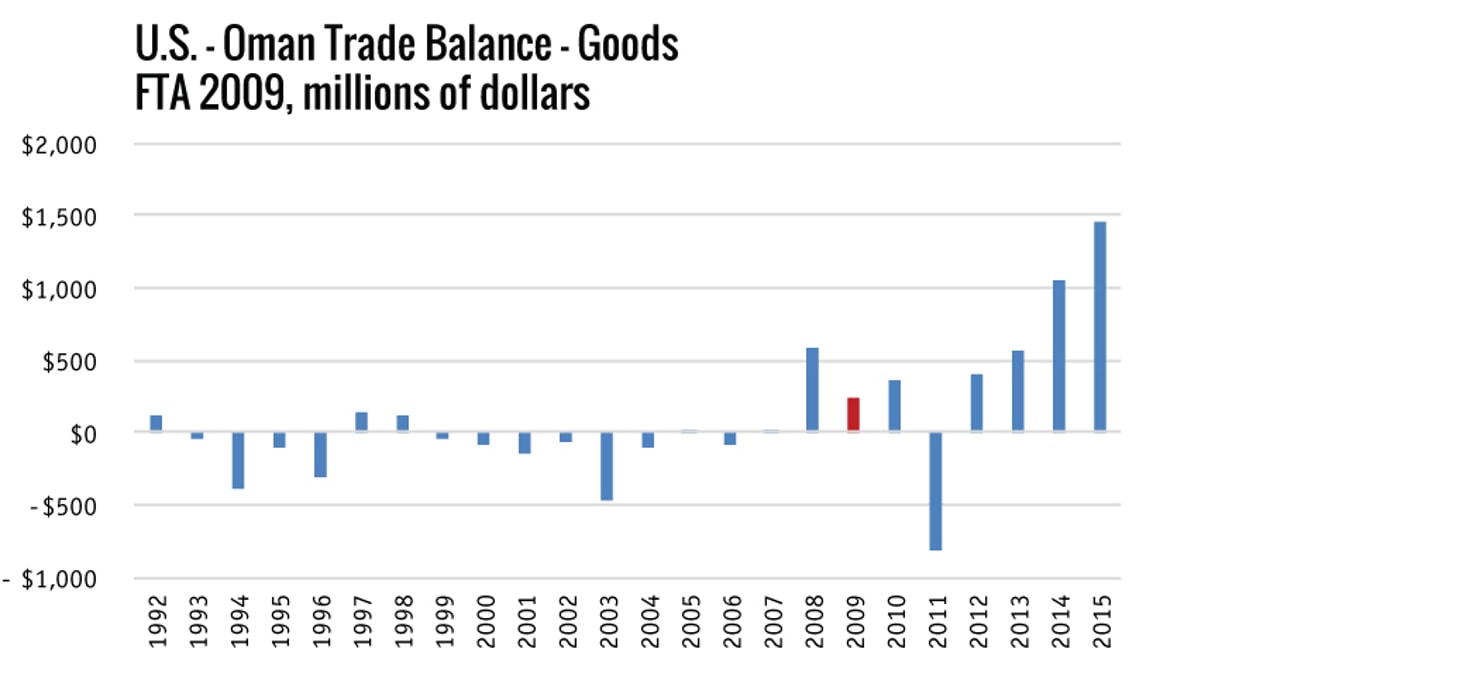
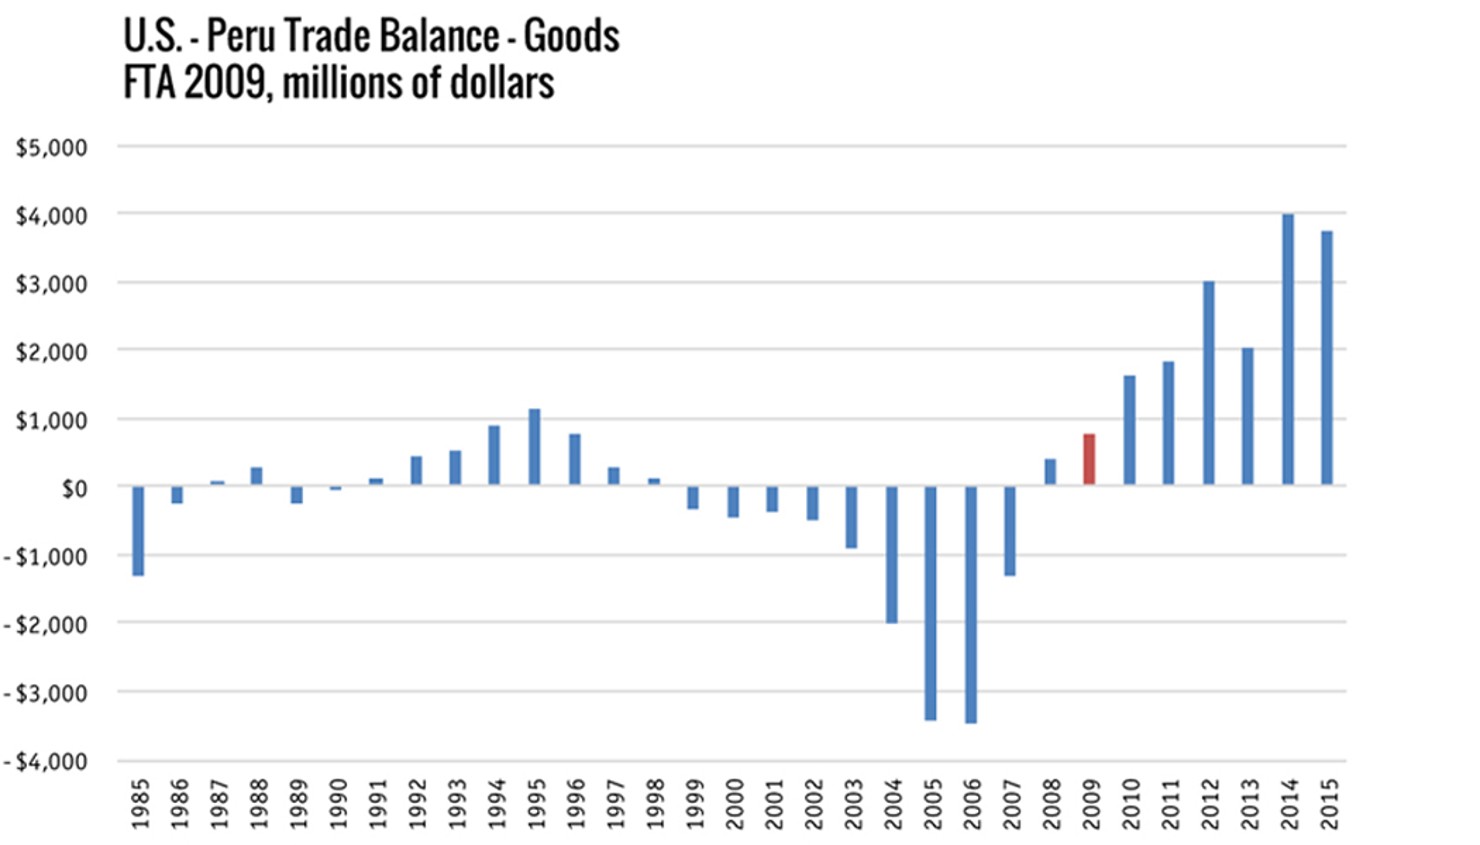
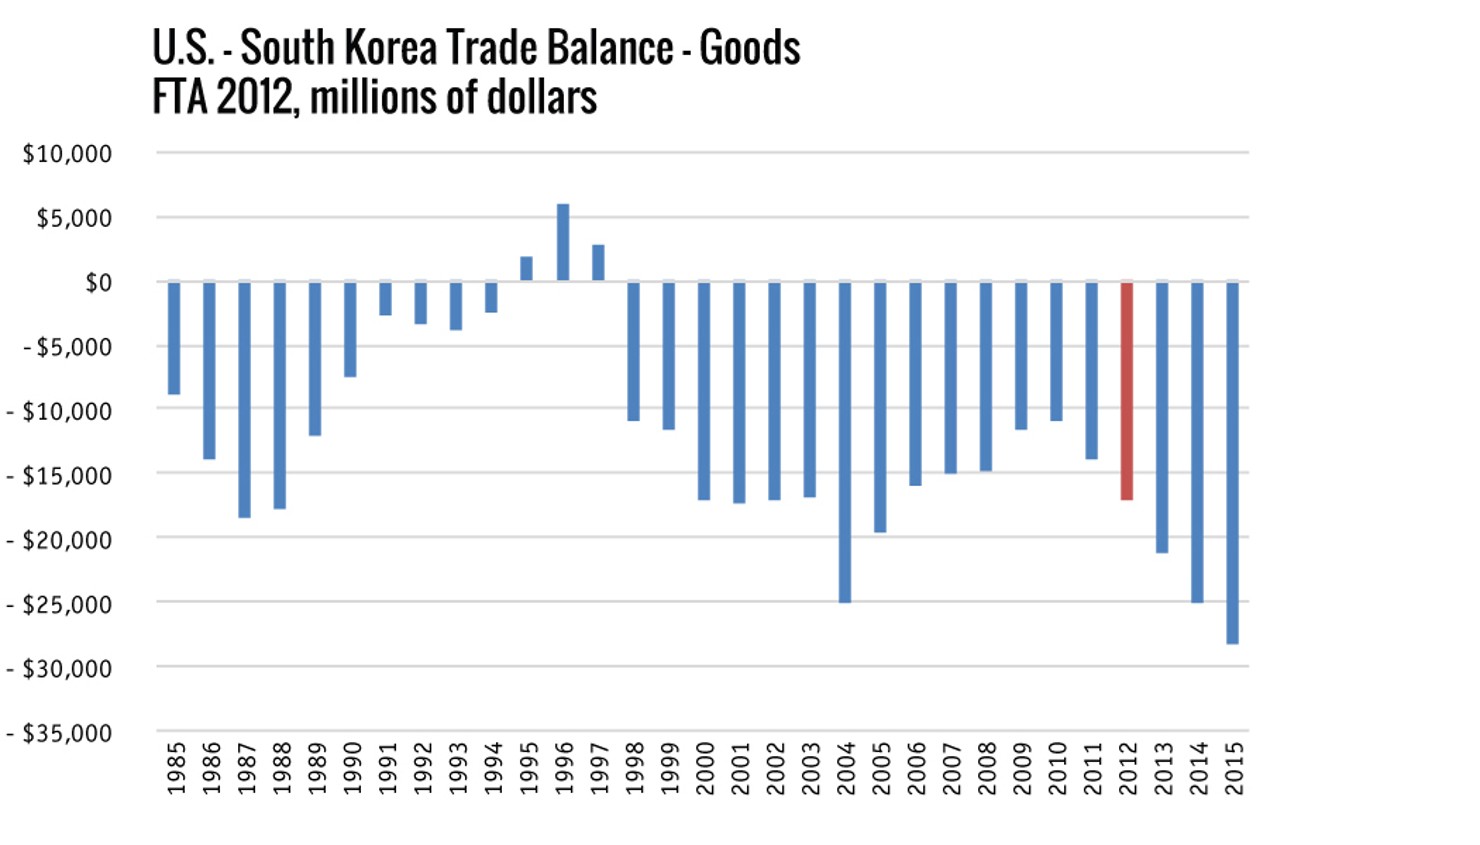
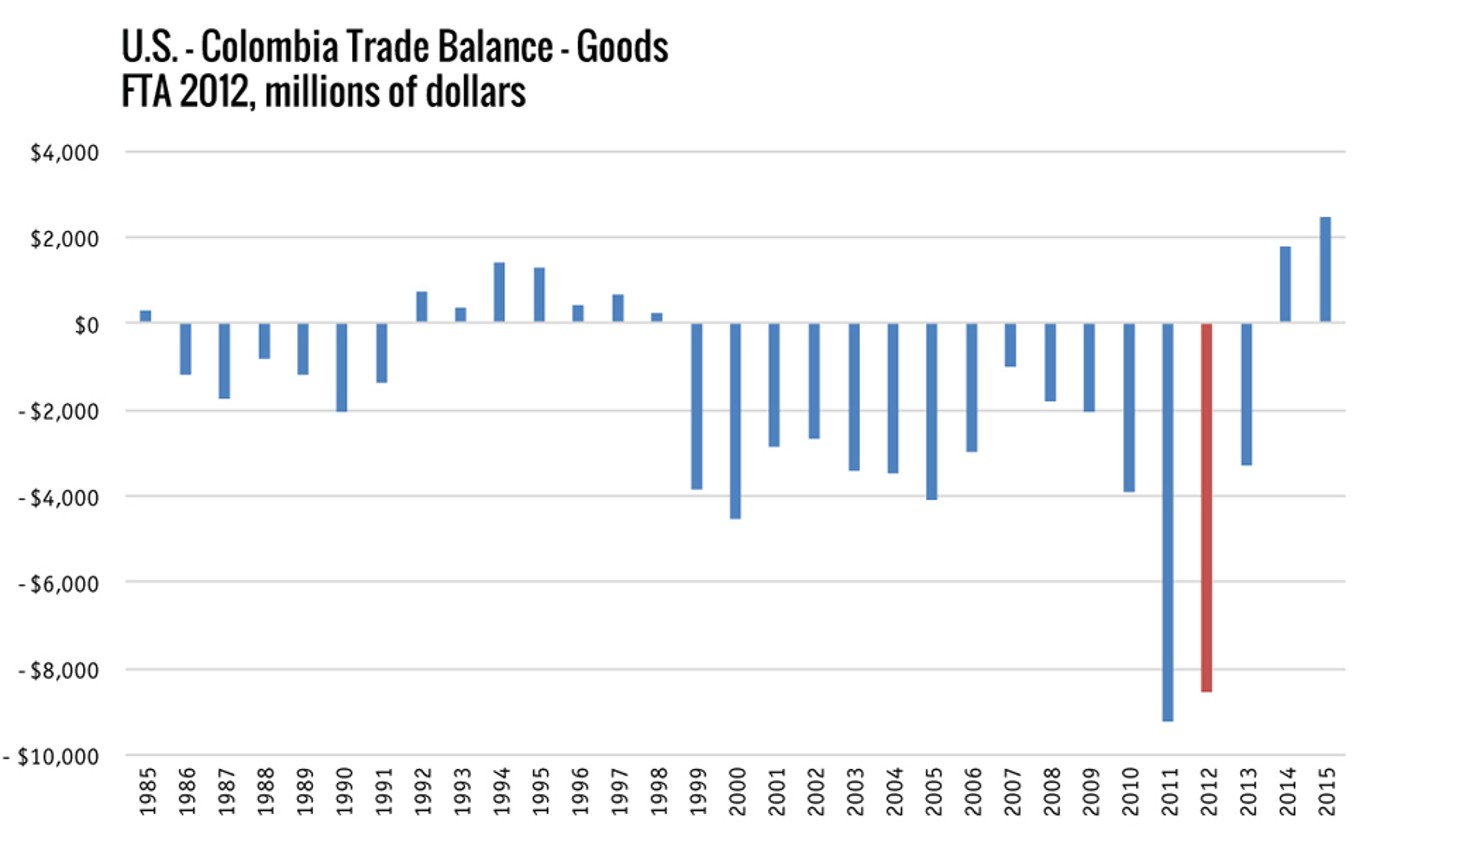
We looked at the trade balance post FTA for each of the countries with whom we have a trade deal since 2000. As depicted in Figure 1, below, following the FTA, trade balances in goods improved for the United States with 14 countries: Jordan, Chile, Singapore, Australia, Morocco, El Salvador, Honduras, Guatemala, Bahrain, Dominican Republic, Oman, Peru, Colombia, and Panama. Trade balances worsened with Nicaragua, Costa Rica, and Korea.
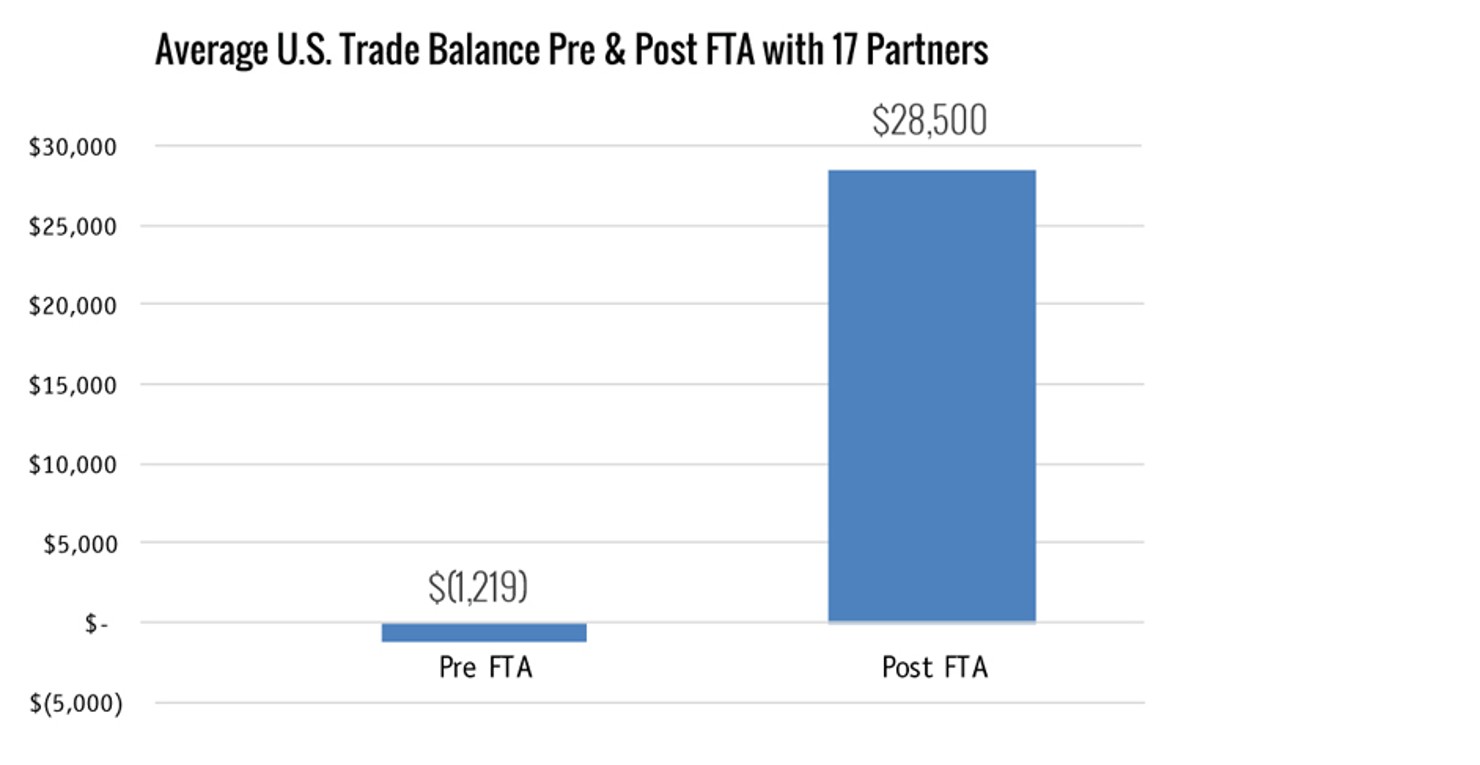
Finding #2: Post FTAs, our trade balance in goods in these 17 countries totaled an $85.5 billion surplus, compared to a $3.7 billion deficit before the FTA, an improvement of nearly $90 billion.
Over the two periods of time, the trade balance in goods improved the most in Singapore ($30.1 billion) and fared the worst with South Korea (-$38.0 billion). Overall, the goods trade balance improved in the following (all in 2015 dollars):
- Singapore ($30.1 billion)
- Chile ($24.3 billion)
- Australia ($21.9 billion)
- Colombia ($16.2 billion)
- Peru ($14.1 billion)
- Guatemala ($6.9 billion)
- Dominican Republic ($7.9 billion)
- Honduras ($4.6 billion)
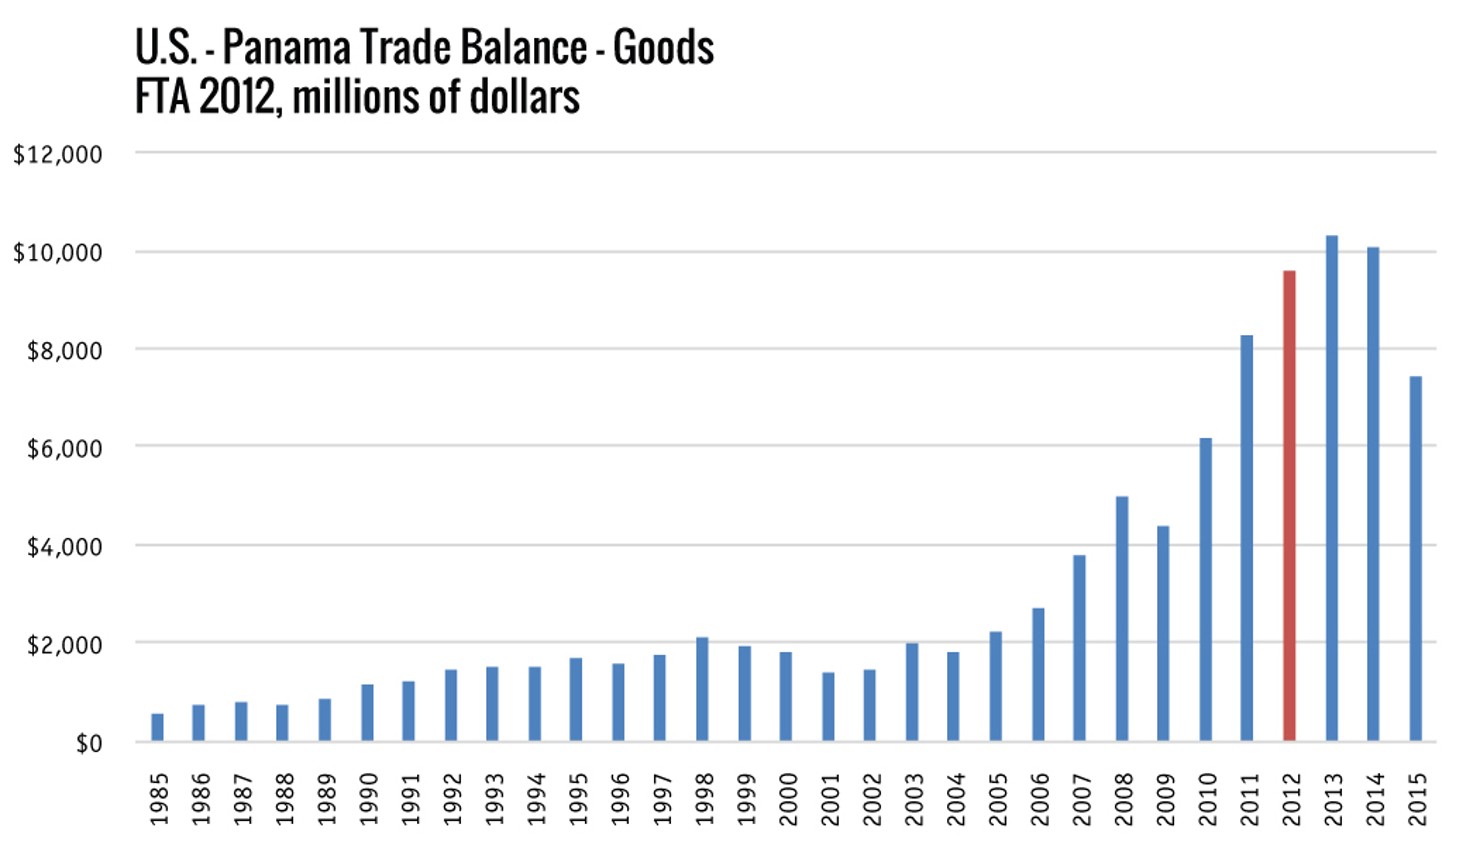
- Panama ($3.7 billion)
- El Salvador ($3.1 billion)
- Morocco ($3.1 billion)
- Oman ($2.5 billion)
- Bahrain ($911 million)
- Jordan ($596 million)
Overall, the trade balance in the goods worsened in the following:
- Nicaragua (-$4.3 billion)
- Costa Rica (-$8.6 billion)
- South Korea (-$38.0 billion)
Over the three-year pre-FTA period compared to the 2013-2015 period, the total change in the goods trade balance went from -$3.7 billion to $85.5 billion when all 17 nations are put together. That’s an improvement of $89.2 billion in 2015 dollars.
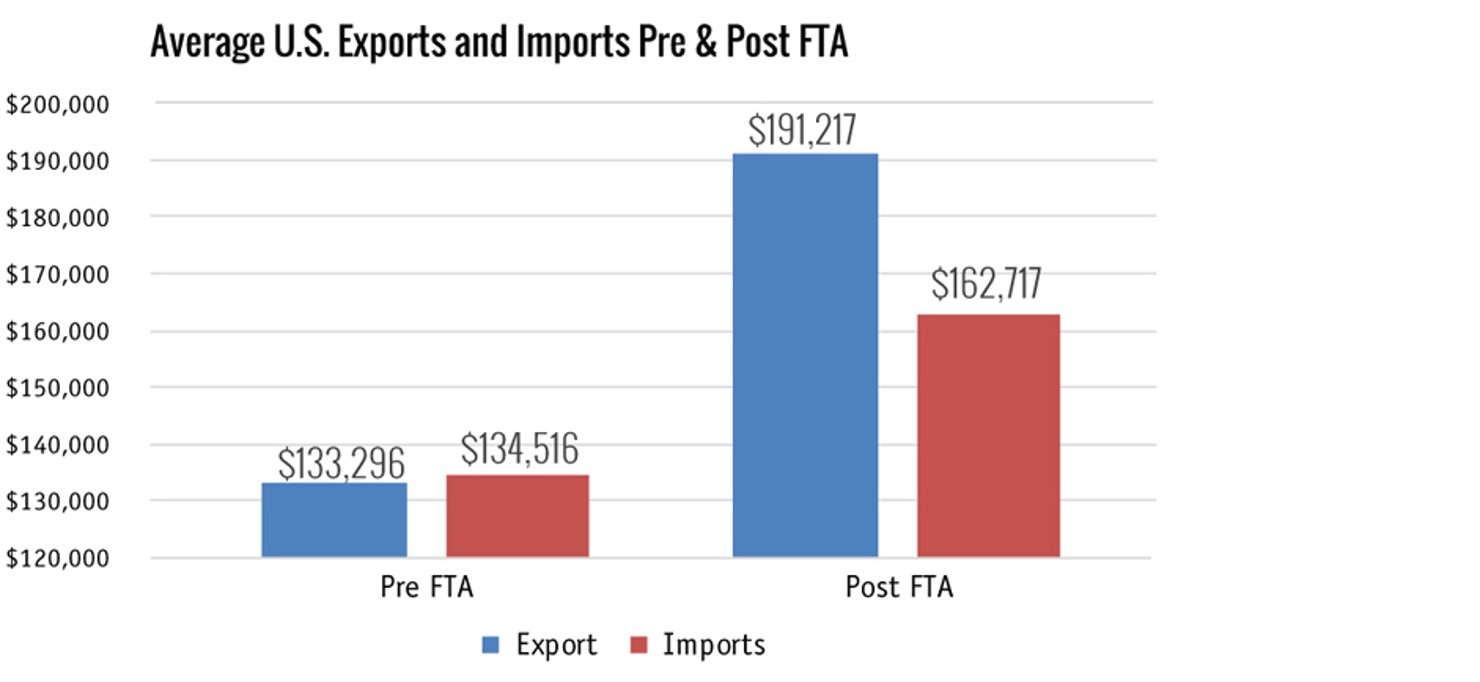
Finding #3: U.S. exports grew by 42%, double the growth rate of imports, which grew by only 21%.
U.S. goods exports increased from $400 billion to $574 billion in 2015 dollars, while imports only grew from $404 billion to $488 billion in 2015 dollars.
Finding #4: The United States previously had trade deficits with nine countries before FTA implementation. Now, the United States has deficits with only three.
Before FTA implementation, the United States had a trade deficit in goods with Chile, El Salvador, Honduras, Nicaragua, Guatemala, Bahrain, Peru, Korea, and Colombia. Following the FTA implementation, the United States only has trade deficits with Nicaragua, Costa Rica, and Korea.
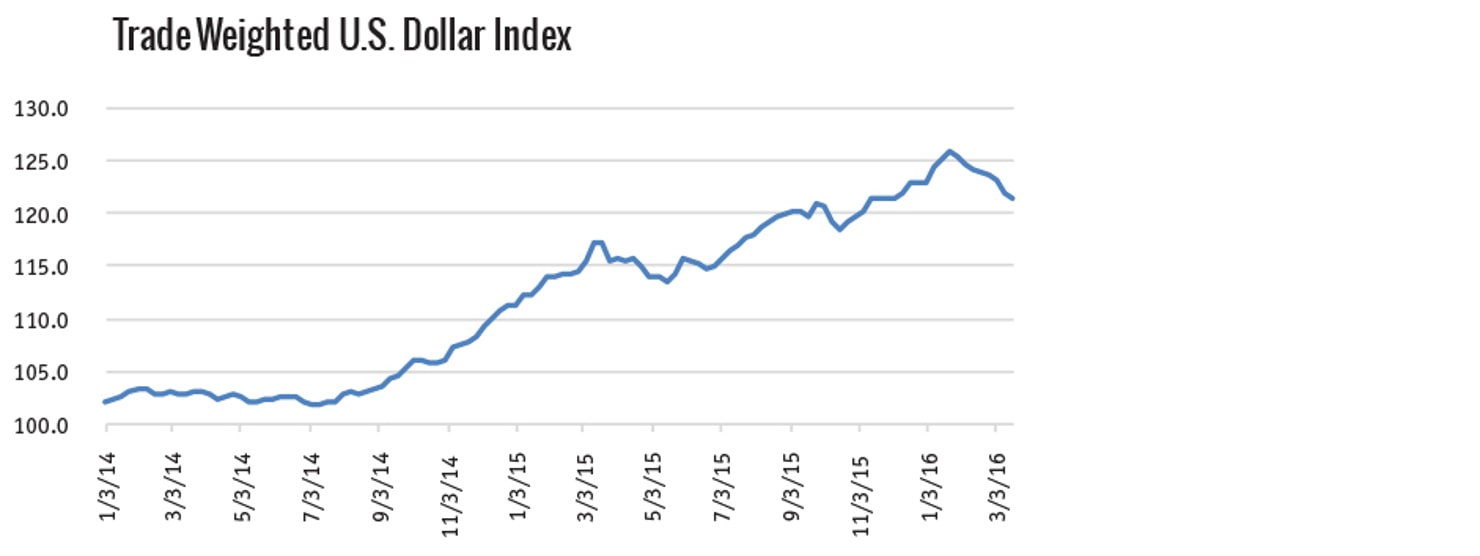
Finding #5: U.S. trade balances from these modern FTAs remain positive despite strong dollar.
The U.S. dollar has strengthened by about 20% since the summer of 2014. This means that U.S. goods are 20% more expensive overseas. U.S. exports in 2015 decreased 7% compared to 2014, which is, in part, because of the appreciation of the greenback. The chart below shows how quickly and dramatically the value of the dollar has increased.
Conclusion
If we are going to judge future trade deals on the performance of past trade deals, we should look at all of them, not just NAFTA.
If we judge these FTAs solely on their economic impact as measured by balance of trade in goods, the 17 most recent trade deals have been successful in putting American products on foreign shelves. These FTAs have increased exports at double the rate of imports, improved the balance of goods trade for 14 of 17 countries, and turned previous goods deficits into surpluses. The fact that these figures omit our trade in services—America’s strength—significantly understates the powerful positive effect these agreements have had across the board.
By 2030, about 2/3 of the world’s middle class will live in Asia. Will that expanding middle class buy American goods? That is what’s at stake with TPP, and that is why accurately analyzing past trade deals matters.
Methodology
In this paper, we looked only at the balance of trade in terms of goods. Goods are defined as merchandise, supplies, raw materials, or other physical products—the easiest way to think about this is that any tangible item is considered a good. We intentionally exclude data on services trade, which include things like transportation and business or financial services, for a number of reasons. First, the United States has already established enormous and sustained trade surpluses in the services sector, so we didn’t want to obscure the findings of the goods trade. For example, in 2014, the United States had a $233 billion worldwide trade surplus in services.3 Even in the deals that are frequently targets of criticism—like NAFTA—the service sector fared well. Indeed, the United States enjoyed a services trade surplus of more than $41.7 billion with Canada and Mexico in 2014.4 Second, there is great concern that trade deals benefit white collar jobs, but not those wearing hard hats.
We looked at goods trade data for all countries with which the United States has an FTA that was concluded after NAFTA: Jordan (12/2001), Chile (1/2004), Singapore (1/2004), Australia (1/2005), Morocco (1/2006), El Salvador (3/2006), Honduras (3/2006), Nicaragua (4/2006), Guatemala (7/2006), Bahrain (8/2006), Dominican Republic (3/2007), Costa Rica (1/2009), Oman (1/2009), Peru (2/2009), Korea (3/2012), Colombia (5/2012), and Panama (10/2012).
To analyze these deals in a fair and objective way, we compared our trade balance in American goods with each country over two different periods of time: the three years immediately preceding the agreement and then the latest three years of available data (2013 through 2015, all post-agreement). The reason for these periods is two-fold: we now have at least three years of trade data for every post-NAFTA deal, and three-year periods show a deeper picture than a single year which could skew for various reasons. So, for instance, for the U.S.-Jordan FTA, which was implemented in December 2001, we looked at trade data from 1999, 2000, and 2001, as well as 2013 through 2015.
All data was converted into 2015 dollars using the Bureau of Labor Statistics inflation calculator for the sake of making accurate and fair cross-year comparisons.
In instances when a trade agreement was implemented mid-year, when nine or more months coincided with either pre- or post-agreement, the entire year was counted in the appropriate category (Jordan 2001, El Salvador 2006, Nicaragua 2006, Honduras 2006, Dominican Republic 2007, Peru 2009, and Korea 2012). If an agreement was implemented mid-year such that neither status had at least nine months, that year was omitted (Bahrain 2006, Guatemala 2006, and Colombia 2012).