Out With the Old, In With the New: Rating Higher Ed by Economic Mobility


With another college rankings season officially under our belts, an age-old question persists: Do college rankings actually reflect the purpose of our higher education system? Or do they just reproduce existing inequities by rewarding the same wealthy, selective schools that primarily serve students who were already set up for success?
The good news is that a handful of well-known ranking publications have recently attempted to address the implications of this latter question by incorporating metrics that look at the outcomes of lower- and moderate-income students into their methodologies.1 For example, even the controversial US News College Rankings—known to focus more on student selectivity rather than student outcomes—now takes into account the proportion of low- and moderate-income students who graduate from an institution.2 Some publications have even gone a step further by looking at the proportion of traditionally underserved students who enroll in each institution, in addition to how well the school sets them up to succeed.3
Yet, despite these efforts, historical prestige tends to outweigh student outcomes in the most popular rankings, resulting in the same highly-selective and well-resourced schools getting shuffled around the best colleges lists year after year. And instead of questioning why these schools don’t admit their fair share of low-income students or students of color, these rankings continue to reward schools based on how many students they exclude—not how many they truly serve.
We are in dire need of a completely different approach to assessing institutions of higher education. Instead of prioritizing reputation and selectivity, we propose a new rating system known as the Economic Mobility Index (EMI) that attempts to answer the question: “If the primary purpose of postsecondary education is supposed to be to catalyze an increase in economic mobility, which schools are succeeding in that goal?” The following analysis is designed to give policymakers, researchers, and consumers a better way to assess which colleges are delivering on that promise for low- and moderate-income students—and which ones are falling woefully short.
Creating an Economic Mobility Index
To assess the degree of economic mobility that institutions of higher education provide, we examined which schools enroll the highest proportion of students from low- and moderate-backgrounds AND provide them with a strong return on their educational investment. This index builds upon previous rounds of research focused on generational mobility, most notably Harvard economist Raj Chetty’s inter-generational mobility studies comparing students’ post-enrollment incomes to those of their parents.4
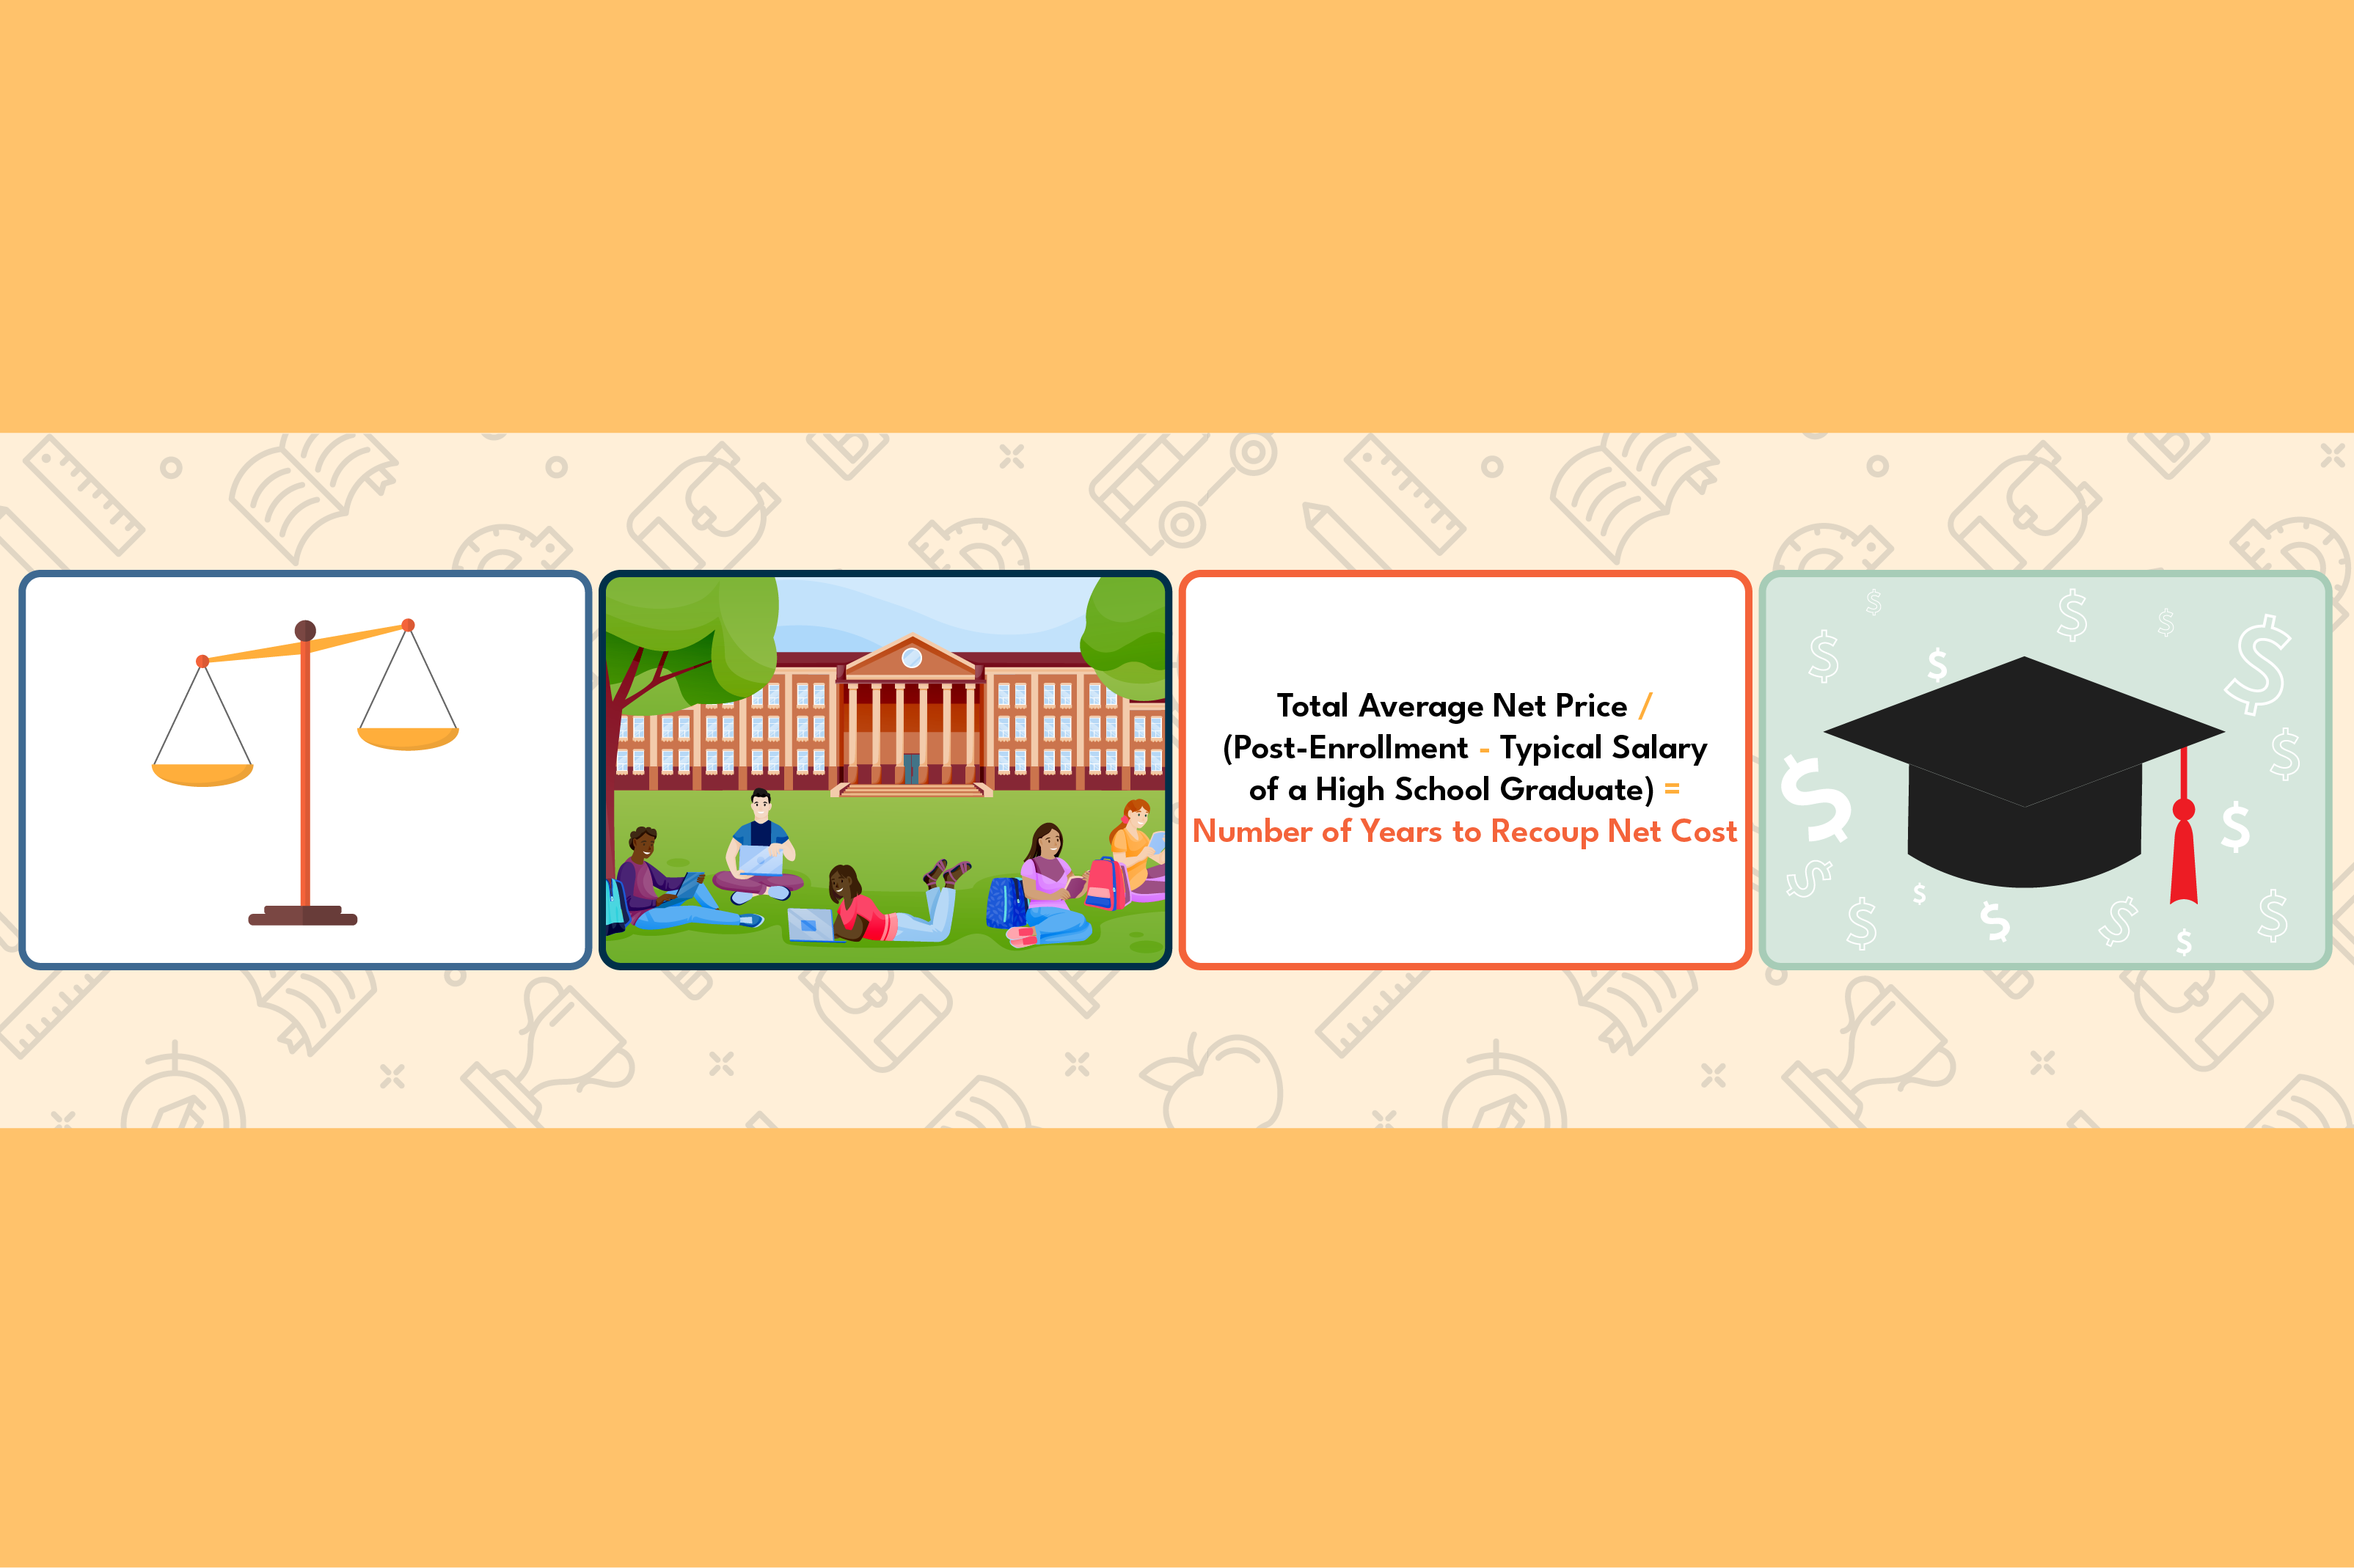
Our first step in creating the EMI was to determine the return on investment that the average low-income student obtains from attending a particular institution of higher education. To do this, we use our Price-to-Earnings Premium (PEP) metric that looks at the time it takes students to recoup their educational costs based off the earnings boost they obtain by attending an institution. In particular, we looked at the PEP for low-income students, defined as those whose families make $30,000 or less upon their enrollment in college. The data show that many institutions provide low-income students enough of an earnings premium that allows them to pay down their higher education costs within five years or less. However, others show these students unable to pay down their costs even fifty years later—or worse—provide no return on their educational investment whatsoever.
Price-to-Earnings Premium Calculation

The PEP metric and our previous analyses of it are useful in that they allowed us to see how well institutions serve the low-income students they enroll. However, taken alone, the metric fails to account for the share or number of low- and moderate-income students a school serves. So, when looking at the PEP exclusively, a highly-selective school that admits only a handful of low-income students each year could come out looking good—even though they are not serving the purpose we articulated or contributing to real economic mobility. Therefore, we have added onto our analyses by looking at the proportion of Pell Grant students (low- and moderate-income students who receive a federal grant to cover a portion of tuition costs) an institution enrolls—in addition to the PEP an institution produces for its low-income students—to provide us with a much fuller picture of the mobility a school is producing.
To create the EMI, we used the results from our PEP analysis on the outcomes of low-income students at 1,320 bachelor’s degree-granting institutions and multiplied their comparative rank by the percentage of Pell Grant recipients that each institution enrolls (download all of the data here).5
More information on the EMI methodology can be found in the appendix.
How Institutions Fare on the EMI
Schools that Provide the Quickest Return on Investment for Low-Income Students Actually Provide Little Economic Mobility
Many institutions that show the best PEP for their low-income students, like Duke and Stanford University, also perform well on traditional college rankings. That’s because the few low-income students who attend these institutions are often extremely high-achieving, benefit from their expansive institutional resources, and are able obtain a strong economic premium after earning their degrees. However, our EMI shows that the reach of these institutions to help low-income students obtain economic mobility is extremely limited—in large part because they admit such a small share of low-income students to begin with.
For example, Harvard—which ranked No. 4 on the time it takes low-income students to recoup their out-of-pocket costs—falls to 847 out of 1,320 bachelor’s degree-granting institutions on the EMI. The University of Chicago falls even further from No. 8 to 860 when you incorporate the make-up of the students they actually admit. These institutions allow the tiny number of low-income students that enroll to obtain enough of an earnings premium to recoup their educational costs quicker than other colleges. However, almost all of them admit and enroll less than 20% from low- and moderate-income family households. Only one institution in the original top ten PEPs for low-income students—CUNY’s Baruch College—exceeds this benchmark (47.7%). In fact, the total number of Pell students enrolled at Baruch (7,173) nearly matches the cumulative number of Pell students at the other nine “top ten” institutions combined (7,995).
Schools that Provide the Most Economic Mobility are Hispanic-Serving Institutions Concentrated in Three States
Institutions that provide the most economic mobility do so for two main reasons: 1) they offer a quick return on investment for low-income students, and 2) they enroll mostly low-and moderate-income students as part of their overall student body. If the primary purpose of postsecondary education is to promote economic mobility and create a consistent path to the middle class, a handful of institutions concentrated in just three states are leading the charge in delivering on that promise.
Notably, the schools shown to provide the most economic mobility are all Hispanic-Serving Institutions (meaning their enrollment is made up of at least 25% Hispanic students) located in California, Texas, and New York. This is likely due to a number of factors, including that each of these states have large shares of low-income students enrolled in higher education and have generous state funding that allows public four-year colleges in these states to be some of the most affordable options.6 Each of these schools also provides enough of an earnings premium for low-income students to recoup their educational costs in two years or less. In addition to these schools having a higher proportion of low- and moderate-income students than other institutions, their reach is also much larger. While the mostly private, selective schools that offer the best overall PEP for low-income students enrolled only 15,168 Pell recipients cumulatively, the ten schools that offer the most economic mobility enrolled 95,619—over six times as many per year.
Historically Black Colleges and Universities Also Score High on the Economic Mobility Index
The formulas used in traditional ranking publications often put Historically Black Colleges and Universities (HBCUs) at a disadvantage.7 Beyond the overemphasis on institutional selectivity, other factors such as racial, economic, and educational discriminatory practices have also systemically undervalued the accomplishments of HBCUs across the US.8 However, when accounting for the proportion of low- and moderate-income students that colleges enroll and the outcomes those schools produce, HBCUs score much higher on the EMI than traditional rankings reflect.
Similar to the institutions that are shown to offer the most economic mobility across the nation, all of these HBCUs enroll mostly Pell students, while allowing a quick return on investment for the low-income students they serve. In total, 31,659 Pell students attended the ten HBCUs that offer the most economic mobility—twice as many as are enrolled at those that were rated the highest on the raw PEP ranking for low-income students.
Conclusion
The reach, willingness, and ability to serve low- and moderate-income students well all combine to create the kind of socioeconomic mobility that institutions of higher education were intended to produce—but that isn’t prioritized in traditional rankings. While news outlets often focus on the most prestigious and selective institutions, these data show that their impact on increasing mobility is limited, and many other colleges serve exponentially more underserved students—and serve them quite well. If college rankings publications wish to increase their focus on schools producing the mobility our higher education system promises, these data can serve as a starting point to better reflect those institutions that are serving today’s students and demonstrating sustained commitment to helping them succeed.
Appendix
Creating an Economic Mobility Index
In order to assess the economic mobility that an institution provides, we first assign a percentile rank based on the time it takes their low-income students to recoup their educational costs based on the earnings premium they obtain.9 The school that provided the quickest time was assigned a percentile rank of 100%. The school that took the longest was assigned a percentile rank of 0%. The chart below shows an example of how this percentile ranking would work if there were only five institutions being evaluated.

When looking at the proportion of Pell Grant students an institution enrolls in addition to the PEP an institution produces for its low-income students, we get a much fuller picture of the economic mobility it provides. To do this, we take the PEP percentile rank and multiply that by the percentage of Pell Grant recipients an institution enrolls to create an EMI for each institution.

While School A scores within the 100th percentile for the time it takes its low-income students to recoup their educational costs, only a sliver of its student body—13.8%—comes from low- or moderate-income backgrounds. In contrast, School B scores better than 75% of other institutions on its PEP score, but also enrolls substantially more Pell Grant recipients (46.2%) than School A. Because of this, School B’s EMI rating (1) is higher than School A’s (4), as it provides a solid return on investment for a larger proportion of underserved students.

Endnotes
Kreznar, Christian. “America’s Top Colleges.” Forbes. https://www.forbes.com/top-colleges/. Accessed 23 December 2021.
“2021 National University Rankings.” Washington Monthly. https://washingtonmonthly.com/2021college-guide/national. Accessed 23 December 2021.
Brooks, Eric and Robert Morse. “A More Detailed Look at the Ranking Factors.” U.S. News & World Report, 12 September 2021. https://www.usnews.com/education/best-colleges/articles/ranking-criteria-and-weights. Accessed 23 December 2021.
The Editors. “A Note on Methodology: 4-Year Colleges and Universities.” Washington Monthly, September 2021. https://washingtonmonthly.com/magazine/september-october-2021/a-note-on-methodology-4-year-colleges-and-universities-12/. Accessed 23 December 2021.
Kreznar, Christian. “How We Rank America’s Top Colleges.” Forbes, 8 September 2021. https://www.forbes.com/sites/christiankreznar/2021/09/08/how-we-rank-americas-top-colleges/?sh=6ce4fe1943e0. Accessed 23 December 2021.
“The Opportunity Insights Economic Tracker: Supporting the Recovery from COVID-19.” Opportunity Insights. https://opportunityinsights.org. Accessed 23 December 2021.
This analysis, uses the mean salary for low-income students 10 years after initial enrollment, as the median is currently unavailable through US Department of Education data. Other Price-to-Earnings analyses use the median, as it better controls for outliers and is often more reflective of typical student outcomes. More information on how we calculate the Price-to-Earnings Premium can be found in “Providing Low-Income Students the Best Bang for Their Educational Buck, located at: https://www.thirdway.org/memo/providing-low-income-students-the-best-bang-for-their-educational-buck
Jackson, Victoria and Matt Saenz. “States Can Choose Better Path for Higher Education Funding in COVID-19 Recession.” Center on Budget and Policy Priorities, 17 February 2021. https://www.cbpp.org/research/state-budget-and-tax/states-can-choose-better-path-for-higher-education-funding-in-covid. Accessed 23 December 2021.
Scott-Clayton, Judith. “What accounts for gaps in student loan default, and what happens after.” Brookings Institution, 21 June 2018. https://www.brookings.edu/research/what-accounts-for-gaps-in-student-loan-default-and-what-happens-after/. Accessed 23 December 2021.
Darling-Hammond, Linda. “Unequal Opportunity: Race and Education.” Brookings Institution, 1 March 1998. https://www.brookings.edu/articles/unequal-opportunity-race-and-education/. Accessed 3 January 2022.
Ross, Janelle. “African-Americans With College Degrees Are Twice As Likely to Be Unemployed as Other Graduates.” The Atlantic, 27 May 2014. https://www.theatlantic.com/politics/archive/2014/05/african-americans-with-college-degrees-are-twice-as-likely-to-be-unemployed-as-other-graduates/430971/. Accessed 3 January 2022.
More information on the full methodology for calculating the amount of time it takes low-income students to recoup their educational costs, see, “Providing Low-Income Students the Best Bang for Their Educational Buck.” https://www.thirdway.org/report/which-college-programs-give-students-the-best-bang-for-their-buck.
Subscribe
Get updates whenever new content is added. We'll never share your email with anyone.