Report Published December 13, 2013 · Updated December 13, 2013 · 19 minute read
There's No Place Like Home: Housing Market Indicators
Lauren Oppenheimer & Peter Ryan Ph.D
Indicator 1: Housing Sector Share of CDP
The Housing Sector as a Share of the U.S. Economy, 2000-20131
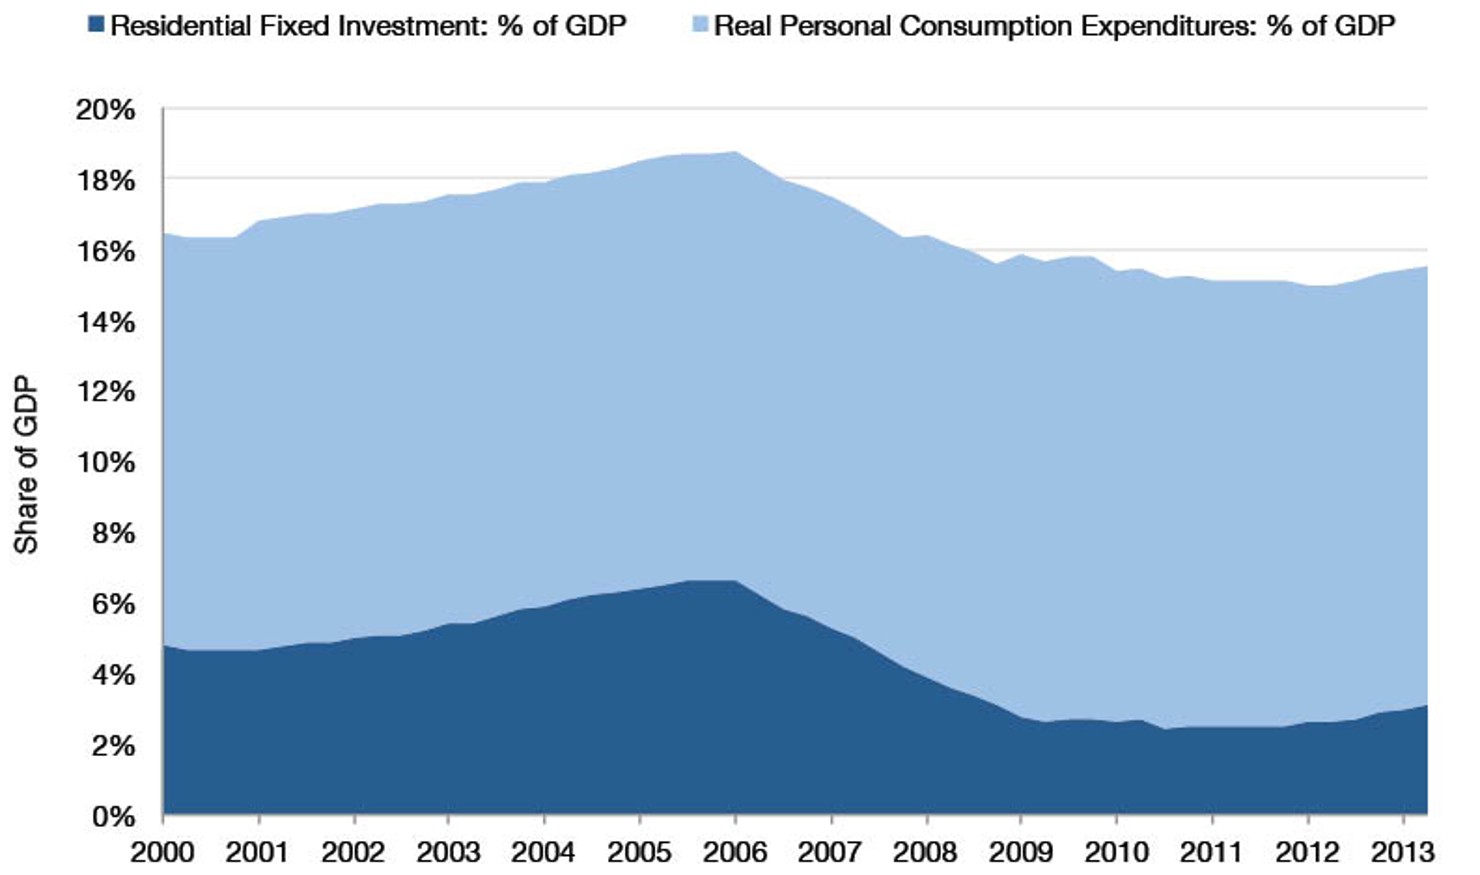
Note: Based on data from the Bureau of Economic Analysis.
FACT: The housing sector accounted for 15% of GDP in 2012.
The housing industry has a disproportionately large impact on the broader health of the U.S. economy contributing 15% to U.S. Gross Domestic Product (GDP) in 2012 and nearly 20% during the go-go years of the last decade.
There are two main ways that housing directly impacts the economy: (1) residential fixed investment refers to money spent on new home construction and improvements. These capital investments have on average accounted for 5% of U.S. GDP over the past forty years; the 3.1% figure recorded in the first quarter of 2013 shows there is still significant room for the sector to grow. (2) Consumption spending on housing services, which is larger but more a stable contributor to GDP, refers to the amount of money spent on “housing services” such as rent and utility payments.
Indicator 2: housing investments share of Quarterly GDP
Residential Fixed Investment (RFI) as a Contribution to GDP, 2001-20132
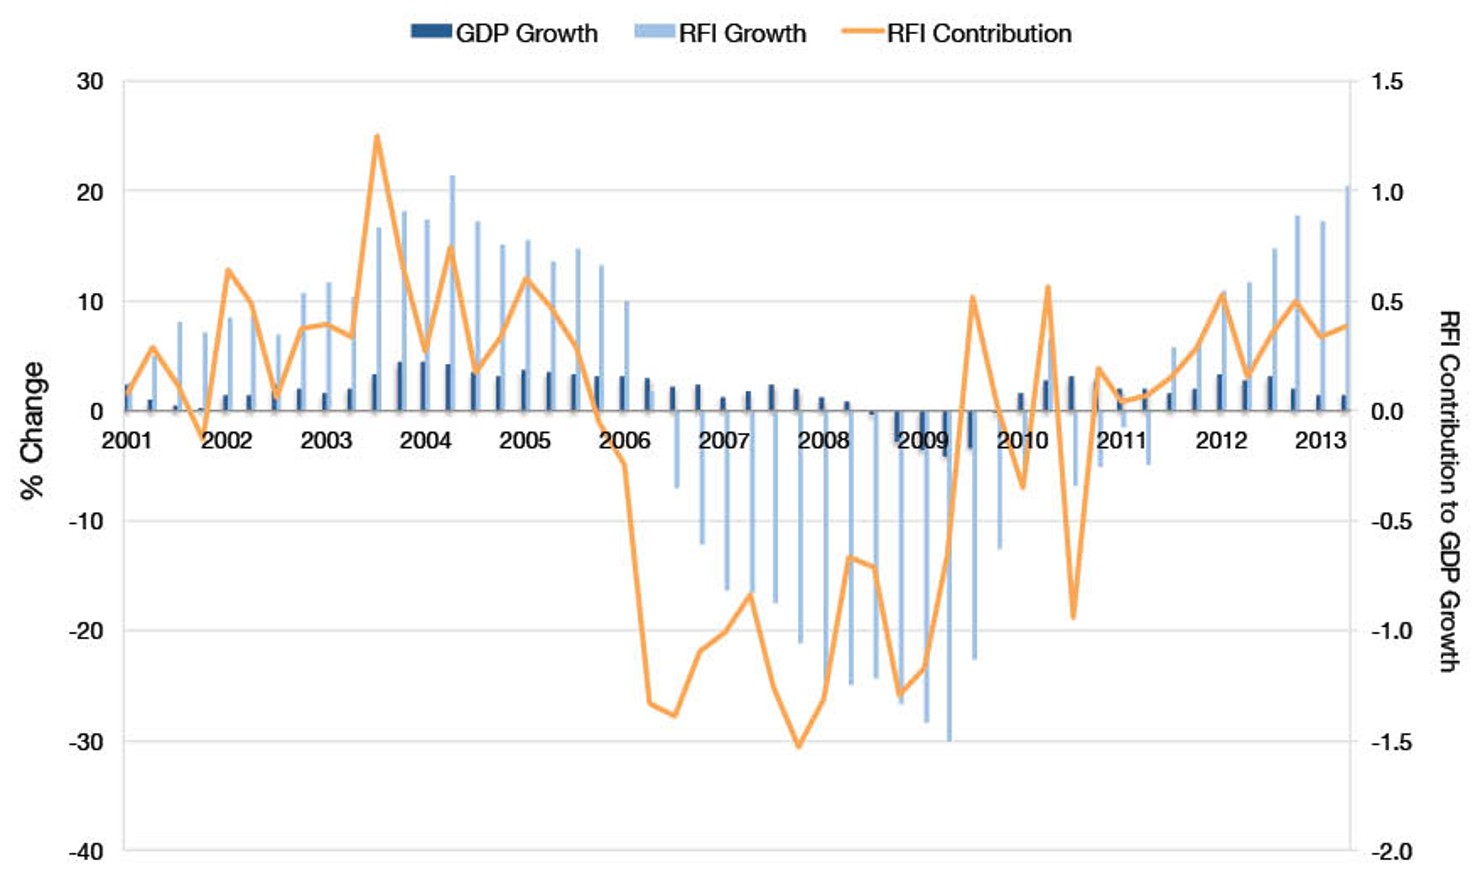
Note: Based on data from the Bureau of Economic Analysis and made available by the Federal Reserve Bank of St. Louis. Figures are seasonally adjusted.
FACT: Home construction and investment are key drivers of economic recovery.
In the past economic recoveries of 1980, 1991, and 2001, residential fixed investment was an early driver of growth, contributing an average of 20% to the increase in GDP in the first year and 10% in the second year after the end of the recession. In fact, part of the weakness in the U.S. economic recovery after the 2007-2008 economic crisis owed to the fact that residential investment grew weakly in the first year after the recession (2009) and actually declined overall in the second year of the recovery (2010).
Since late 2011, investment in new homes and home improvements has increased. New home construction and improvements accounted directly for between 0.19 to 0.43 points to the GDP growth rate. In the second quarter of 2013, GDP increased 1.4 points, 0.38 (or 27%) of which owed to private residential investment. This is still well below post-recession averages.
Indicator 3: Employment from Housing Construction
Residential Construction Employment, 2001-20133
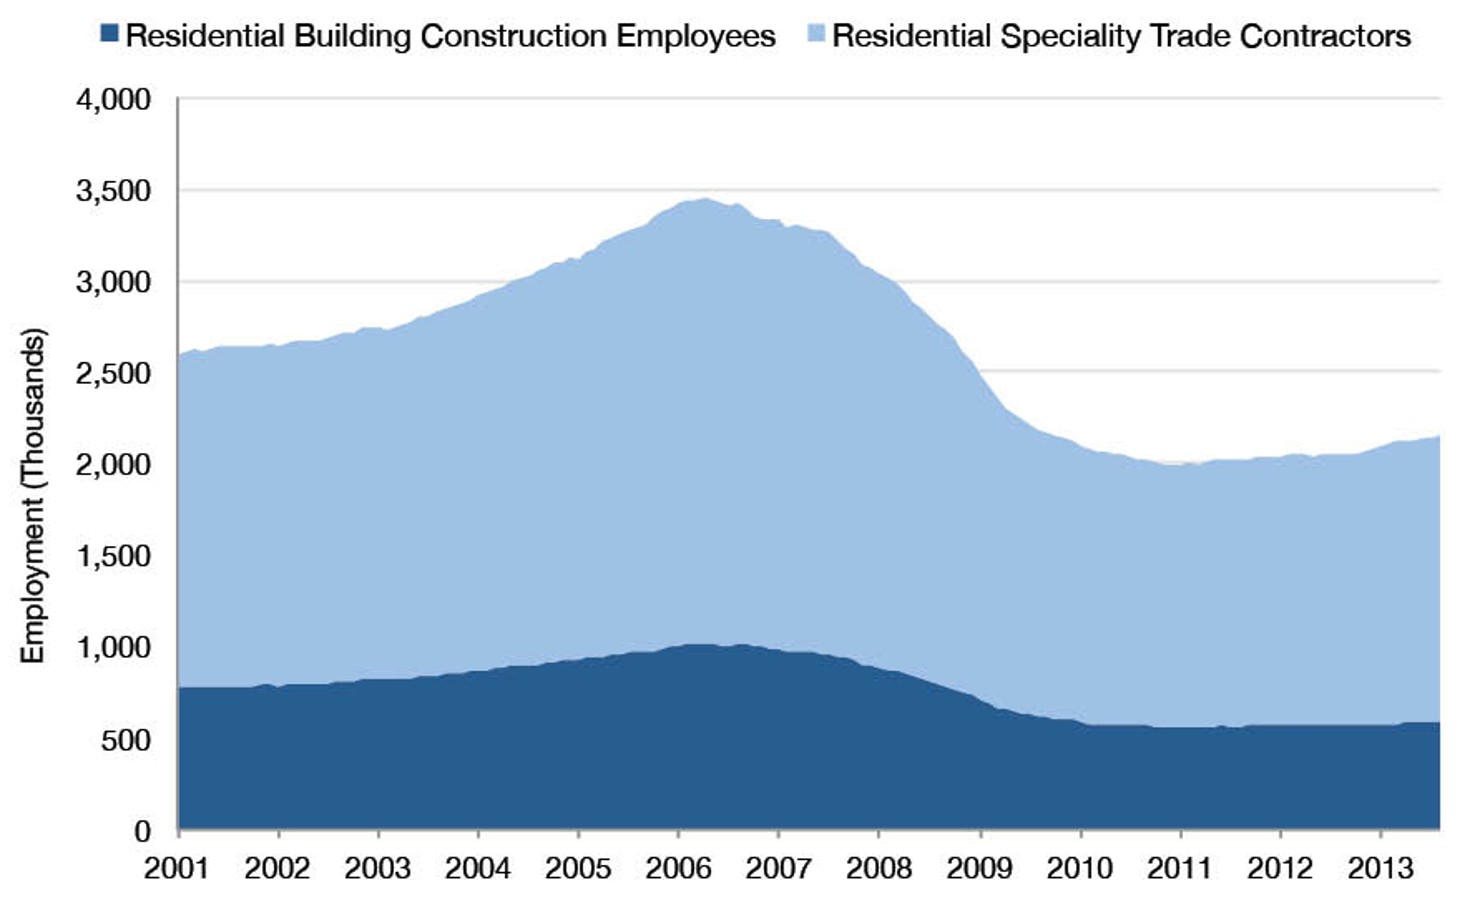
Note: Based on data from the Bureau of Labor Statistics and made available by the Federal Reserve Bank of St. Louis. Figures are seasonally adjusted.
FACT: Residential construction employment still well below “normal” levels.
As of May 2013, 1.6 million workers were employed in the residential construction industry and 570,000 worked directly for construction firms, making up 1.6% of total non-farm employment. When real estate and rental services industry employees are also included, the industry employs over 4 million workers, contributing to 3.1% of all non-farm employment in the U.S.4 These figures represent a decline of 1.3 million jobs from their 2006 peak. In fact, there are still 460,000 fewer people employed in the residential construction sector today than they were during the modest recession in early 2001.
Indicator 4: Home Prices and the financial crisis
Home Prices Before, During, and After the Financial Crisis, 1987-20125
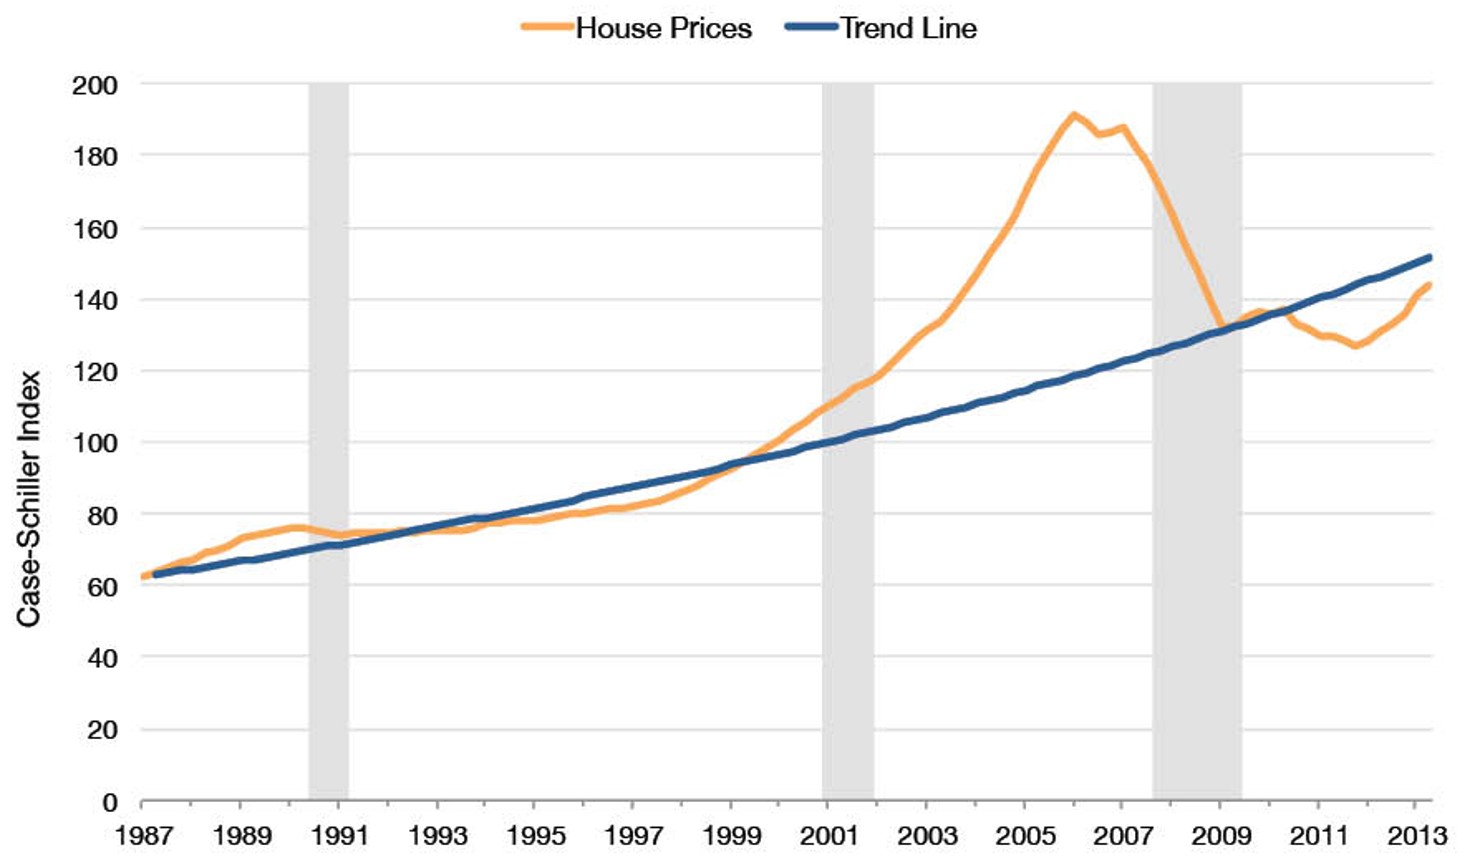
Note: Based on data from Standard and Poor’s Case-Shiller National Composite Home Price Index and made available by the Federal Reserve Bank of St. Louis. The index is a standardized representation of prices, with the average home price in Q1 2000 representing “100.” Trend Line is based on 1987 Q1 -1999 Q1. Figures are seasonally adjusted. The gray bars represent recessions.
FACT: Home prices have returned to “normal” levels.
During the housing “bubble” of the early-to-mid 2000s, the growth in home prices became detached from economic fundamentals such as wage growth. The orange line in indicator 4, which represents the housing price growth trend between 1987 and 1999, clearly shows how a bubble in house prices began to form in the early 2000s and peak in 2005-2006.
As indicator 4 shows, despite the drop in residential house values from their 2006 peak, prices have rebounded and are now close to what might be considered a sustainable level based on long-term growth rates. Even if housing prices continue to rise, we are a very long way from approaching housing prices last seen during the bubble.
Indicator 5: Regional Home Prices Before and After the Crisis
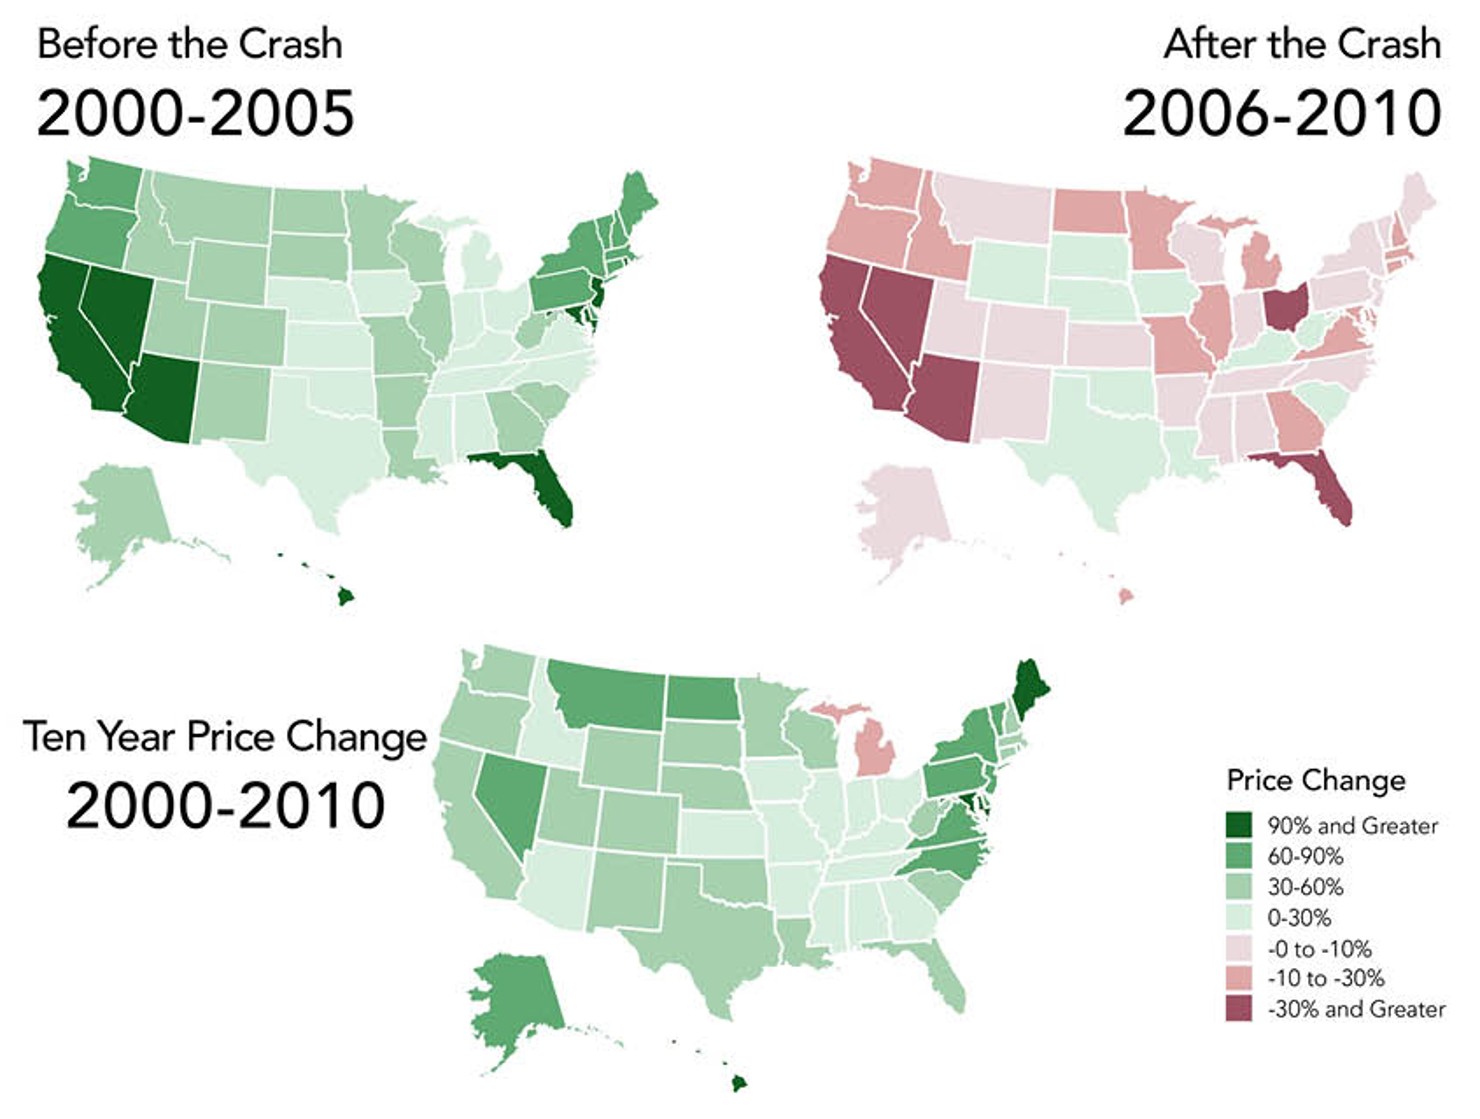
% Change in Residential Home Prices, 2000-20106
Note: Based on data from the Federal Housing Finance Agency. Figures are seasonally adjusted.
FACT: The housing downturn almost completely canceled out the dramatic gains in home prices between 2000-2006.
In housing, there is a phenomenon known as the “wealth effect.” As property values increase, homeowners spend more on consumer goods. This reflects a greater sense of financial security as well as the enhanced ability to convert the equity in their homes into cash by taking out loans. It is estimated that every 10% increase in home values leads to a 1% increase in personal consumer spending, while declines of the same magnitude lead to an overall 1% decrease.7
It is well documented that residential assets were a critical driver of the 2007-2008 financial crisis. Home prices accelerated dramatically between 1997 and 2006, rising 70% in constant dollars. Indicator 5 shows that in some regions, including Arizona, California, Nevada, and Florida, the level of increase was well over 80%.8
Indicator 6: Year-Over-Year Home Prices
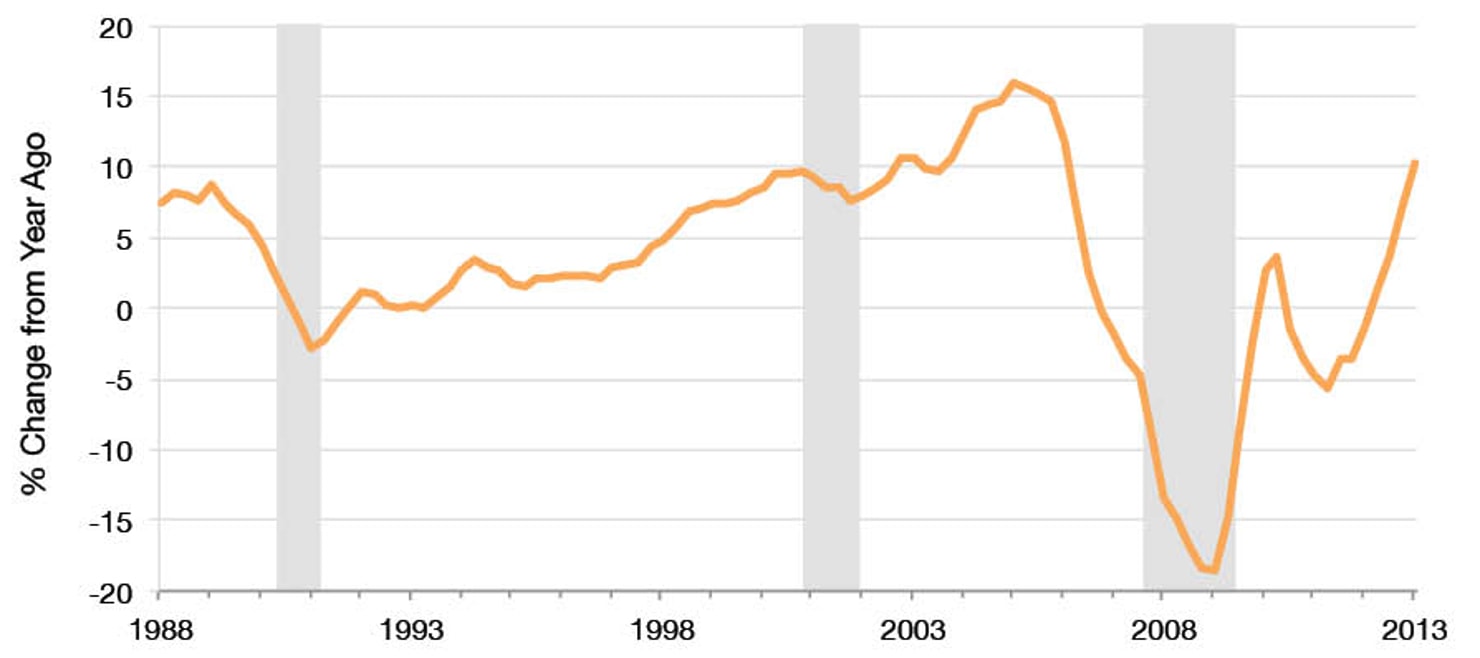
Residential Home Prices % Change, 1988-20139
Note: Based on data from Standard and Poor’s Case-Shiller National Composite Home Price Index and made available by the Federal Reserve Bank of St. Louis. Figures are seasonally adjusted. The gray bars represent recessions.
FACT: Residential home prices have been on the rise in 2013.
Indicator 6 underscores both the depths of housing bust and the duration of the boom that preceded it. Year-over-year housing prices jumped by 7% to 16% each year from 1998 and 2006, before plummeting by nearly 20% at the height of the recession.
House prices have increased significantly over the past year, a combination of demand for residential property by investors, rising consumer confidence, and low mortgage rates.10 The median price of new houses sold in July 2010 was $204,000; by April 2013 that figure had risen to $271,600. Year-over-year, home prices have increased by 10.2% nationally since April 2012.
While rising house prices are welcome, we note three reasons for caution:
The Case-Shiller index is more heavily weighted towards major metro-areas and may not reflect the housing situation throughout the rest of the country.
It may give an inflated sense of national home value appreciation because it includes foreclosure re-sales; many of these properties are no longer being sold at the ‘distressed’ prices they once had been, a fact that artificially inflates house price growth.11
There is an ongoing debate about whether this pace of house price growth is sustainable, particularly in a higher interest rate environment.
Indicator 7: Home Sales
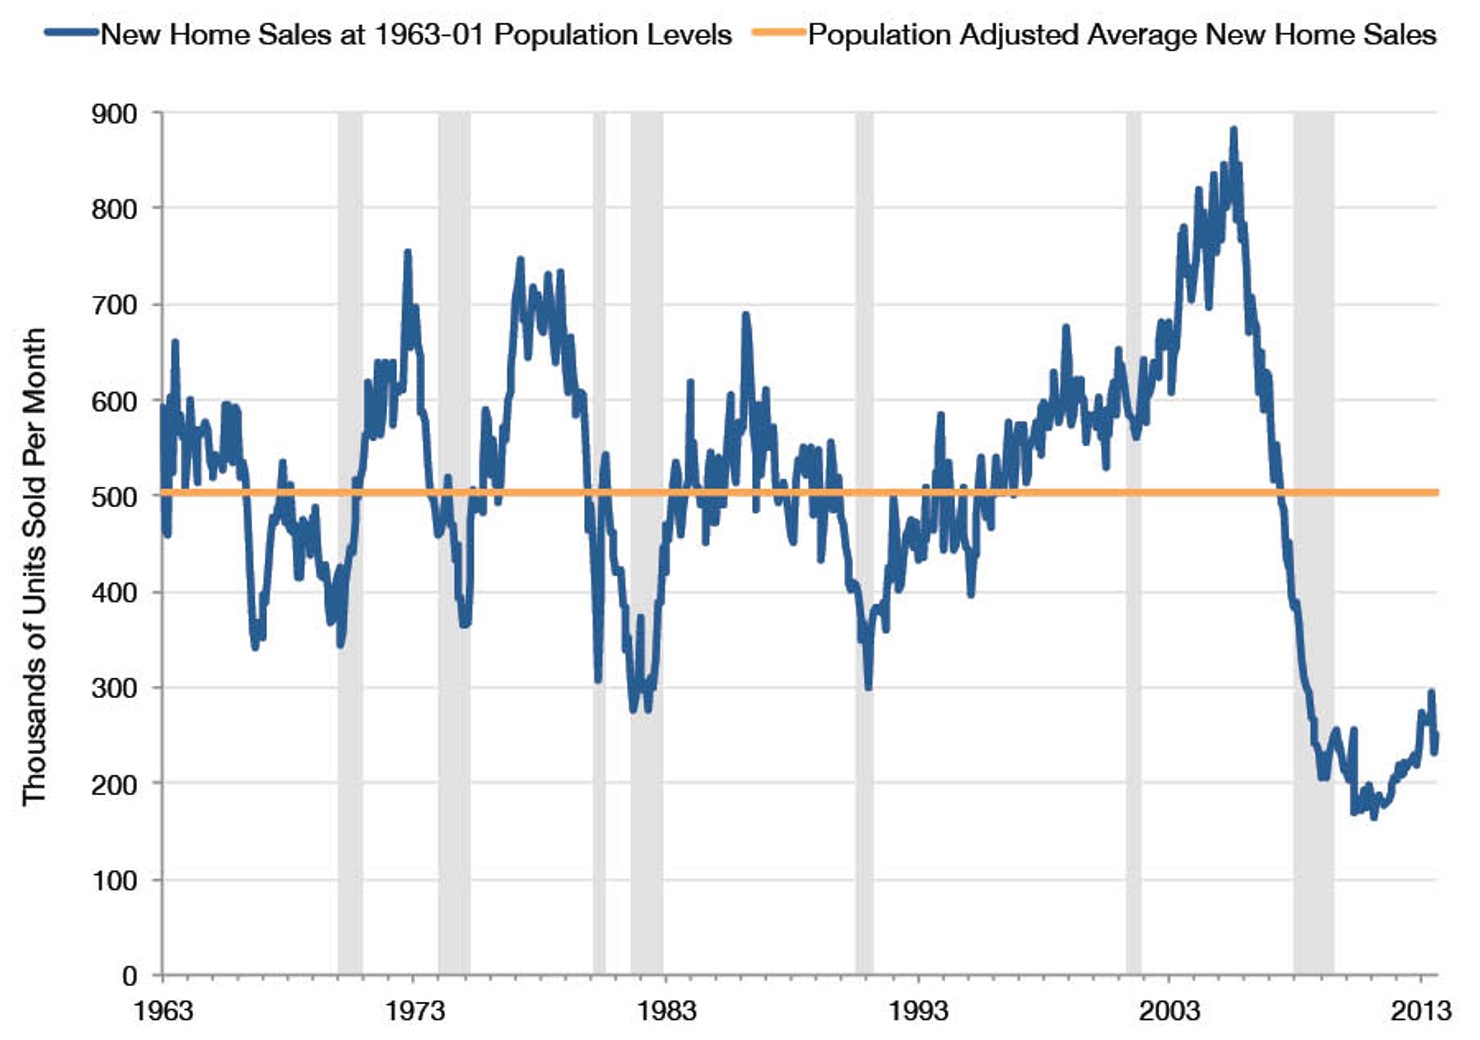
Single Family Home Sales, 1963-201312
Note: Based on data from the U.S. Department of Commerce, Census Bureau and made available by the Federal Reserve Bank of St. Louis. Figures are seasonally adjusted. The gray bars represent recessions.
FACT: New home sales are improving but there’s room for growth.
New home sales and inventories are important indicators of demand for housing. Sales of new homes in August of 2013 increased by13% year-over-year. While this is good news, the pace of new home sales is still a little under half of what is considered to be “normal” levels,13 as illustrated by the population adjusted sales levels shown in indicator 7 above.
Indicator 8: Supply of Homes for sale
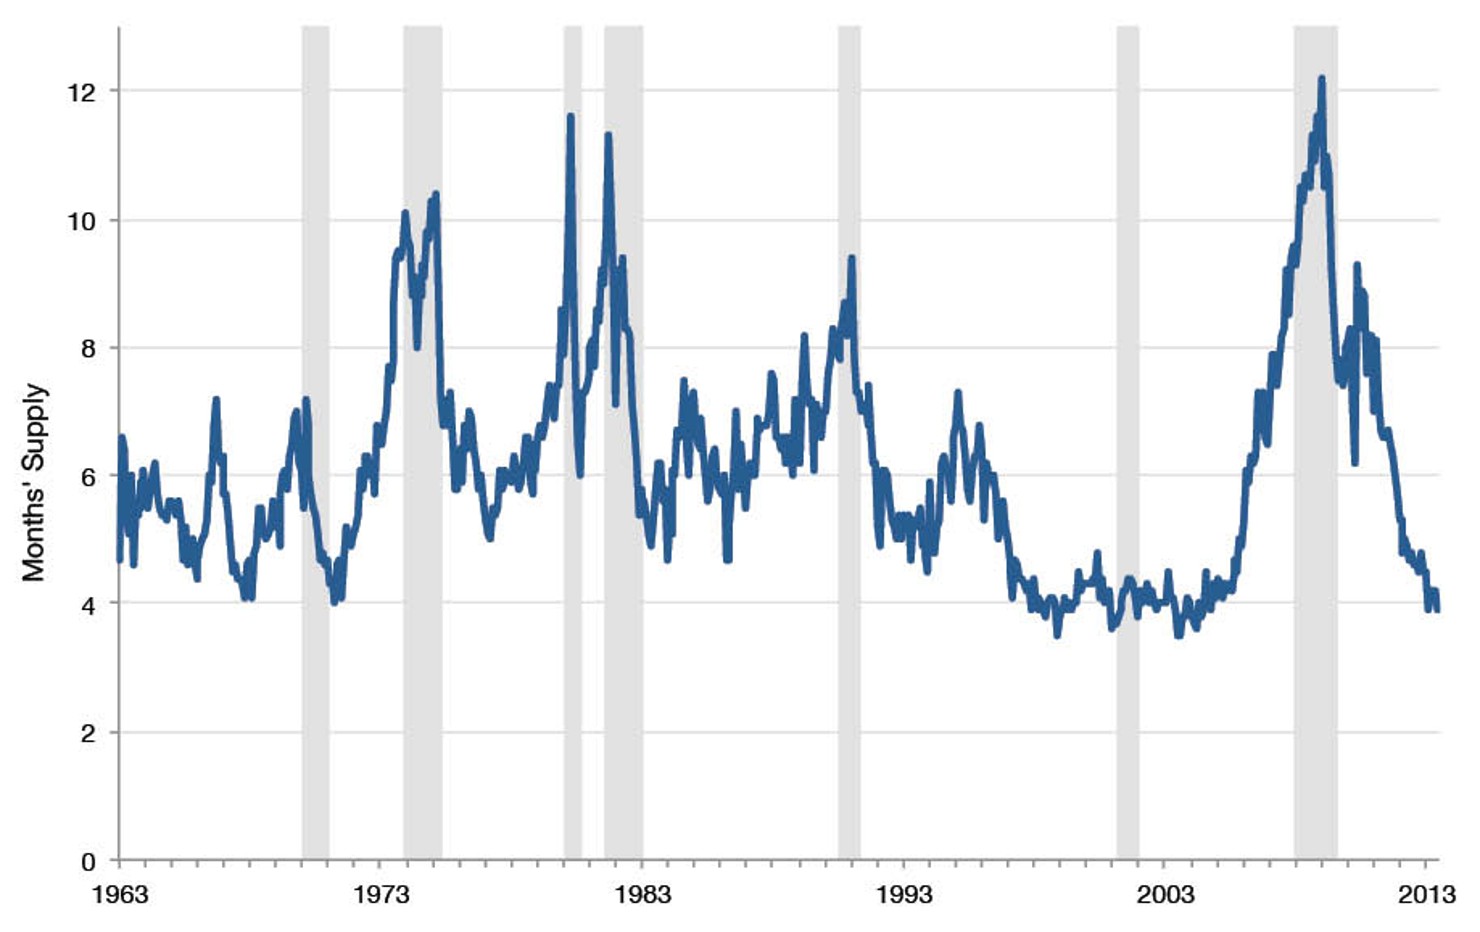
Supply of Homes for Sale, 1963-201314
Note: Based on data from the U.S. Department of Commerce, Census Bureau and made available by the Federal Reserve Bank of St. Louis. Figures are seasonally adjusted. The gray bars represent recessions.
FACT: A decrease in the supply of homes is a positive sign for the housing recovery.
As new home sales have gone up, inventories of those homes have gone down. The monthly number of new homes available for sale at the end of April 2013 was 156,000, a sharp drop from the over 500,000 available in July 2006 and a reduction from the 200,000 available in July 2010.15 Represented in terms of months of supply, the currently available housing inventory would be sold within 4 months, placing that figure on par with the supply of housing prior to the housing downturn and representing a healthy decline from its recession era peak of 12 months. This suggests that demands for housing is picking up and aligns with reports of shortages in existing housing stocks coming from realtors in some areas of the country.16 While it also reflects the modest pace of new home construction over the past 4 to 5 years,17 this is an unmistakably positive sign for the housing market moving forward with the strongest rates in 50 years.
Indicator 9: New Home Construction
Housing Starts, 1963-201318
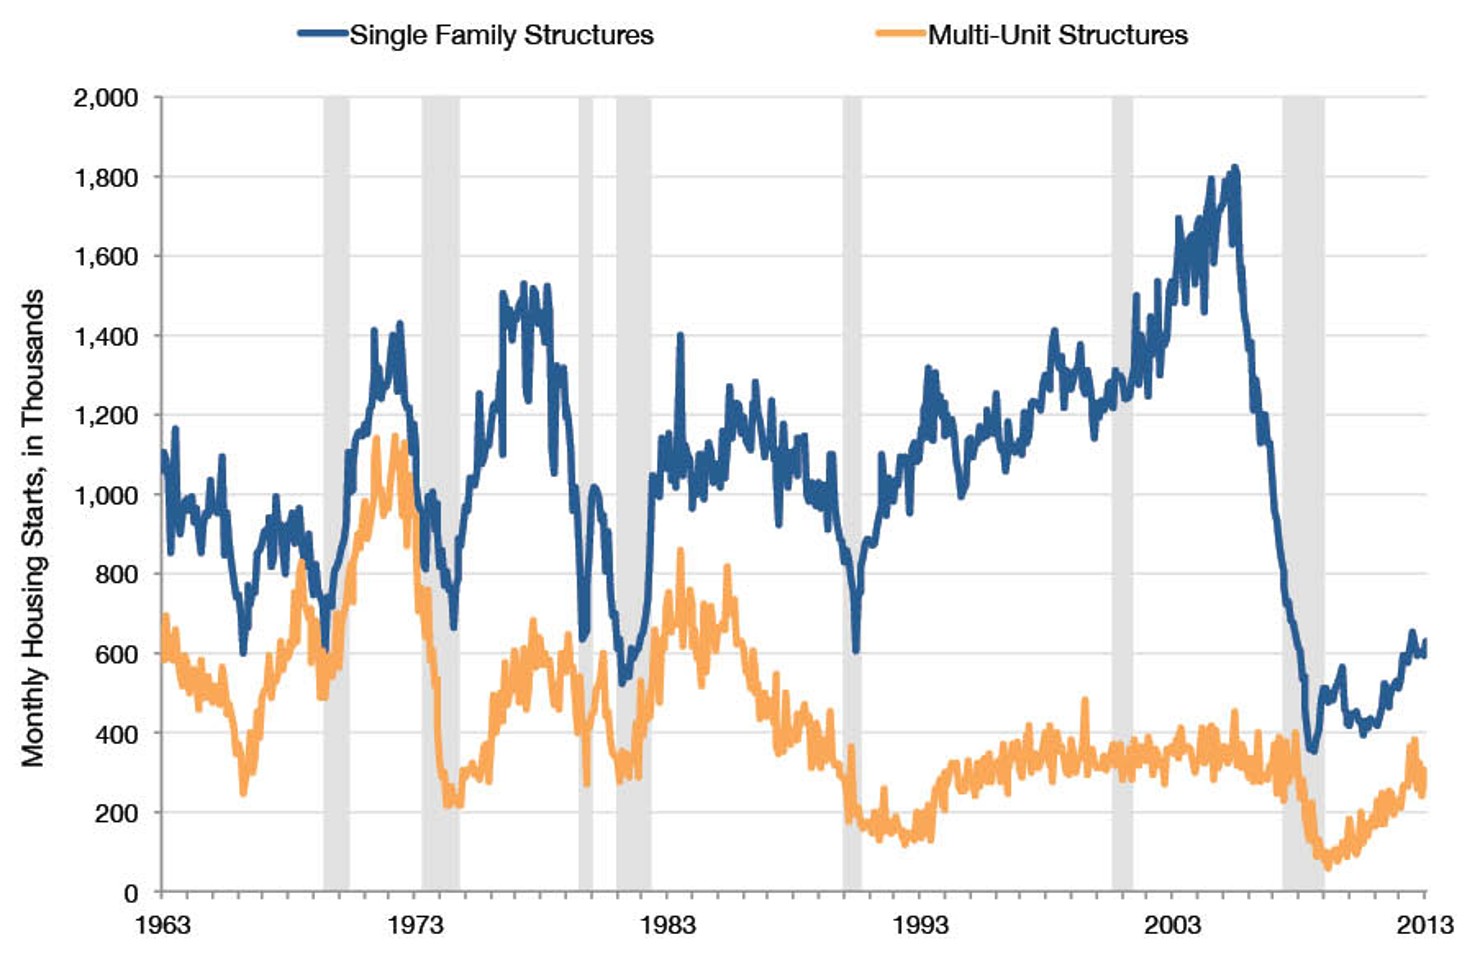
Note: Based on data from the U.S. Department of Commerce, Census Bureau and made available by the Federal Reserve Bank of St. Louis. Figures have been adjusted for population. Figures are also seasonally adjusted. The gray bars represent recessions.
FACT: Housing starts show that conditions have improved but there’s still room for the market to grow.
Housing starts and permits granted give us a forward-looking indication of where the market is heading. Housing starts refer to the number of new residential construction projects that have begun and are reported on a monthly basis using annualized figures.
Until October 2008, the total number of single family and multi-unit housing starts had only fallen below 800,000 units per year. For the following 47 months it failed to break that 800,000 barrier. Although the market improved by 2012, total new starts were still below that historical norm by the end of the year.19 Estimates for 2013 are looking more promising; in March, the annual estimate for total new residential construction projects was 1,021,000. While the number has since softened to a level of 891,000 in August (a reflection of volatility in estimates of multi-family unit starts),20 that still represents a 19% increase over the August 2012 figure of 749,000.21
Indicator 10: New Home Permits
New Home Permits, 1963-201322
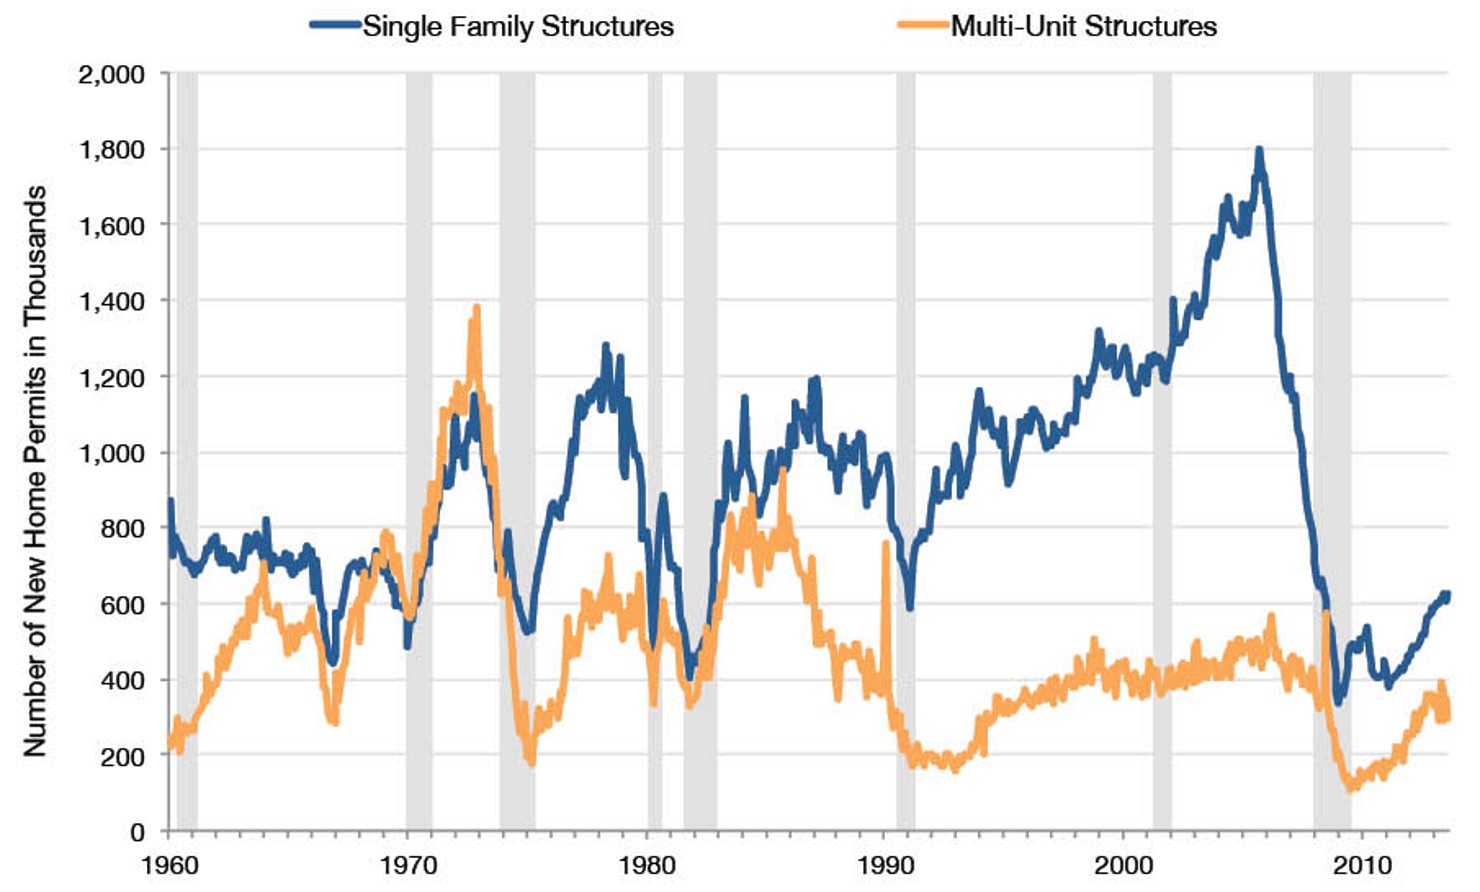
Note: Based on data from the U.S. Department of Commerce, Census Bureau and made available by the Federal Reserve Bank of St. Louis. Figures have been adjusted for population. Figures are also seasonally adjusted. The gray bars represent recessions.
FACT: New housing permits are improving, although they are well below historical levels.
The number of residential construction projects with building permits, a less volatile measure, has also shown a steady increase over the past year. The total number of permits granted in August 2013 was 926,000, which is the highest level of existing residential permits since June 2008 and a 12% increase from the August 2012 figure of 827,000. Among those were permits for 627,000 single family units and 299,000 units in buildings with 2-units or more (the latter typically being apartment buildings).23
The increase in building permits for single family homes is a particularly strong indicator that the housing sector is in a recovery. In the wake of the 2008 crisis, young, newly formed households often choose to rent apartments or buy lower-cost condominiums over more expensive single family homes.24 The fact that demand for single family homes is increasing suggests that homebuyers have greater confidence in the market moving forward, as well as an ability to spend more to purchase their home. It is worth noting, however, that both measures are well below “normal” historical levels.
Indicator 11: Sales of Home Improvement Supplies
Building Materials, Garden Equipment, and Supplies Store Sales in 2013 Dollars, 1992-201325
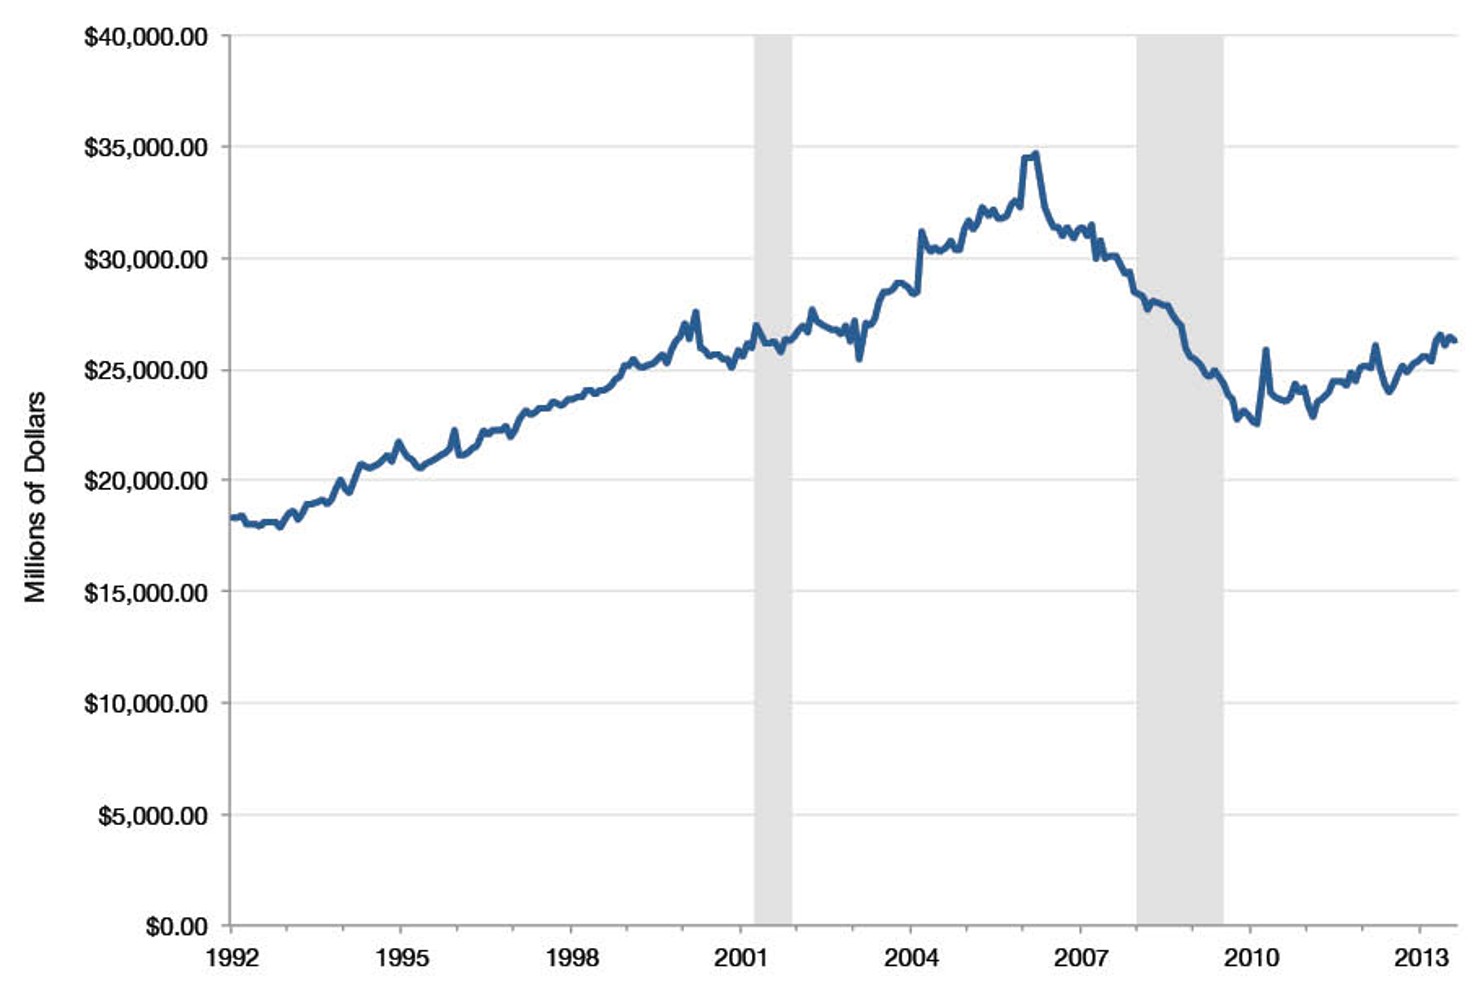
Note: Based on data from the U.S. Department of Commerce, Census Bureau and made available by the Federal Reserve Bank of St. Louis. Figures are seasonally adjusted. The gray bars represent recessions.
FACT: Building supply store sales are increasing – a good indicator that the housing sector is in the middle of a recovery.
The health of the housing market can also be gauged by other, less direct measures. Indicator 11 shows that building material and garden stores sales declined by $12 billion from their peak in 2005 and 2006 to the immediate post-recession period in 2009. However, sales are on track to match levels seen during the strong, if not booming, housing market of the late 1990s and early 2000s, potentially another sign of a growing recovery.
Indicator 12: ForEclosures Nationwide
Mortgage Delinquencies in Foreclosure Process, 2005-201326
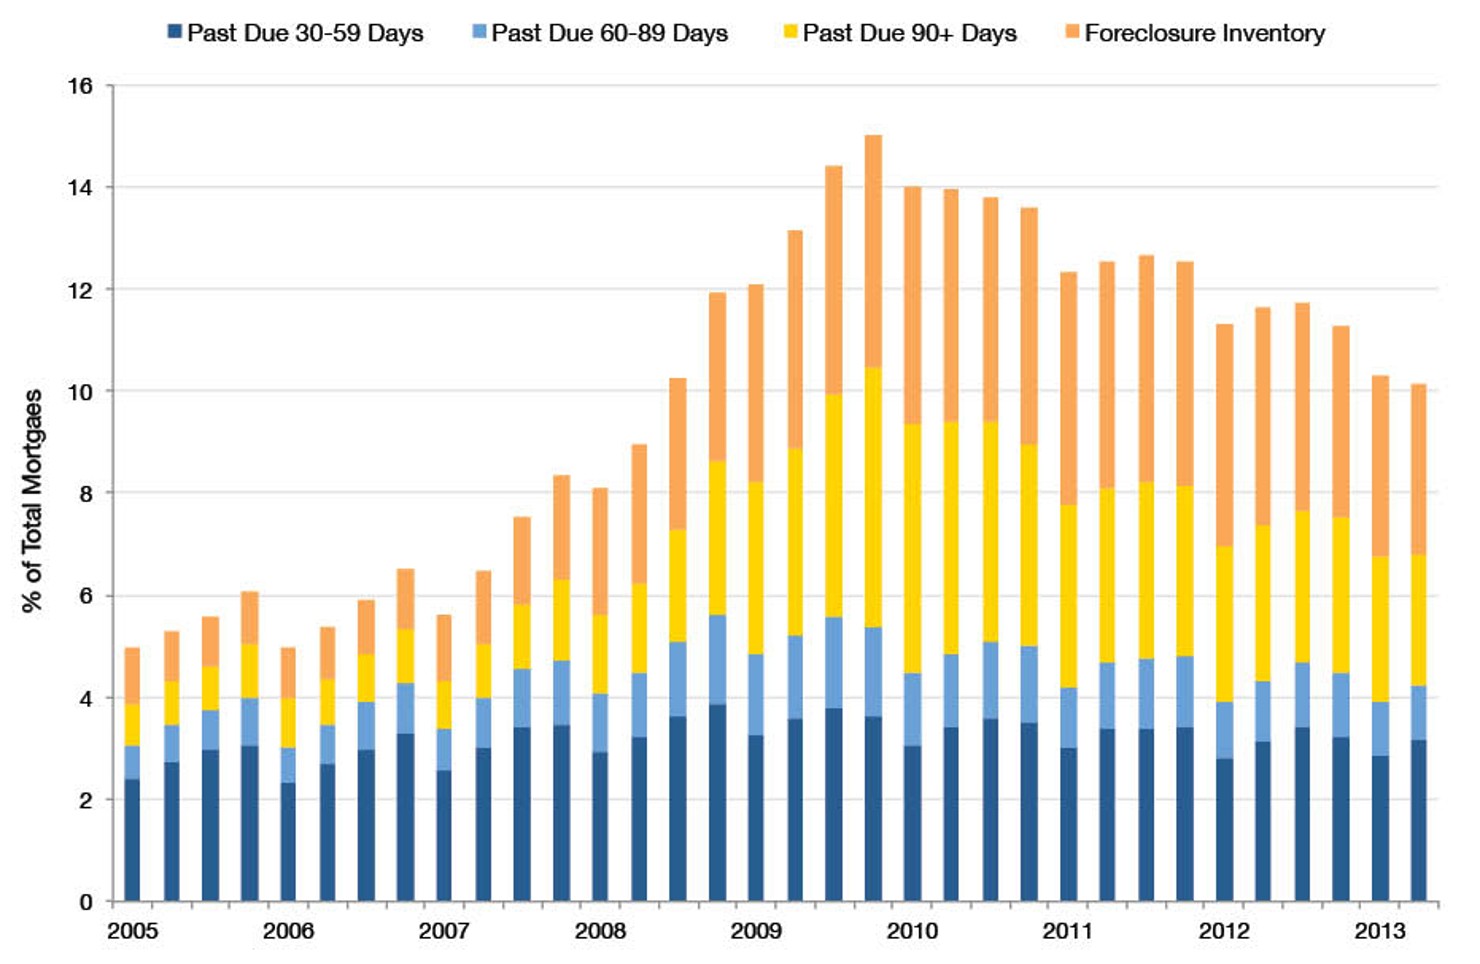
Note: Based on data from the Mortgage Bankers Association. “Foreclosure process” indicates that the process is ongoing but that the foreclosure itself has yet to be completed.
FACT: One in ten mortgage holders are late on their payments or in foreclosure.
Since the financial crisis began, 4.4 million home foreclosures have been completed.27 In April 2013, the number of foreclosures completed—a measure of homes actually lost to foreclosure—was 52,000, a decline of 16% year-over-year compared with April 2012. However, 3.3% of all mortgage holders are still at risk of foreclosure. While the number of homeowners in formal foreclosure processes has declined by a quarter from this time in 2012, there is still a long way to go before those numbers return to pre-crisis levels. Likewise, serious delinquencies—that is, late payments of 90 days or greater—are slowly going down, though at 2.3% of all mortgages they are still at unacceptably high levels. In short, as indicator 12 makes clear, there is some way to go before we return to “normal” levels of default on mortgage debt.
Another way of looking at is this: One in 20 mortgage holders was in trouble in 2005, peaking at one in seven in 2010, and declining to one in ten today.
Indicator 13: Foreclosures by State
% of Mortgages in Foreclosure Process by State, 2013 Q228
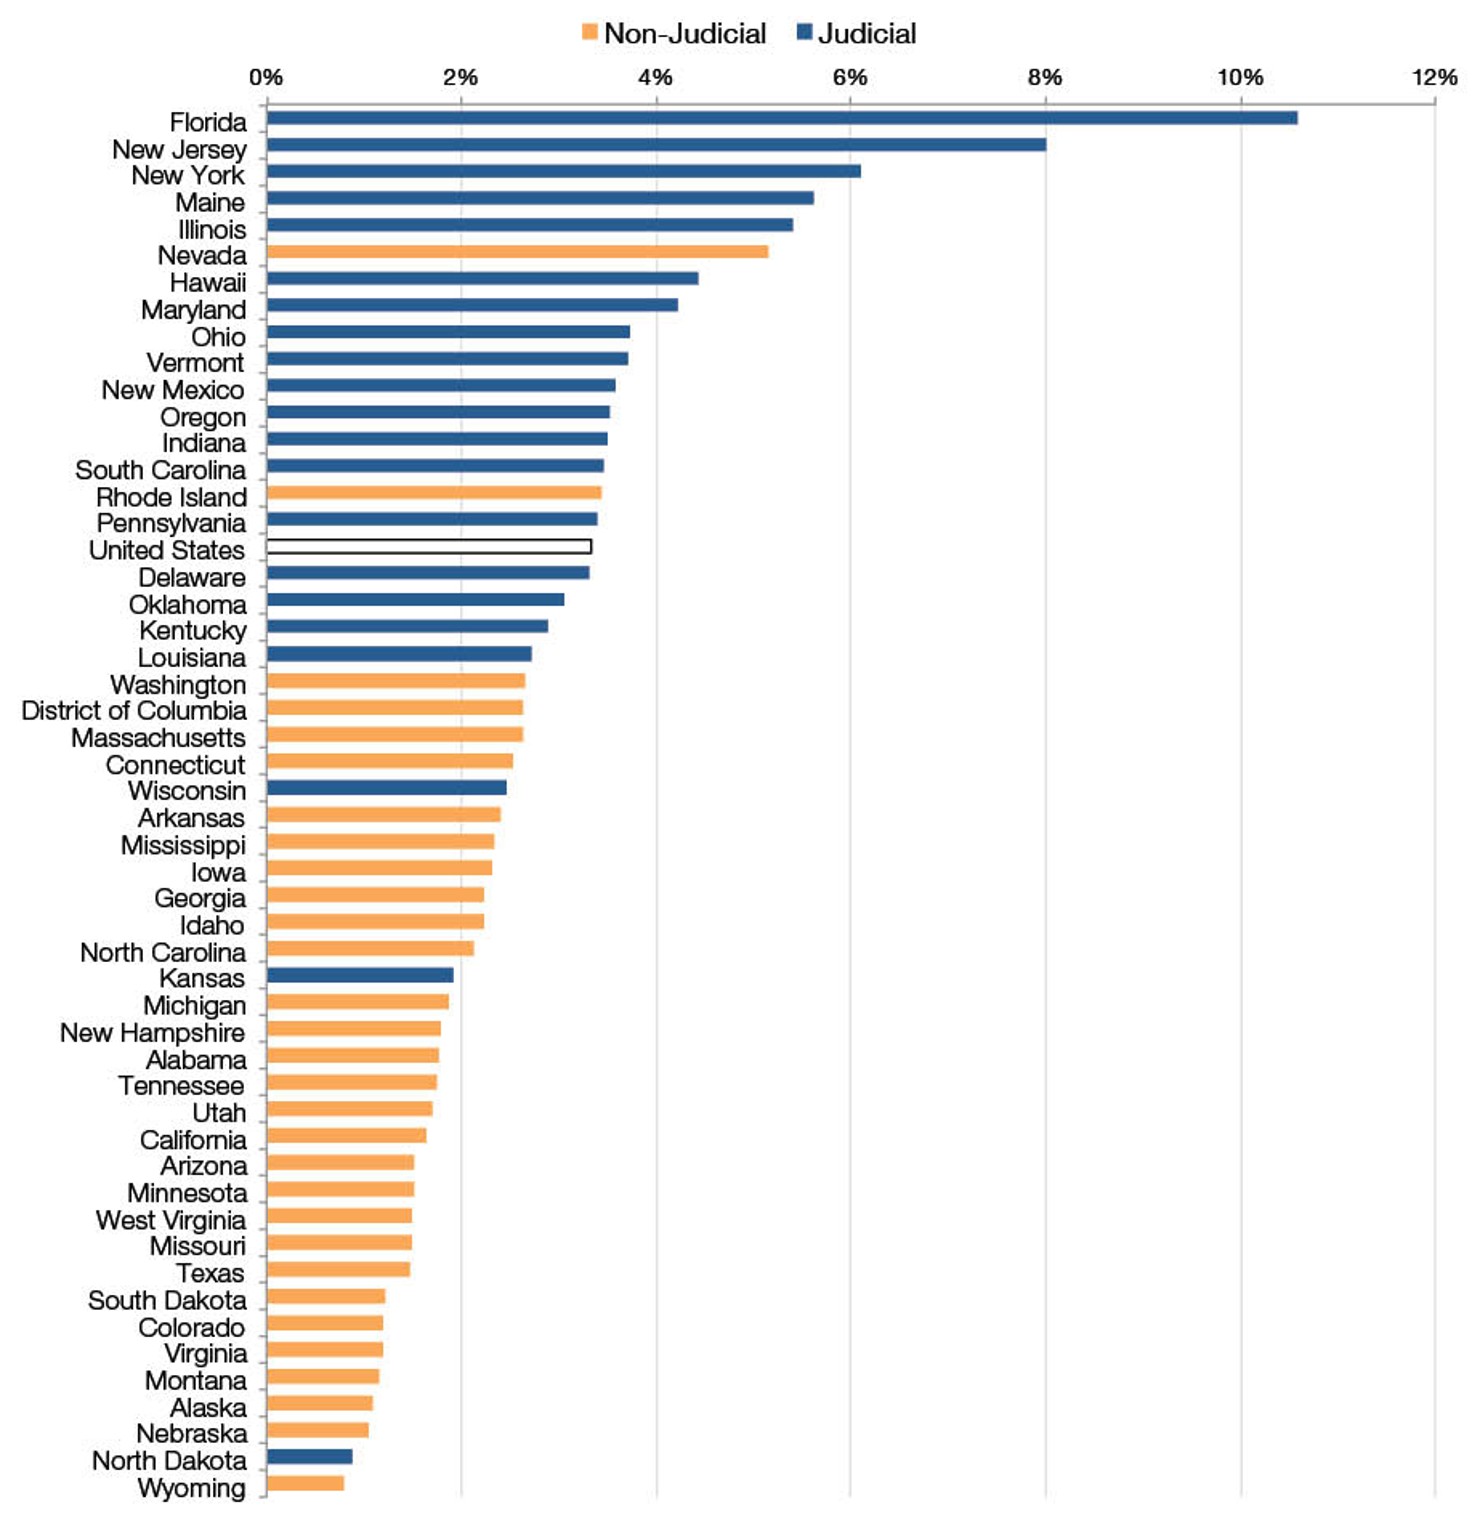
Note: Based on data from the Mortgage Bankers Association. In “judicial” states, the foreclosure process involves formal legal proceedings; and in “non-judicial” states, there is no court involvement.
FACT: A handful of states are still struggling to reduce the number of properties in foreclosure.
While the national picture is improving, the story differs by state. The total percentage of homes undergoing foreclosure in Florida is close to 12%, while Nevada, New Jersey, New York, Illinois, Maine, and Connecticut all have foreclosure activity rates above 4%, far higher than the “normal” rate of under 2%.
Indicator 14: New Foreclosures in Specific States
% of New Foreclosure Processes by Selected States, 2003 Q1-2012 Q429
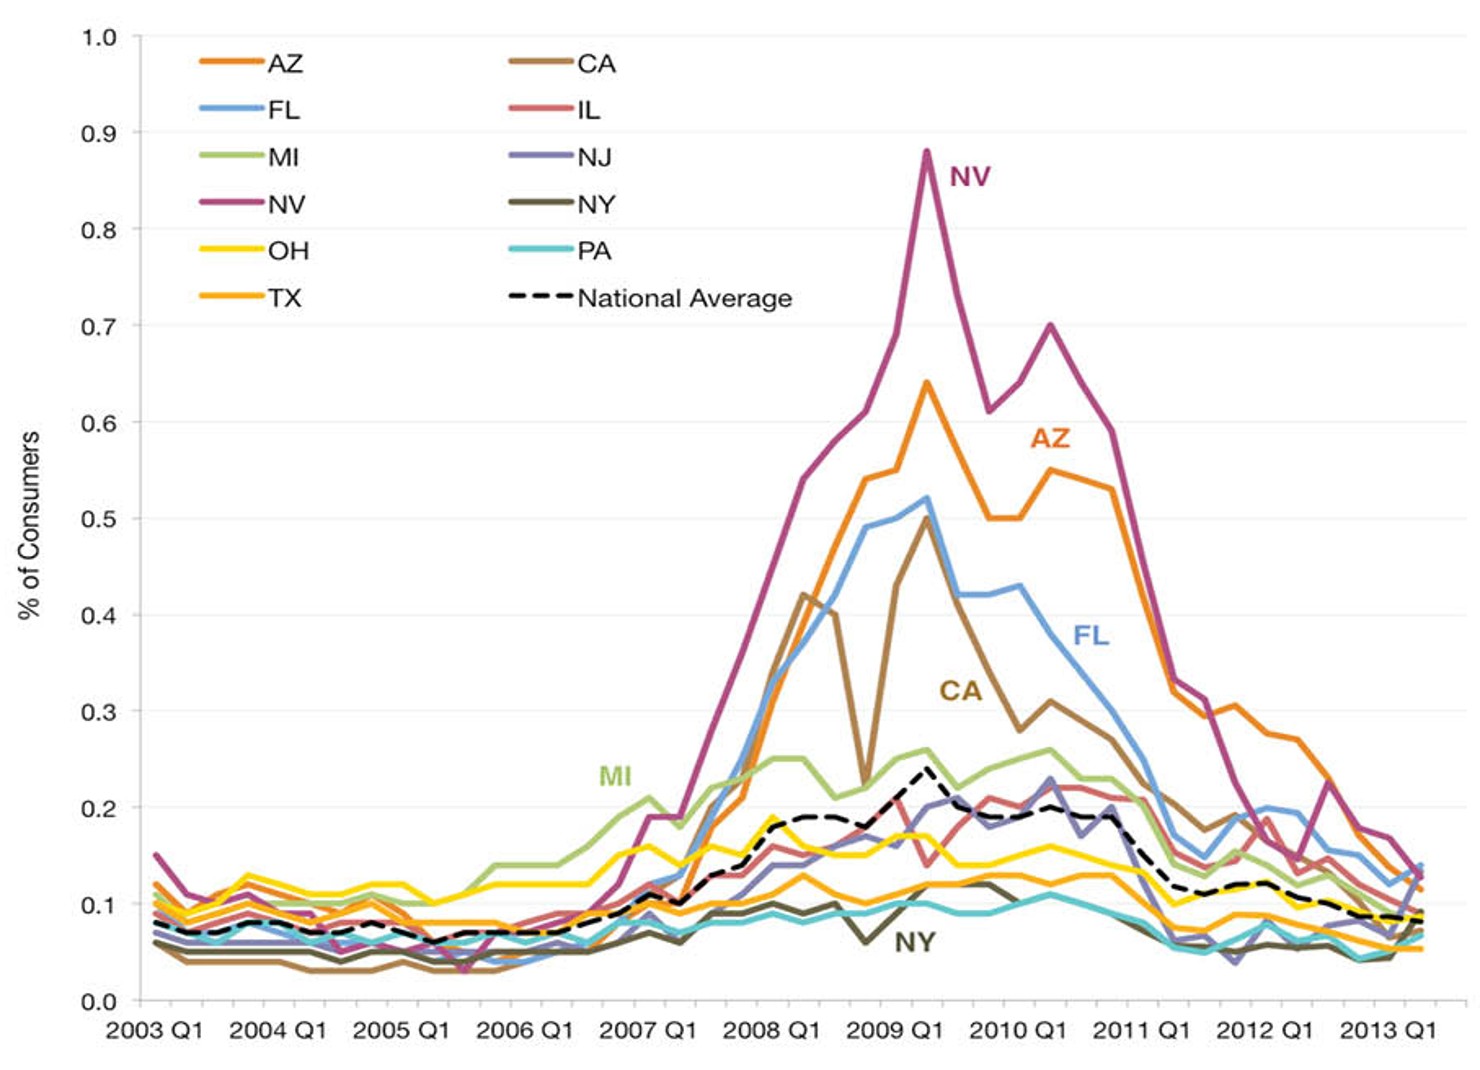
Note: Based on data from the Federal Reserve Bank of New York Research and Statistics Group.
FACT: Nevada, Arizona, Florida, and California had the highest number of new foreclosures in the country in 2009, but that number has since dropped dramatically.
On the positive side, the number of new foreclosures has declined markedly since early 2011 in all of these states. The foreclosure figures for New York and New Jersey may seem surprising given that neither state saw the types of property price collapses that occurred in states such as Florida and Nevada. The reason is that both states require banks to go through lengthy court proceedings in order to obtain approval to foreclose on a property. It takes an average of 503 days to complete a foreclosure in New York and 481 days in New Jersey relative to 318 days nationally.30 Homes remain in foreclosure proceedings in these and other “judicial” foreclosure states far longer than those in “non-judicial” states, were the process is conducted without the need for court proceedings.
Indicator 15: Home Buyer Breakdown
Home Purchases by Characteristics of Purchaser, 2008-201331
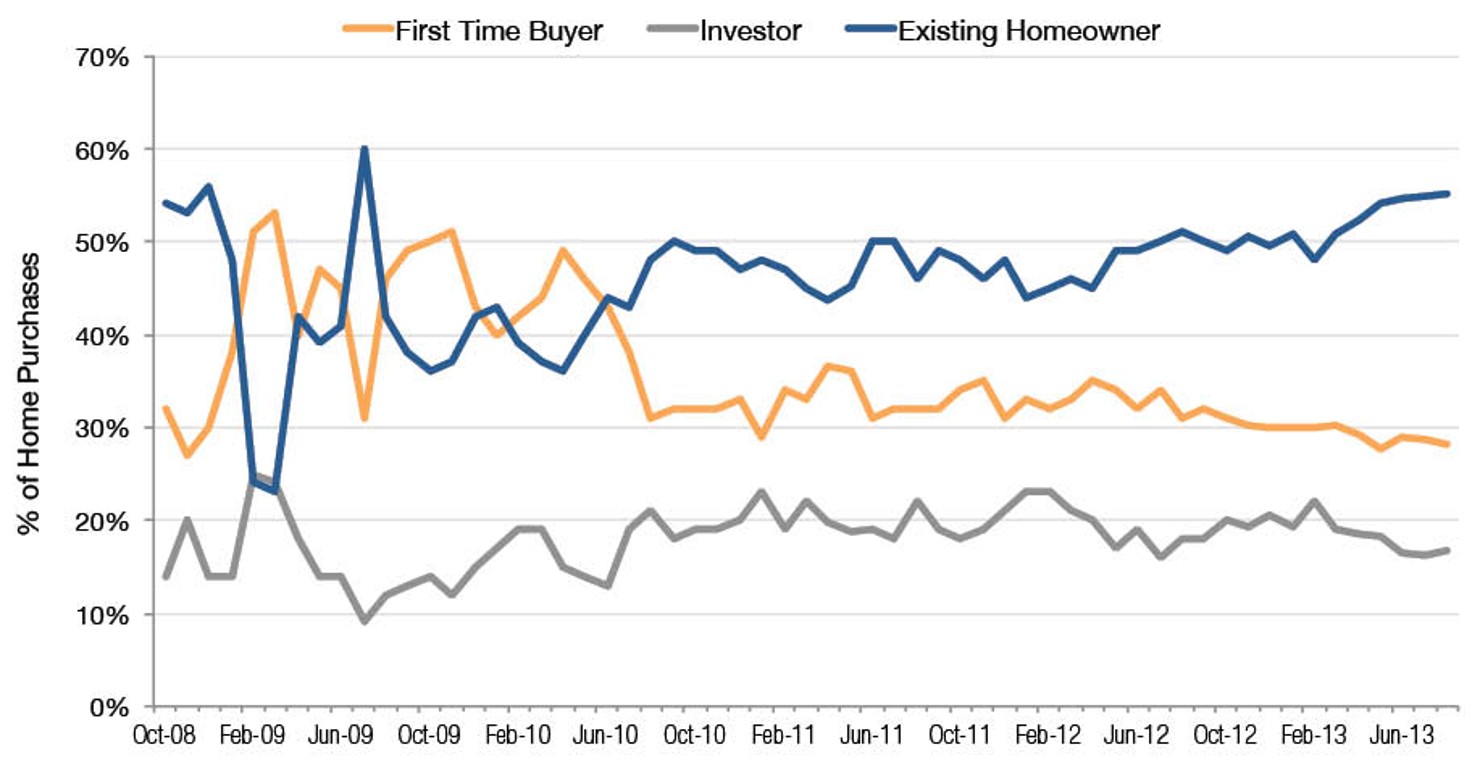
Note: Based on data from the National Association of Realtors.
FACT: Investors account for nearly 1 in 5 home purchases.
Is the increasing demand for housing being driven by large institutional investors trying to make a profit? If so, is the recovery sustainable once house prices rise and these investors exit the market? Financial institutions and large investors are most active in the market for distressed homes—that is homes for sale that are under a foreclosure order and are often subject to so-called ‘short sales.’ In August 2011, investors accounted for 22% of all home purchases, well above their pre-crisis levels. However, as the national housing market has improved and the number of distressed properties on the market has decreased, investor activity has also declined. In August 2013, investors accounted for 17% of all home purchases, and the number looks set to decline further in 2014.
Similarly, first-time homebuyers had been a particularly active presence in the housing market between 2009 and 2012. However, those numbers are now softening as the increase in house prices makes it difficult for these purchasers to enter the market. In August 2013, first-time buyers accounted for 28% of all home purchases, down from 32% in August 2011 and 31% in August 2012. By contrast, existing homeowners have begun to purchase property in greater numbers. Current homeowners account for 55% of all purchases in August 2013, up from 46% in August 2011. This is a clear sign that over the past two years existing homes are easier to sell.
Indicator 16: All Cash Buyers
Share of Homes Purchased with All-Cash in Selected Metro Markets, 2007-201232
| Phoenix | Tucson | Sacramento | Orlando | Omaha |
2007 | 11.6% | 12.6% | 4.4% | 9.0% | Not Available |
2008 | 12.6% | 18.8% | 15.4% | 20.3% | 12.1% |
2009 | 37.2% | 23.9% | 25.1% | 41.4% | 11.8% |
2010 | 41.8% | 28.3% | 26.7% | 51.5% | 16.7% |
2011 | 46.9% | 34.6% | 30.1% | 52.9% | 20.2% |
2012 | 46.0% | 34.4% | 34.0% | 53.1% | 17.6% |
Note: Based on data from DataQuick and made publicly available by CalculatedRISK. Omaha, which has experienced investment patterns that are more typical of the national average, is included for purposes of comparison. All-cash sales are good approximations for investor activity, though existing homeowners purchasing second homes also account for a small portion of these types of sales.
FACT: Following the crisis, the percentage of all-cash home sales dramatically increased in some areas as investors purchased distressed properties.
The sustainability of the recovery is less clear in several metro areas, particularly those located in Nevada, Florida, California, and Arizona (states hit hardest by the housing crisis). In those regions, investors have been particularly important drivers of the recovery, snapping up distressed properties at a rapid pace. In 2012 and the first-half of 2013, for example, over 30% of all home purchases in the state of Florida were made by non-owner occupier investors.33 Similarly, investors comprised 36% of all home purchasers in the Phoenix Metro Area in 2012. Indicator 17, which examines cash purchases, underscores the growing role played by investors over the past five years in key metro areas.
Investors make up a large proportion of cash purchasers. As cash buyers, they are often able and willing to outbid consumers, particularly first-time homebuyers that are heavily reliant on financing, a fact that has been widely reported.34 However the bigger economic concern is that house price growth in these metro areas has begun to outpace economic fundamentals. Since investors will inevitably stop buying property as prices rise—a trend that is already well underway in metro areas such as Phoenix—there is the potential for localized housing price dips.35 In short, while the national housing recovery seems to be on an increasingly sustainable footing, that may not be true everywhere.
Indicator 17: Mortgage Applications
Adjustable Rate and Refinance Mortgage Applications as % of Total Applications, 1991-201336
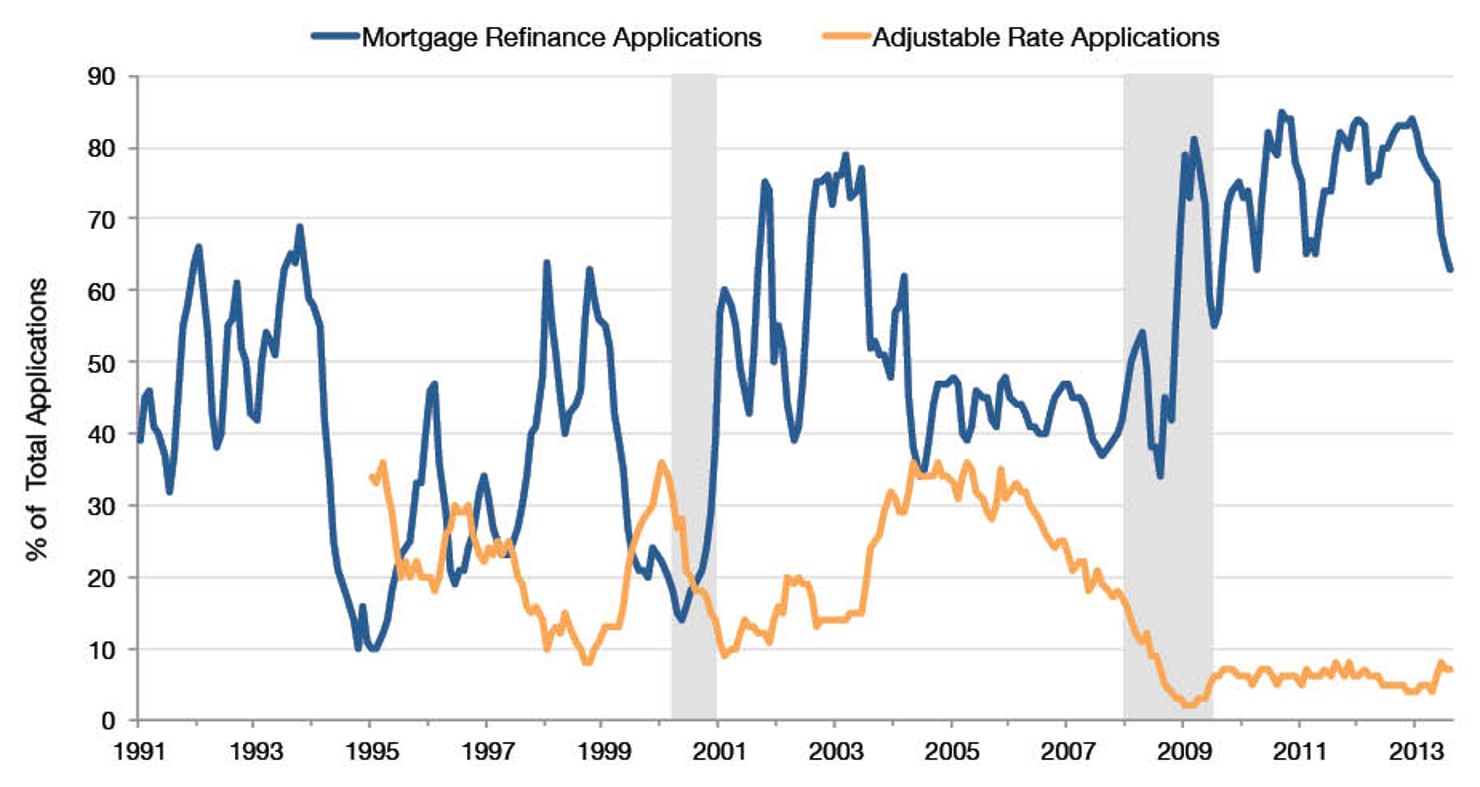
Note: Based on data from Freddie Mac’s Primary Mortgage Market Survey. The gray bars represent recessions.
FACT: Due to low interest rates, refinanced mortgages make up largest portion of applications, while new adjustable rate mortgages are at historic lows.
Adjustable-rate mortgages (ARMs), particularly ARMs that offered low fixed monthly repayments (or interest only payments) for an initial ‘teaser’ period, likely acerbated the downturn in housing. Thanks mainly to the narrower interest rate spread between fixed rate and ARM mortgages in recent years,37 most mortgage applicants are now choosing fixed rate mortgage products over ARMs. In August 2013, just 7% of all mortgage applications were for adjustable rate products, down sharply from the pre-crisis years, when such mortgages comprised approximately 30% of all new applications. The relatively small number of new ARMs may insulate the market to a far greater degree from the effects of a rise in interest rates in the future.
The number of people refinancing their mortgages has dramatically accelerated in recent years thanks to the unusually low interest rate environment maintained by the Federal Reserve. While refinancing activity has declined in recent months as market rates have risen,38 the fact that a large number of households took the opportunity to refinance at low rates will reduce risks of mortgage delinquency in the future, putting the housing market on a steadier footing.
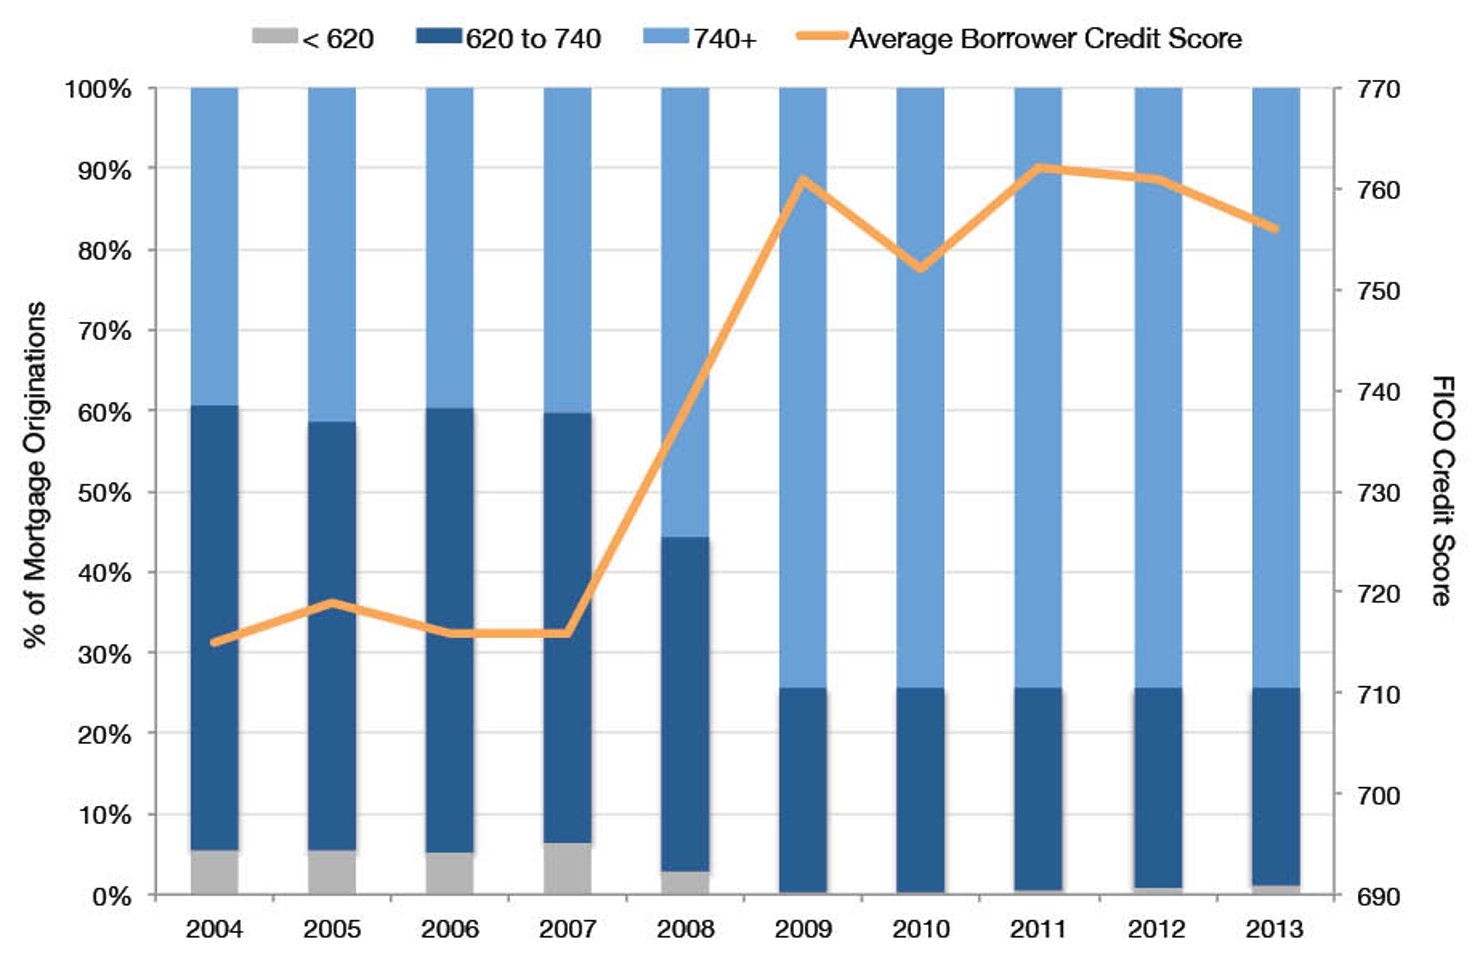
Indicator 18: Borrower Credit Scores
Borrower FICO Score at Mortgage Origination, 2004-201339
Note: Based on data from Fannie Mae.
FACT: Lending standards have made it tougher to get a mortgage with a lower credit score.
Credit and lending standards have become much tougher. In 2007, for example, applicants with a “very poor” FICO score of less than 620 obtained 6.4% of all mortgages. In 2013, by contrast, just 1.3% of new home mortgages were issued to borrowers in that FICO score range. Similarly, the number of mortgages granted to those with “good” or “excellent” credit scores (over 740) has increased dramatically, from 40% in 2007 to 74% in 2013. This suggests that lending practices are currently on a more sustainable track than they were prior to the financial crisis. At the same time, a balance needs to be achieved: standards that are too stringent could dampen the recovery. In that context, the slight relaxation in standards reported in early 2013 should be seen as a positive development.40
Likewise, the median down payment for homes, including those guaranteed by the Federal Housing Administration (which requires a minimum down payment of 3.5%) and Veterans Affairs Administration (which does not require a down payment), has risen to 9%,41 while the average debt-to-income ratio for such loans has declined from over 40% in 2008 to under 34%.
Indicator 19: Homeownership Rates
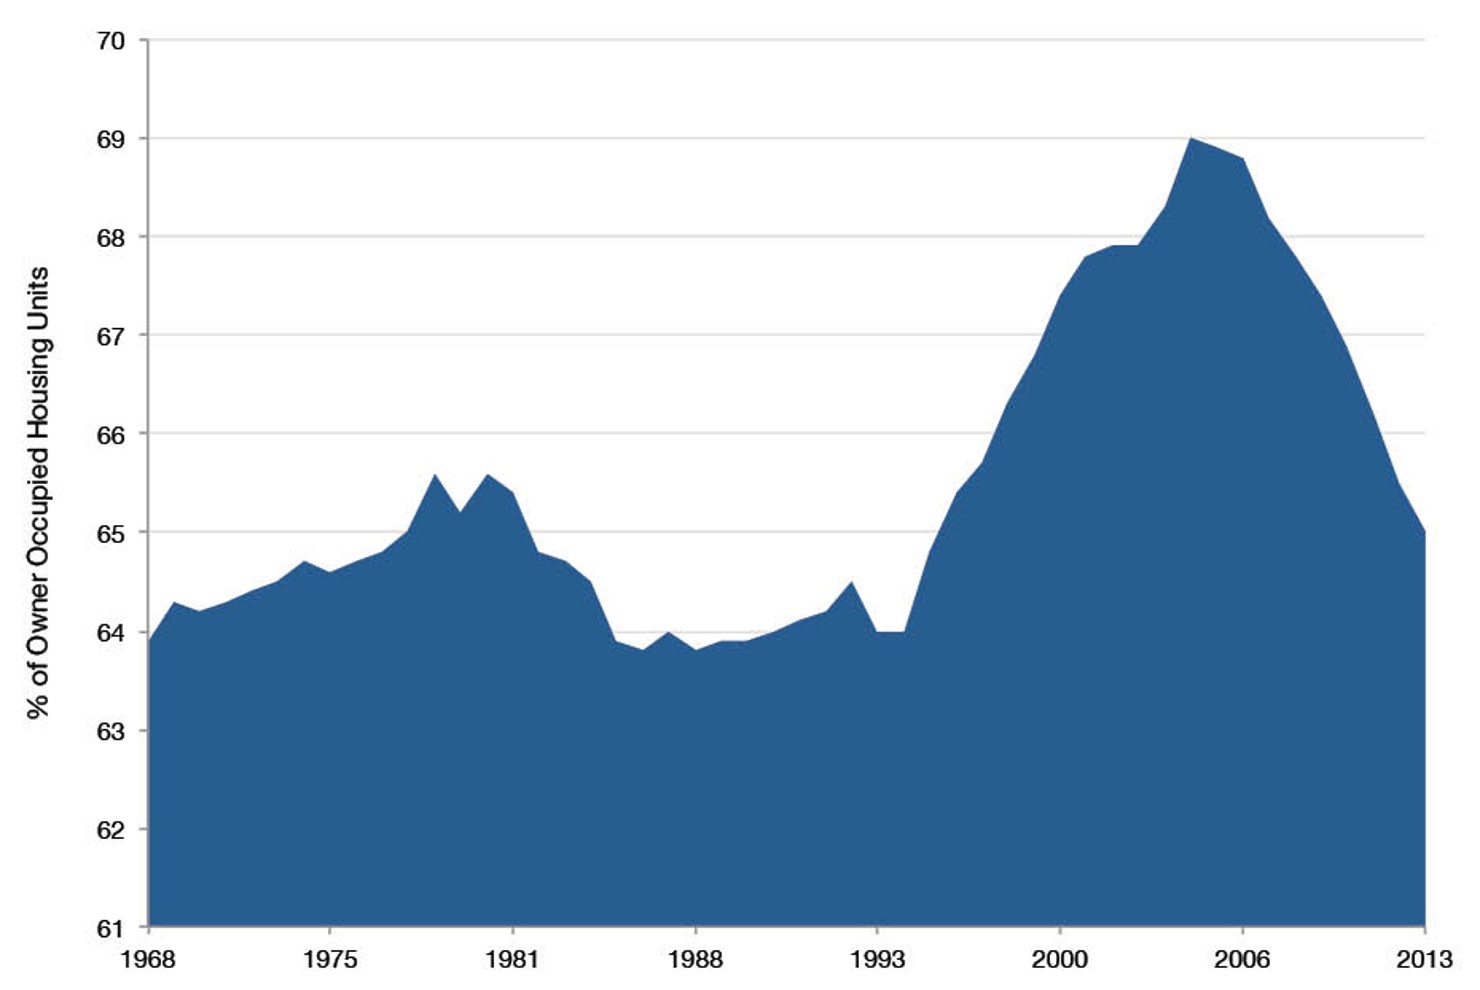
Homeownership Rates in the United States, 1969-201342
Note: Based on data from the U.S. Department of Commerce, Census Bureau. Figures are calculated using the number of occupied housing units in the U.S.
FACT: Homeownership rates have declined since the crisis, but are still above their historical average.
As indicator 19 shows, homeownership levels have declined significantly from their pre-crisis peak. The recent growth in home prices and new home sales suggest that the decline in homeownership levels has begun to level out.
It is worth noting that while homeownership rates have decreased, they are still at levels last seen during the healthy housing market of the late 1990s and are well above the historical average.
Indicator 20: Percentage of Renters
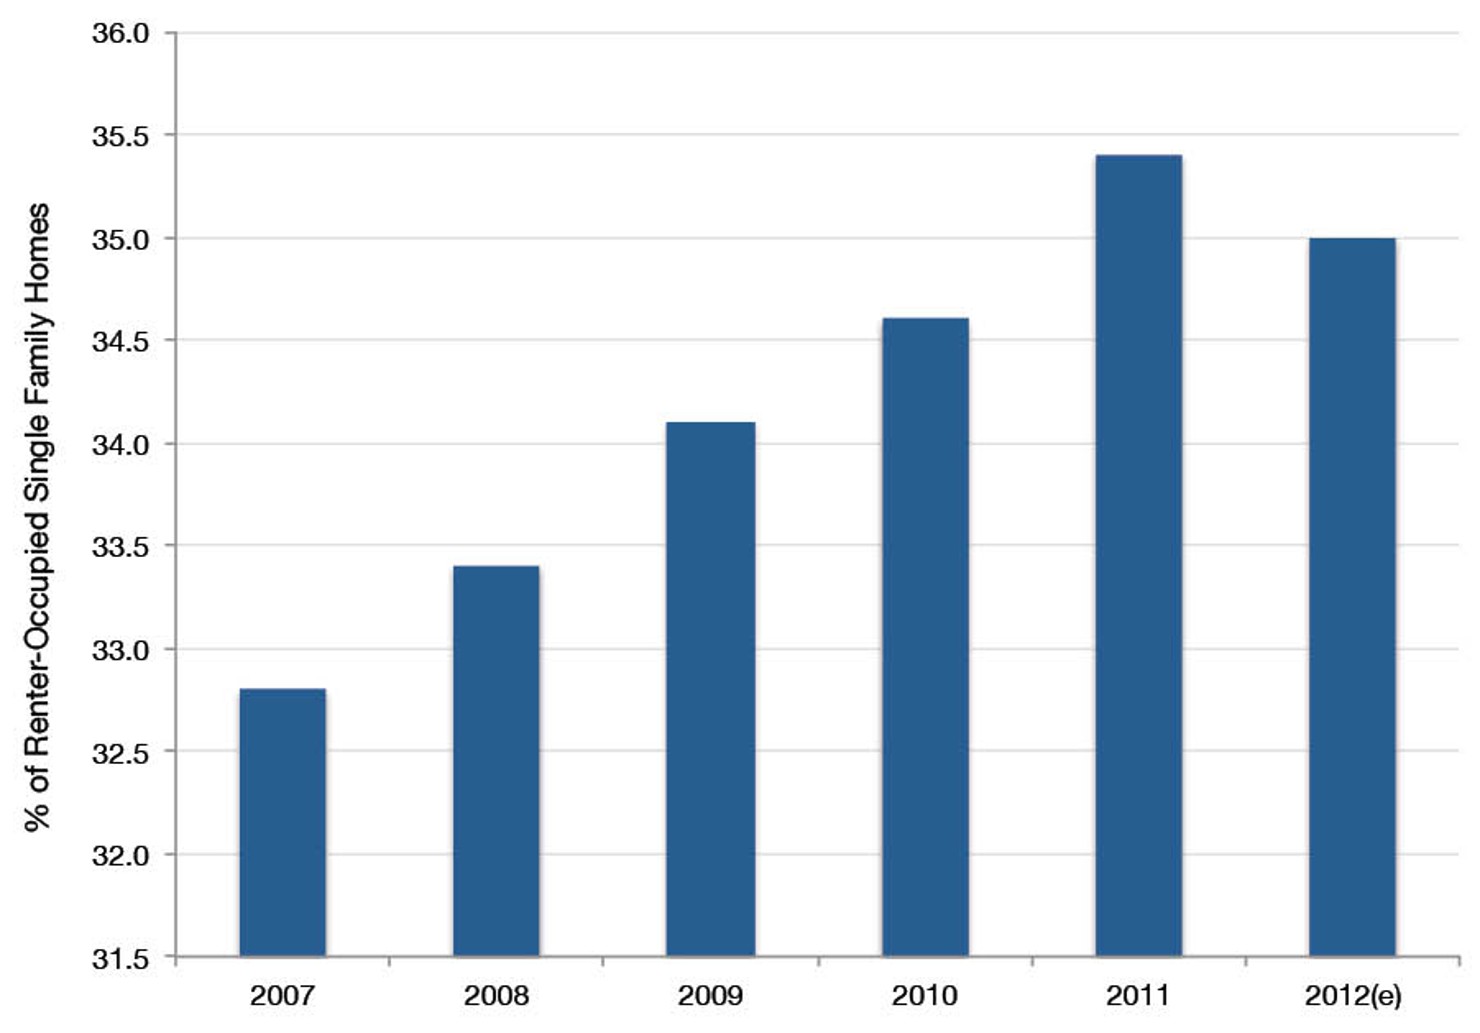
% of Renters in Single Family Homes, 2007-201243
Note: Based on data from the U.S. Department of Commerce, Census Bureau. (e) stands for estimate.
FACT: As the recession hit, people began to rent rather than purchase property. However the numbers seem to be stabilizing.
Indicator 20 illustrates that the numbers of people renting have increased in recent years. Were this trend to continue, it might suggest a long-term shift that would diminish the importance of the housing market to the American economy. However, the U.S. experienced a modest decline in the numbers of rented housing units in 2012.
Overall, the markets believe we are in store for a long, but sustainable, recovery in the national housing market. Policymakers should keep an eye out for these housing market indicators going forward.

