Memo Published April 1, 2021 · 9 minute read
Providing Low-Income Students the Best Bang for Their Educational Buck


In April 2020, Third Way released its initial report, “Price-to-Earnings Premium: A New Way of Measuring Return on Investment in Higher Ed,” that examined the time it takes students to recoup their out-of-pocket costs of earning a credential at institutions across the US.1 Within it, we found some good news: 63% of institutions showed their former students earning enough of a wage premium to recoup their costs of earning a credential within five years or less. However, we also found some substantial differences between the types of institutions driving these numbers. Public institutions on the whole showed a quicker return on investment (ROI) than private non-profit and for-profit institutions. And institutions that primarily award bachelor’s and associate’s degrees showed a quicker payoff than those predominantly focused on granting certificates.
While this initial report provided a framework for looking at the value for all students who attended a given institution, it didn’t look at the outcomes of specific student demographics. This paper aims to fill that gap. Below, we focus on some of the most vulnerable students who attend institutions of higher ed—low-income students—and the Price-to-Earnings Premium (PEP) that institutions provide them.
Using a Price-to-Earnings Premium for Low-Income Students
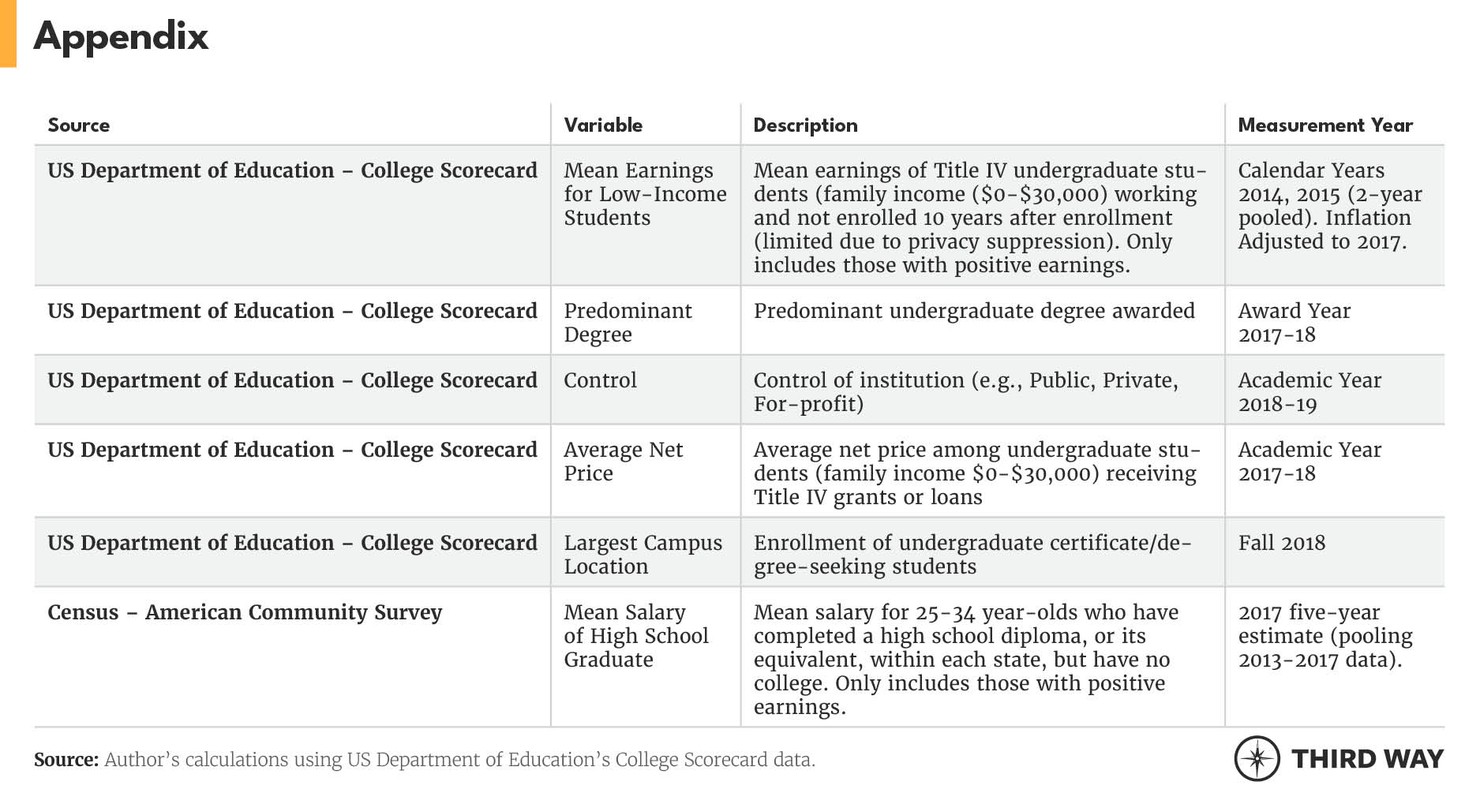
To evaluate the PEP for low-income students, we use a similar methodology used in our previous report, except we look at the out-of-pocket costs and future earnings for students whose income was $30,000 or less upon enrollment.2 This is important for two reasons: 1) the out-of-pocket costs can be substantially different for this group of students due to the way that the federal government, states, and institutions award grant aid, and 2) employment outcomes are different for low-income students than those who come from more affluent backgrounds.3 For these reasons, we look at the value that institutions provide for this critical student population.4
The way we measure value and the time it takes to recoup the cost of earning a credential is simple. First, we look at the total out-of-pocket costs (defined as costs after all grants and scholarships are deducted) it takes low-income students to earn a credential at each institution across the US. If it costs $10,000 per year on average for low-income students to attend a four-year school, we assume that students finish within that timeframe and incur a total cost of $40,000.5 If it costs $10,000 per year at a two-year school, we assume their total out-of-pocket costs would be $20,000 ($10,000 x 2). We then look at how much additional income students earn—relative to the price they paid to earn their credential—to figure out how long it takes them to recoup their initial investment.
To do this, we look at the earnings premium that low-income students obtain by attending each institution of higher ed.6 We calculate an earnings premium by looking at the additional income low-income students earn ten years after their initial enrollment in comparison to the average earnings of a high school graduate with no college experience.7 If the average low-income student earned more than high school graduates in their state after attending an institution, we define that as an earnings premium that can be used to pay down their educational costs.8 If they earn less, we assume no return on investment, as their income is less than those who never paid to attend college at all.9

The PEP allows to us define how long it will take this group of students to recoup their educational costs. If low-income students at a given institution earned $10,000 more than the average high school graduate within their state and their total net costs were $40,000 to earn a credential, it would take those students four years to recoup their educational costs. For a more detailed description of the methodology and assumptions, please view our initial report, “Price-to-Earnings Premium: A New Way of Measuring Return on Investment in Higher Ed.”10
The PEP for Low-Income Students at Institutions Across the United States
To gain a better understanding of what kind of ROI institutions provide their low-income students, we took a look at schools across the US to determine how long it takes these students to recoup their cost of earning a credential.
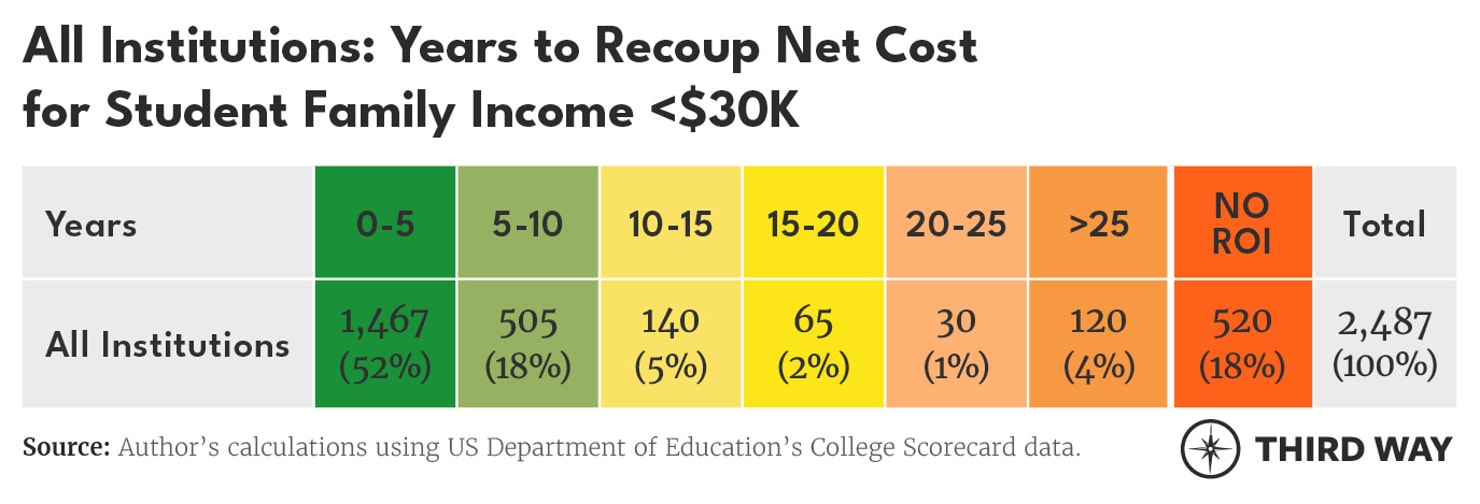
The good news is that the majority of institutions provide their low-income students the opportunity to recoup their educational investment quickly. Over half show this demographic earning enough to pay down their net cost within just five years, and seven out of 10 institutions allow these students to recoup their investment in under 10. Unfortunately, a substantial number of institutions show little to no ROI whatsoever. Over 500 schools show their average low-income student earning less than a high school graduate, even 10 years after they initially enrolled. Being that their post-collegiate earnings are so low, it’s unlikely that low-income students who attend these institutions will ever be able to recoup their educational investment.
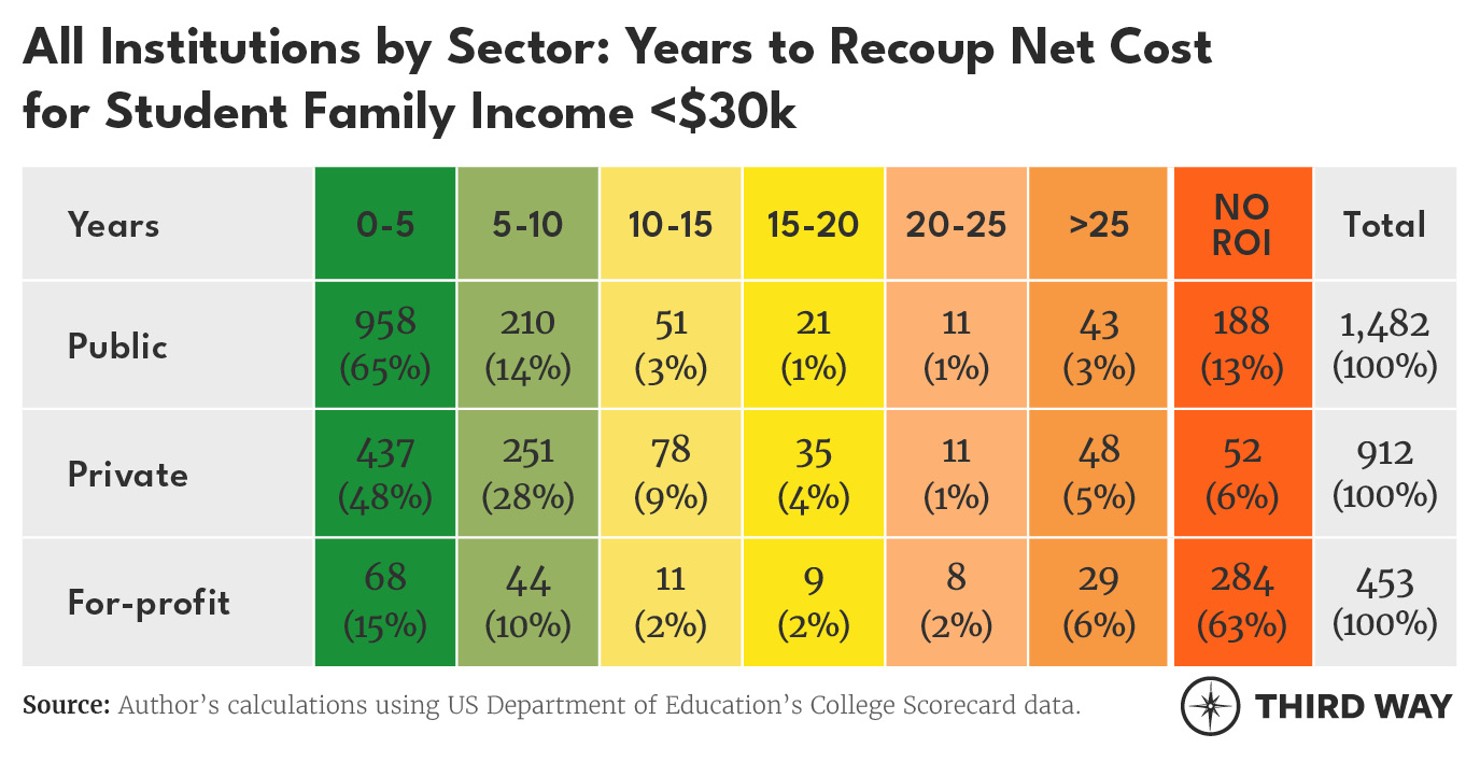
While most institutions across the spectrum show strong outcomes for their low-income students, some educational sectors disproportionately leave these students even worse off than if they hadn’t enrolled in the first place. For example, over 60% of for-profit institutions show their low-income students earning less than the average high school graduate within 10 years of entering their institution. This means that no matter the cost, low-income students who attended these institutions obtained little to no economic premium by doing so. While public and private institutions generally show better outcomes, nearly 250 of these schools also leave their low-income students unable to meet this basic economic threshold.
PEP Outcomes for Low-Income Students Across Type of Institution
There are also differences across various types of institutions depending on the education credential they award most often. Below, we show the PEPs for institutions that primarily focus on granting bachelor’s degrees, associate’s degrees, or certificates.
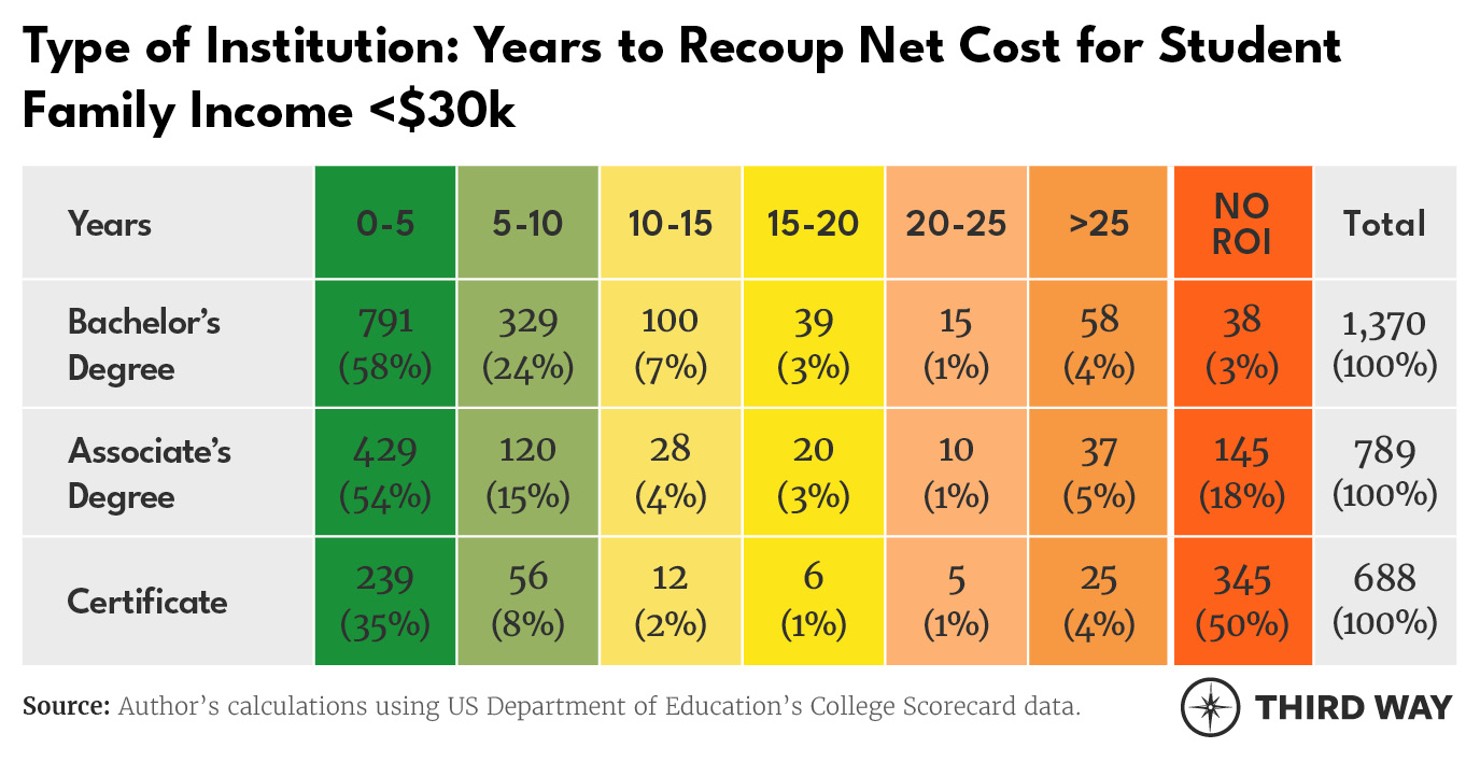
Bachelor’s Degree-Granting Institutions: While the total net cost of earning a bachelor’s degree may be more than a two-year or certificate-granting institution, most of these institutions still leave their low-income students earning a high enough wage premium within just a few years to justify their out-of-pocket costs to attend. In fact, nearly six out of 10 four-year institutions (58%) show their average low-income student earning enough additional income beyond the typical high school graduate to recoup their total net cost within five years or less. And over eight out of 10 (82%) show these students able to do so in fewer than 10 years.
Associate’s Degree-Granting Institutions: The cost of earning an associate’s degree is often less than a bachelor’s degree, as students are only responsible for two years of out-of-pocket expenses. While a substantial amount of two-year schools show no ROI for their average low-income student (18%)—leaving them earning less than a high school graduate in their state—the majority (54%) show these students recouping their educational investment in five years or less, a proportion in line with their four-year counterparts.
Certificate-Granting Institutions: The time and cost to earn a certificate is typically less than an associate’s or bachelor’s degree, as most only take between six and 18 months to complete. Yet, institutions that specialize in awarding this type of credential are also the most likely to leave their average low-income student earning less than those who had never attended college. Over half leave their typical low-income student with no ROI whatsoever. Furthermore, less than four out of 10 (35%) show these students earning enough to recoup their costs within five years or less—a proportion far less than their two- and four-year counterparts.
The Schools with the Quickest Returns Often Enroll the Least Amount of Low-Income Students
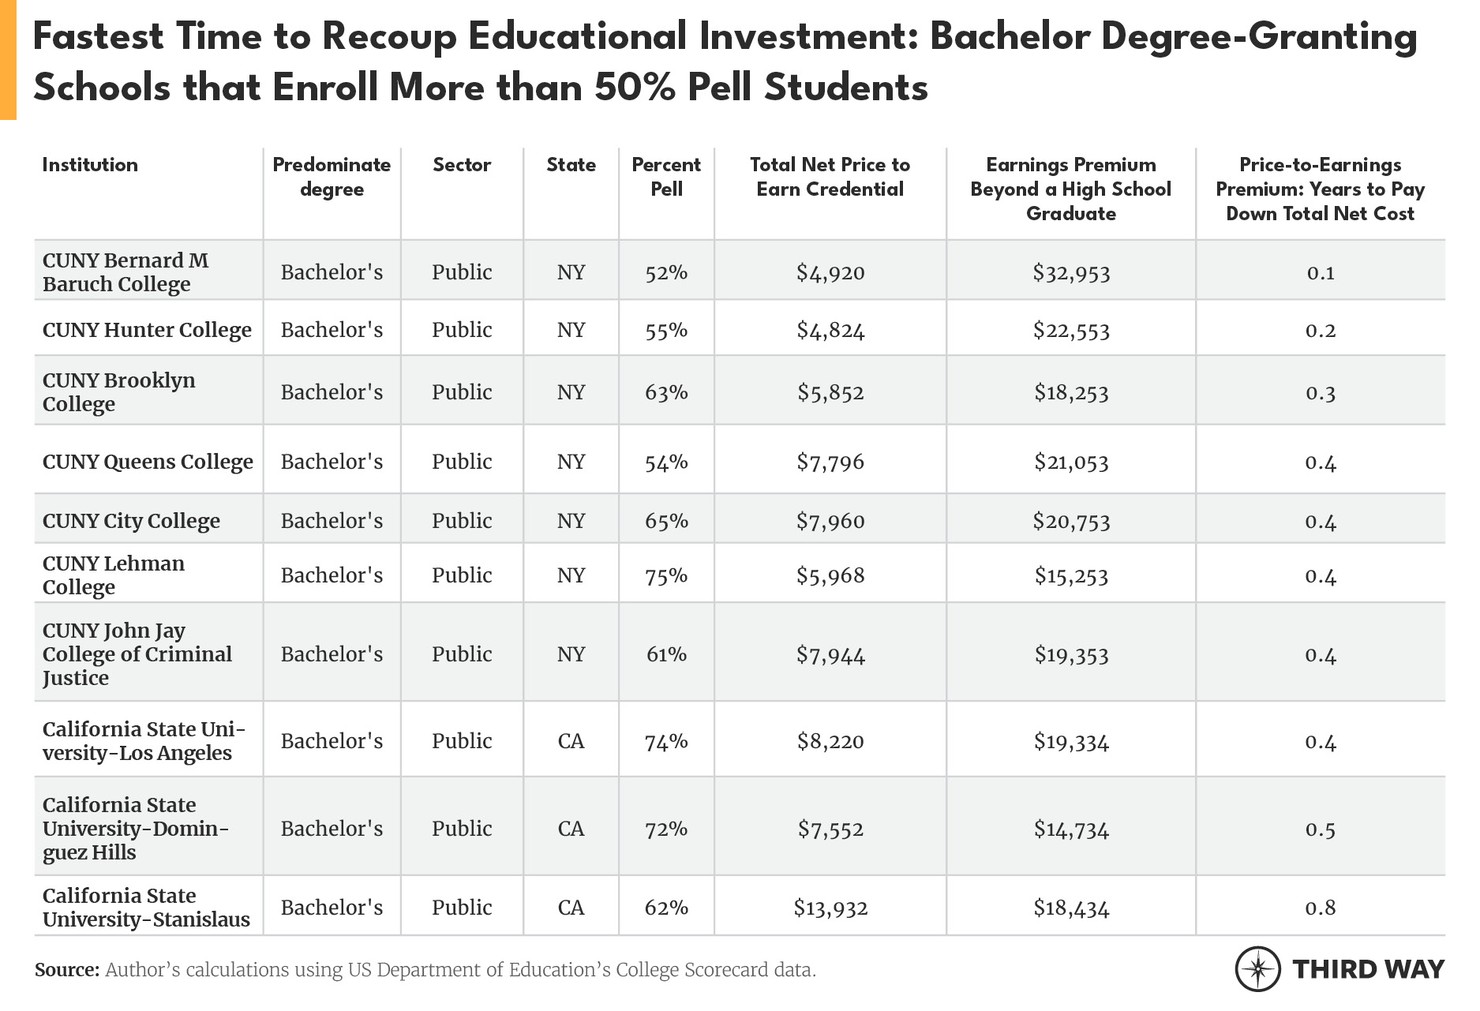
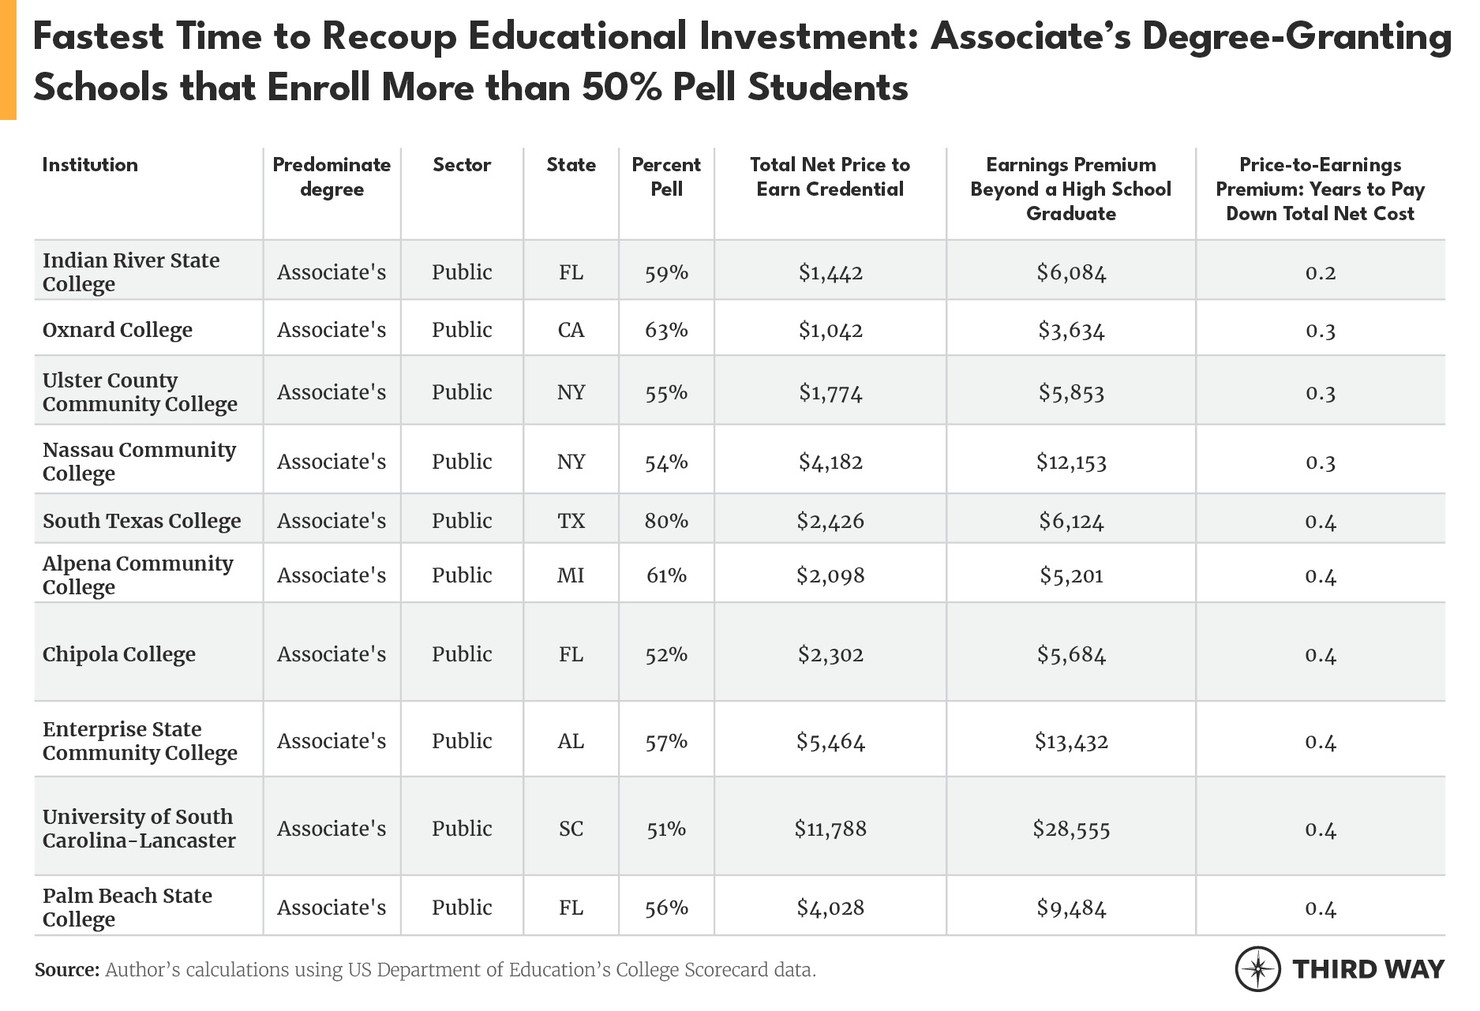
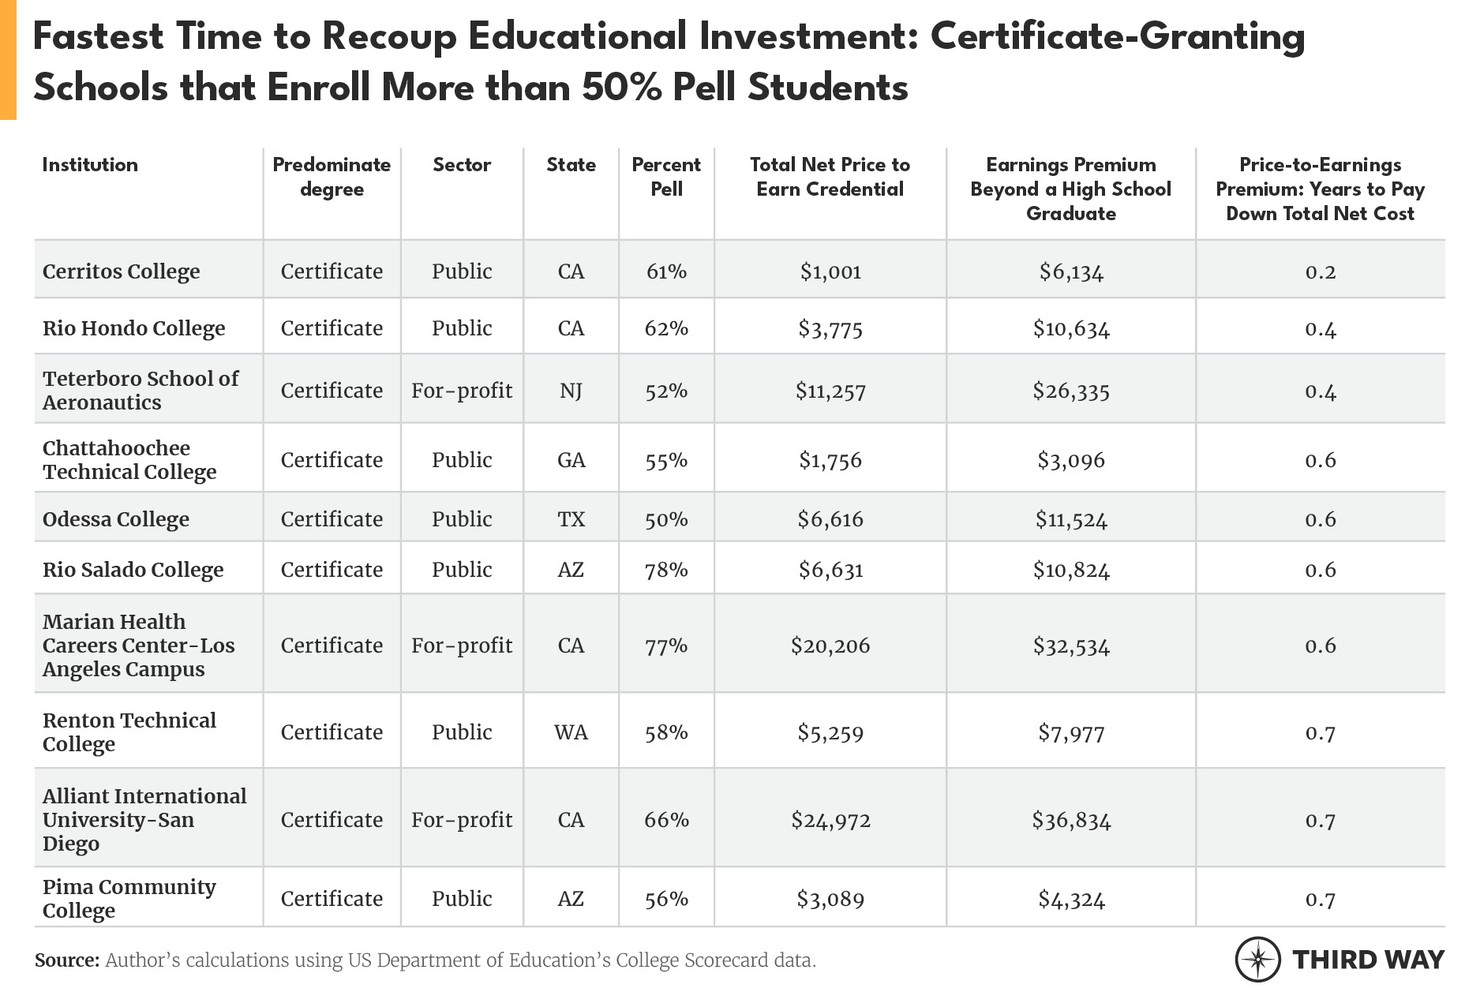
While some institutions show a quick return on investment for their low-income students, many still fail to admit them as part of their student body. Only allowing these students to access institutions that provide a wage premium on a limited basis can perpetuate inequality for the many who enroll in institutions that do little to ensure the economic benefits of attending college. One way to measure the amount of access institutions provide is by the percentage of Pell Grant recipients they enroll (students who are identified as low- or moderate-income by the federal government).11 Below are the proportion of institutions that enroll more than 50% of Pell recipients as their total student body and the years it takes low-income students to recoup their educational investment at those institutions. Similar to above, we list these schools by the predominate credential they award, whether that be bachelor’s degrees, associate’s degrees, or certificates.
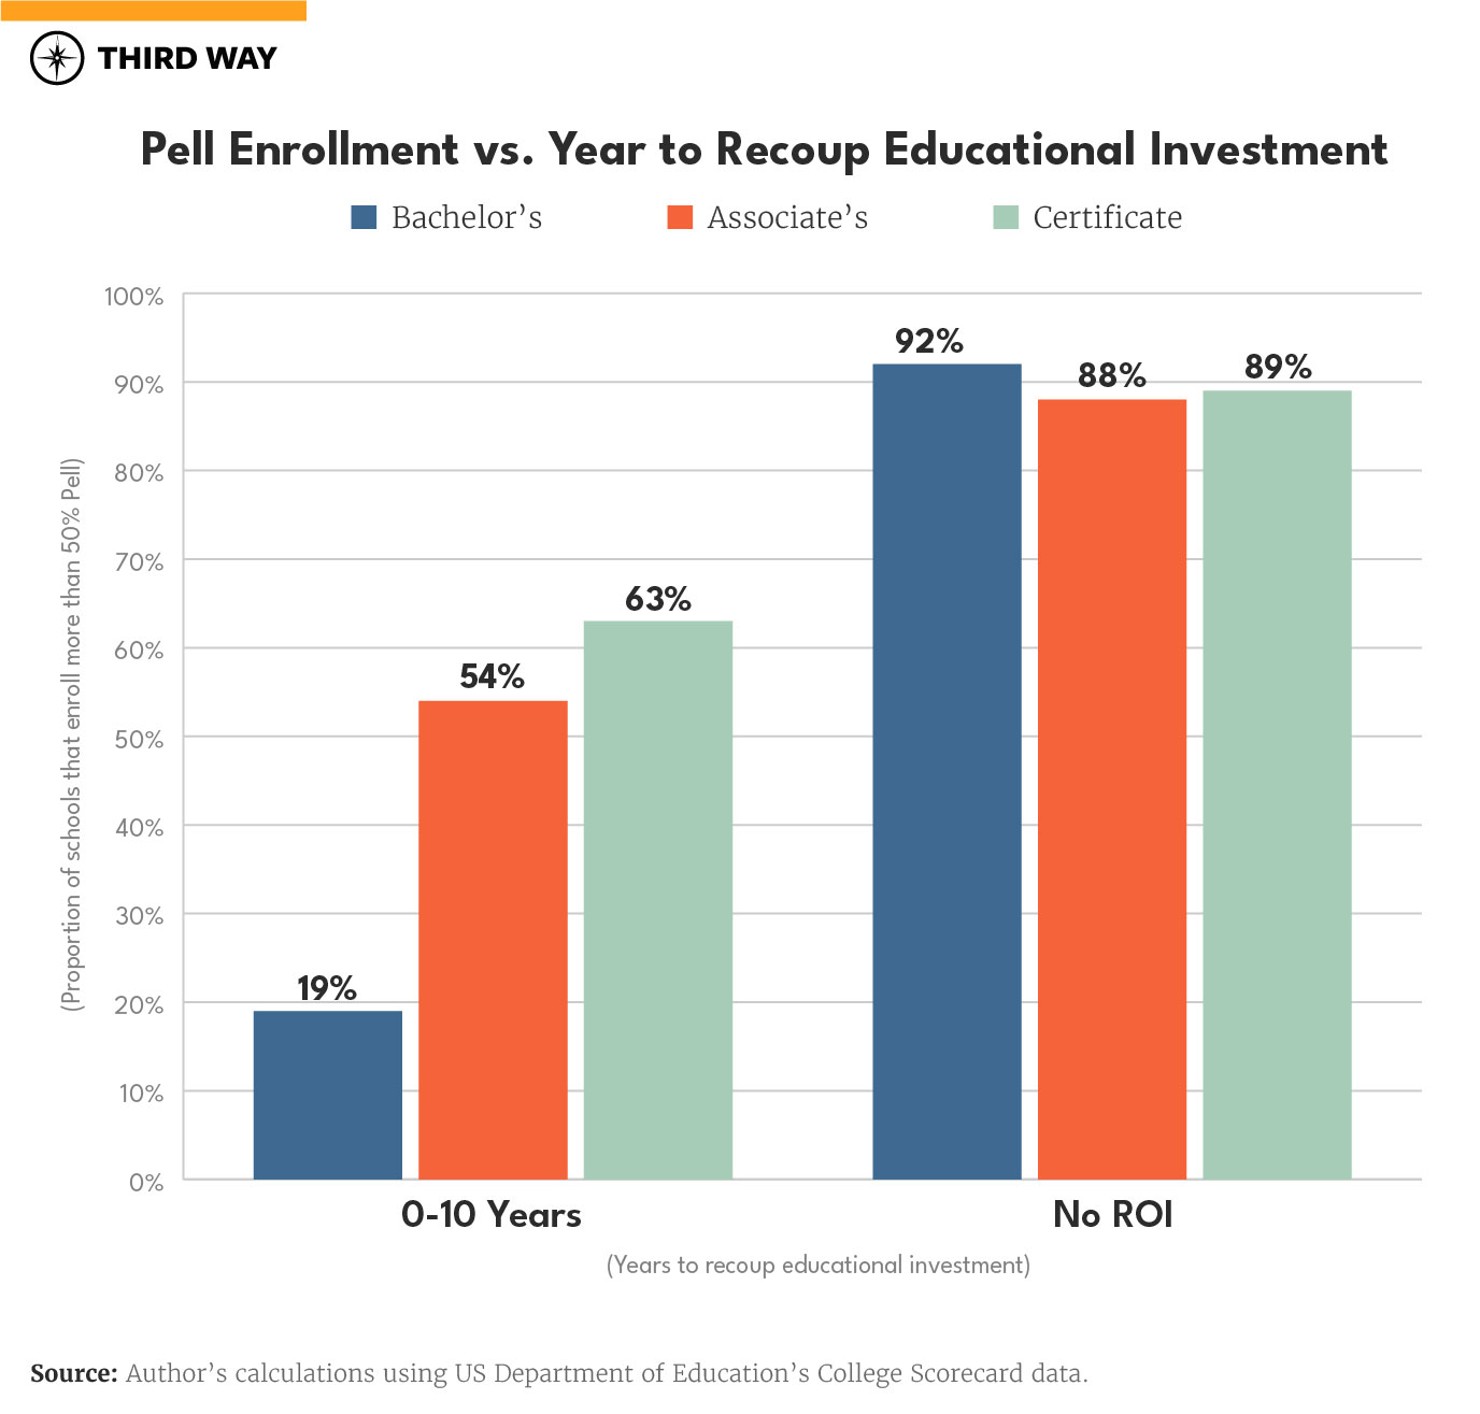
Bachelor’s Degree-Granting Institutions: While the overwhelming majority (82%) of bachelor’s degree-granting schools show their low-income students able to recoup their educational investment within 10 years, most of these are institutions that enroll less than 50% of low- and moderate-income students. Only 19% (209 out of 1,114) of these institutions enroll mostly Pell students and show their average low-income student able to recoup their educational investment within a decade or less.
Associate’s Degree-Granting Institutions: Two-year schools are more likely to meet these criteria than their four-year counterparts. Out of the 69% that show the typical low-income student able to recoup their educational investment within this 10-year time frame, 295 out of 548 (54%) enroll more than 50% Pell students. However, almost all two-year schools (92%) that show no ROI for these students also enroll more than 50% Pell students, leaving the typical low-income student earning less than a high school graduate 10 years after initial enrollment at each of these institutions.
Certificate-Granting Institutions: Certificate-granting institutions are the least likely to show their low-income students able to recoup their educational investment within 10 years. Only 43% show their average low-income student earning more than a high school graduate during that timeframe. However, the ones that do can also be an engine of social mobility to low-income students—157 out of 247 (63%) who show their typical low-income recouping their educational investment within 10 years also show a majority of their students receiving a Pell Grant.
Conclusion
In the wake of the COVID-19 pandemic, it’s more critical than ever that institutions provide all students—and especially those most likely to be hurt by a weakened economy—with a return on their educational investment. While most deliver on this promise, way too many fail low-income students, leaving them earning even less than those with no college experience whatsoever. As Congress and the new Administration consider ways to ensure success for ALL students, regardless of socioeconomic status, it’s imperative that they succeed, as anyone pursuing a higher education credential should be ensured that they are left better off after they attend.
To see a full list of data, click here.