Report Published March 9, 2020 · 7 minute read
Flipped & Floundering: Diverging Dynamism in the Blue Wall
Jillian McGrath

Takeaways
The Blue Wall counties that flipped from Obama to Trump in 2016 are very different than their safe blue neighbors that stayed Democratic. By the 2016 election, the average reliably blue county in Michigan, Pennsylvania, and Wisconsin had four times the number of people but five times the number of businesses than their counterparts that flipped to the GOP.1 The story of safe blue and flip counties in the Blue Wall is a story of diverging economic dynamism.
The most noteworthy difference, however, is how significantly flip counties relied on manufacturing. With double the reliance on manufacturing employment than their safe blue neighbors, they were predisposed to struggle in the face of industrial decline.2 Democrats looking to compete here in 2020 need to heed the divide between flip and safe counties—and ensure solutions are tailored to help all communities thrive in a new economy.
Democrats know the number well: 77,744. In the Blue Wall states of Michigan, Pennsylvania, and Wisconsin, Donald Trump beat Hillary Clinton by less than 80,000 votes to secure the presidency.3 The Blue Wall is poised to be another contested battleground in 2020 and understanding those three states will be crucial to determining whether 2016 constitutes an aberration or a new reality.
While numerous political and economic forces contribute to how the Blue Wall is won, 68 counties spread across the three states offer valuable insight. One of the surprises in 2016 was that many traditionally blue strongholds flipped in favor of Donald Trump. Specifically, out of 3,112 counties in the United States, 223 counties flipped from Obama in 2012 to Trump in 2016.4 This is roughly half the number of counties that stayed safely blue, voting for Obama and then Hillary Clinton.5


Flip counties exist in every region, but over 40% reside in the former industrial heartland of the United States.6 Within the highly contentious Blue Wall specifically, 38 counties flipped while 30 stayed safely blue. These counties voted the same in 2012, but something significant disrupted this trend in 2016.
In this report, we look at how the economies of flip and safe Blue Wall counties have bifurcated. Beyond a broad divergence in dynamism, we focus on regional manufacturing dependence, and how some areas of the Blue Wall were primed to struggle more despite the same economic headwinds. Understanding the contours of these counties will be essential for Democrats looking to compete in the Blue Wall in the 2020 election.
The Economies of Flip Counties
Flip counties in the Blue Wall differed noticeably from their safe blue counterparts in several ways by the 2016 election. Differences in their size, educational attainment, and business climates reflect a fundamental difference in economic dynamism.
1. Flip counties are significantly smaller and more rural than their safe Democratic counterparts in the Blue Wall. The average flip county in the Blue Wall is less than one-fourth the size of their average safe blue counterpart. Flip counties are home to just under 100,000 residents, while safe blue counties boast almost 420,000 people on average.7
2. The workforce in safe blue counties is more skilled than that of flip counties. Over 60% of the population 25 and older in the average safe blue county completed some post-secondary education—almost 10 percentage points higher than the average flip county. Of those 25 and older in safe blue areas, over one-third obtained a bachelor’s degree. Only one-fifth of those in flip counties earned the same credential.8
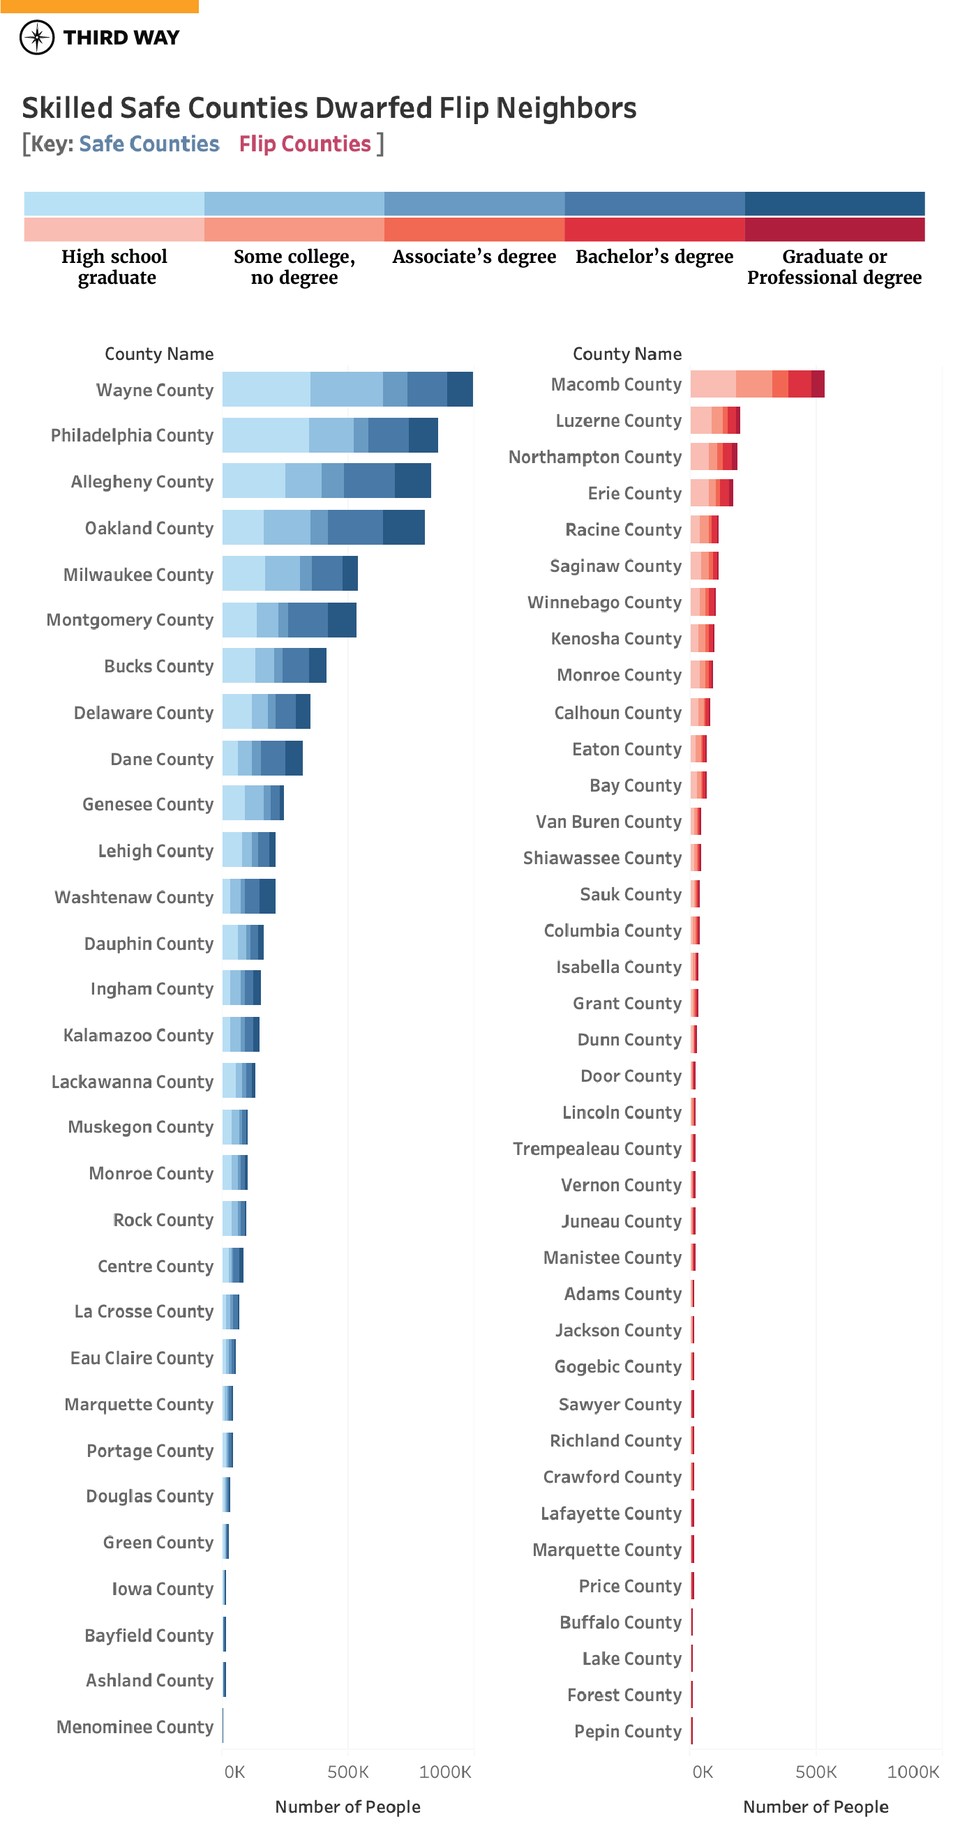
Within the Blue Wall states, the average reliably democratic county boasted four times the number of people and five times the number of businesses than counties that flipped from Obama to Trump.
Flip and safe-blue counties, despite residing next to each other in some cases, experienced the economy differently in the same time frame. Flip counties have fewer people, businesses, and skills—leaving them in a far more precarious position during an economic downturn. And when a county overly relies on an industry that has taken a beating since 2000, it sets them up to fall further behind their neighbors.

Manufacturing Decline in Flip Counties
Flip and safe-blue counties within the Blue Wall varied in several ways, but the most noteworthy is how significantly flip counties relied on manufacturing. The Blue Wall states were known for their strength in manufacturing durable goods—from Detroit, Michigan to Janesville, Wisconsin. However, manufacturing strength in this region became a liability in the 2000s, when the American manufacturing industry experienced significant decline across the country.
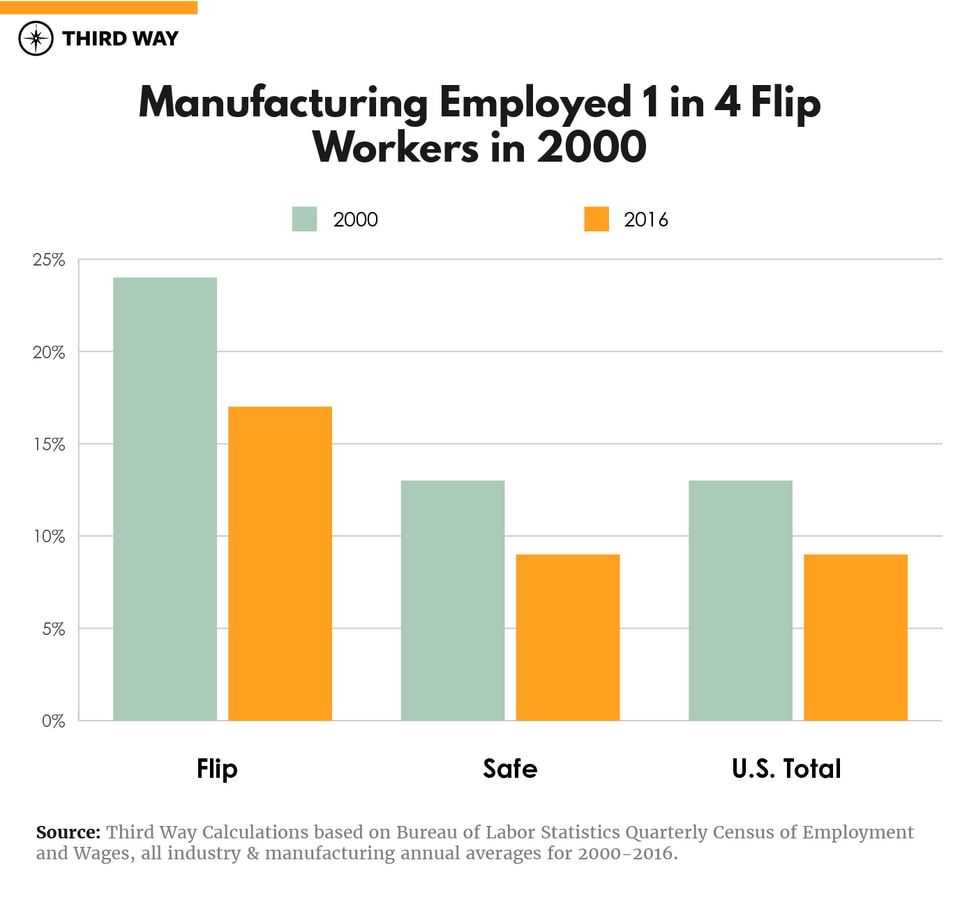
That decline affected flip counties far more than safe blue counties in the Blue Wall. In 2000, almost 25% of workers in flip counties worked in manufacturing—about double that of safe counties and the nation as a whole. By 2016, flip counties in the Blue Wall still disproportionately relied on manufacturing. Loss of these well-paying, stable jobs with benefits contributed to significant decline in regional dynamism in flip counties. Safe counties, with more diverse labor market bases, had less to lose when manufacturing began to crumble in the region.
In general, over-reliance on a single industry can pose risks for communities. However, manufacturing job loss in the Blue Wall posed special problems for flip counties for a few notable reasons:
1. Significant loss of good-paying jobs. The manufacturing industry provided workers with good jobs, often at $28/hour plus full benefits. In fact, in both safe-blue and flip counties, manufacturing jobs reliably paid over $10,000 per year more than the average annual wage from 2000 through 2016.10 These jobs provided stable middle-class livelihoods, typically without the need for a college degree. When high-quality jobs like this disappear, they create a significant void.
2. Significant loss of “downstream” jobs. The loss of a job can affect other jobs in a community. For example, a factory of 100 people could support dozens of other jobs supporting that factory, from suppliers, to transport, to deli owners. These “downstream” effects of job loss vary by sector, but are very high in the manufacturing industry. Research suggests for every 100 jobs lost in motor vehicle manufacturing 1,428 downstream jobs were lost elsewhere in the community—a multiplier effect of 14 times.11 Some of this is direct job loss, such as the supplier plants that provide nylon for seatbelts and Styrofoam for car seats to auto manufacturers. There is also indirect loss, from the restaurants that stop seeing hungry customers to child-care centers no longer needed when parents stop working.
3. Persistent bleeding of jobs. Between 2012 and 2016, safe blue counties were able to attract over 800 manufacturing firms and grow jobs. In this same time frame, flip counties in the Blue Wall shed 260 manufacturing firms and lost manufacturing jobs. Safe blue counties in the Blue Wall grew businesses and jobs in general, where flip counties lost establishments.
Conclusion
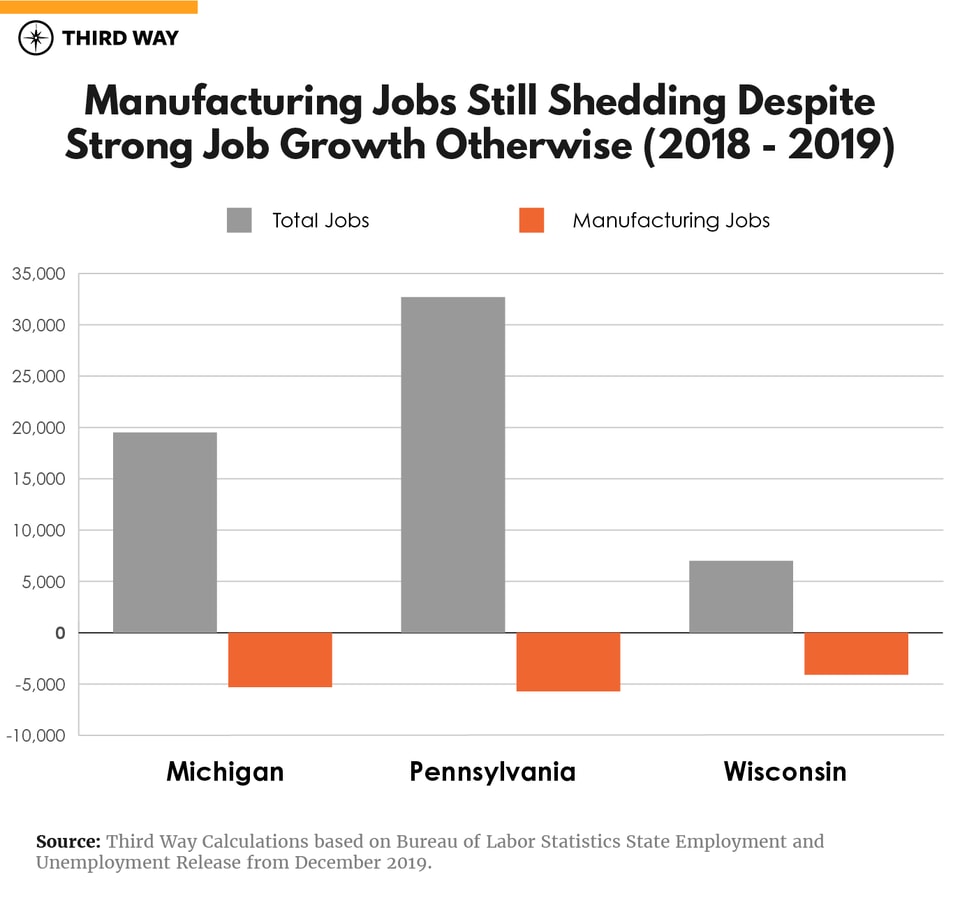
President Trump ran his 2016 campaign on reviving struggling industries and helping Americans in left-behind regions. In reality, he failed to deliver for regions badly in need. Recent employment data shows manufacturing jobs across the country are in peril—so much so that industry indicators and economists declared manufacturing in a full-blown recession at the end of 2019.12 This national slump is especially acute in Michigan, Pennsylvania, and Wisconsin, where manufacturing jobs continue to shed despite strong job growth numbers in general.
The Blue Wall counties that flipped to Trump in 2016 differed from their safe blue neighbors. They were smaller, had a less skilled workforce, and had fewer businesses. But, most importantly, they were predisposed to struggle in the face of manufacturing decline. All of these factors contributed to a significant divergence in regional economic dynamism between the two groups, a difference that persists today. Democrats looking to compete here in 2020 need to heed the divide between flip and safe counties—and ensure solutions are tailored to help all communities thrive in a new economy.