The College Completion Landscape: Trends, Challenges, and Why it Matters


Executive Summary
College completion is perhaps the most commonly used metric to gauge student success. Although the overall percentage of students that finish college has improved in recent years, the gain has not been substantial. In this report, Bridget Terry Long reviews some of the most recently available data and finds that there is substantial room for improvement at most of America’s colleges and universities. In 2016, the overall completion rate of full-time, first-time students was 49.1 percent at four-year institutions and 38.6 percent at two-year institutions. Notably, Long explores how completion rates vary by institution type, sector, student characteristics, and demographics.
The large non-completion problem at America’s colleges and universities represents significant costs for both students and taxpayers alike. Students experience costs in terms of receiving lower average earnings, having student debt, and losing time while enrolled in school. Additionally, this report highlights how students who fail to complete a college credential are less likely to go on to work in occupations that offer employment benefits (such as health insurance and pension plans), earn family-sustaining wages, or be civically involved. Taxpayers, on the other hand, collectively fund higher education to the tune of $130 billion every year, and each dropout represents wasted government subsidies on students who fail to complete their educations.
This report begins by surveying the existing data on college completion and reviews some of the specific strengths and shortfalls of each data source. Then, Long looks at the landscape of college completion in America, providing the most updated information on which types of institutions are successfully graduating most of their students and which are not. Lastly, the paper reviews what we know about student-level characteristics that are typically associated with college success and what else university leaders, educators, and policymakers might do to begin improving college completion rates in America.
— Rick Hess and Lanae Erickson Hatalsky

During the past half century, the United States has made tremendous progress in increasing access to postsecondary education. From 1960 to 2016, the percentage of recent high school graduates who went on to higher education increased from 45.1 percent to 69.8 percent.1 However, with the growing availability of data and increased ability to track students over time and across institutions, the country needs to do far better at supporting college student persistence and success. The conventional way to measure graduation rates is to examine how many students complete a degree within 150 percent of the expected completion time—that is, six years for a bachelor’s degree and three years for an associate degree. Using this metric, research suggests that about only half of students enrolled at four-year colleges and universities graduate within 150 percent of the expected completion time, and the completion rate is even lower for students enrolled at two-year colleges.2
Given that the goal of higher education for most students is to complete a degree or credential that is worthwhile in the labor market, the low levels of completion are disconcerting, and both students and society at large experience high costs due to non-completion. Increasingly, there are examples in which the tuition and fees college students pay, as well as the opportunity costs of enrollment, are not justified by the meager returns experienced by students, especially those who leave higher education before completing their program. Further, for taxpayers, investments in students through institutional subsidies and financial aid sometimes do not translate into higher educational attainment and the expected increases in tax revenue, reductions in government dependency, and other social benefits. The college completion problem is large and has serious implications for many aspects of our society and country.
College completion is only one of many possible ways to gauge student postsecondary success. Students, families, and researchers would like to know more than just whether students finished their program or degree requirements—measures of student learning or a sense of the quality of the degree would be ideal, and there are continual efforts within higher education to establish such assessments and indicators.3 In addition, the conversation about college completion increasingly has focused on “credentials of value,” attempting to discern whether the degree or certificate completed results in a wage that is sufficient to pay back student loans and live at a reasonable standard of living. Although these additional measures and nuances are vitally important to understanding how well students are doing, my analysis centers on the most common measure of student success: college completion.4
A Look at College Completion Rates: What Do We Mean by College Completion?
The American higher education system is incredibly diverse in the types of institutions that exist and the range of educational programs, credentials, certificates, and degrees that are available to students. For that reason, it is important to clearly define “college completion.” What completion means for one student may be entirely different for another student. In addition, until recently, researchers have been limited in how they define completion due to an inability to track students over time and across institutions. However, higher education needs to coalesce around a common set of definitions to avoid inconsistencies and misunderstandings about the problem of college completion.5
The most prominent measure of completion is derived from the Integrated Postsecondary Education Data System (IPEDS), which is an annual federal survey of colleges conducted by the National Center for Education Statistics at the US Department of Education. Institutions that participate in federal student aid programs are required to report information on enrollments, finances, completions, faculty and staff, and financial aid. For the 1997–98 school year, a graduation rates survey was added in response to the Student Right-to-Know and Campus Security Act of 1990; over time, information for subgroups (e.g., by gender, race, and ethnicity) and additional measures (such as reporting rates for 150 percent and 200 percent of normal time, which would be six and eight years, respectively, for a four-year college) have been added.6 The publicly available IPEDS data allow individuals to examine completion rates for thousands of institutions, which one can group by institutional type and track over time, given fairly consistent definitions for over a decade.
Unfortunately, the federal data have several drawbacks. First, the information is self-reported by the institutions, which means that it relies on each college’s ability to track its own students so it can accurately calculate completion rates.7 More pressing concerns, however, have developed from the fact that the most consistent federal measure of completion focuses on only a subset of college students: first-time, full-time students who begin during the fall term and graduate within a certain time frame. As such, this federal rate overlooks many students who attend part time, including older students, those at community colleges, and many students of color.
Transfer students are also not counted in this rate. Analysis suggests that in 2012, only 55 percent of all new students at four-year institutions were first time and full time, leaving more than two million students out of the calculation.8 In response to this critique, IPEDS recently expanded its data collection to include part-time students, non-first-time students (i.e., transfers), and students who begin during terms other than fall.
The IPEDS completion rate data, by design a survey of colleges, are an “institutional graduation rate” rather than a “total” graduation rate—that is, some students complete degrees at other institutions, and this may not be observed by the college. Analysis of the Beginning Postsecondary Students Longitudinal Study: 1996–2001 suggests that the overall graduation rate, once it accounts for students’ mobility across institutions, is about 8 percent higher than the institutional graduation rate.9 Acknowledging this, the National Student Clearinghouse (NSC) has become a leading source for information on postsecondary outcomes. Unlike the IPEDS, which relies on self-reported institutional information, the NSC uses actual student enrollment and completion records, which are likely to provide the most accurate measure.
Moreover, these records are linked across schools, and this gives the NSC the advantage of being able to track students across institutions. The NSC currently covers 98 percent of college enrollments.10 This is important because, according to a recent NSC report, 29 percent of students who began at public two-year institutions completed credentials at a different institution.11 Another important distinction is that the NSC definition of completion focuses on all first-time students; therefore, unlike the measure from IPEDS, students do not need to attend full time to be included in the rate.12 As a result, although IPEDS is a good source to examine institutional variation, the NSC measures give a broader sense of completion for a range of enrollment patterns.
Trends from the IPEDS Data
The federal data from the 2016 IPEDS survey give us a picture of college completion. Table 1 displays the completion rates for students by institution level (four and two year) and sector (public, nonprofit private, and for-profit) of institution. The overall completion rates count finishing any formal degree or certificate, and the measure is calculated for 150 percent of normal time, which is six years for a bachelor’s degree and three years for an associate degree.13 Overall, 49.1 percent of students at four-year institutions and 38.6 percent of students at two-year institutions completed some kind of educational credential.14

However, the rates differ by institution type. Completion rates are higher at the four-year institutions (compared to the two-year colleges) and at the private institutions (compared to the public institutions). Universities, which are more heavily involved in research activities than other schools, also tend to have higher completion rates than other four-year institutions: The overall six-year completion rate at public research and doctoral universities is 61.3 percent, compared to 40.3 percent at other four-year institutions. Similarly, the mean 2016 completion rate at private research and doctoral universities (i.e., institutions more focused on research than other schools) is 77.8 percent compared to 52.7 percent at other private four-year colleges.
However, across all sectors of higher education, a substantial proportion of students did not complete any educational credential over 150 percent of normal time. Fewer than half of students did so in all sectors, except for public four-year universities and private four-year colleges and universities. The statistics are also a bit misleading for the two-year sector. When one considers how student enrollment is distributed across the different kinds of two-year institutions, completion rates are clearly the lowest for the segment that serves the most students: public two-year colleges. Therefore, although the average completion rate for two-year institutions is 38.6 percent, once one weighs the outcome measure by college size—meaning that larger schools are counted more heavily than smaller ones—the enrollment-adjusted completion rate for students at two-year colleges is actually 24.4 percent, as more students attend the schools with lower rates than with higher ones.15
The columns on the right side of Table 1 restrict the measure of completion to bachelor’s degrees and display how completion rates change over four-, five-, and six-year windows measured from the time a student enrolls. As expected, completion rates increase with more time. There is a considerable jump at public and private institutions from four to five years, with additional growth in the sixth year that is especially noticeable at public four-year institutions that are not research universities. This growth over time underscores the importance of the time horizon used to judge completion. Students typically take longer than four years (for a bachelor’s degree) or two years (for an associate degree) to finish, especially because many devote their initial years in college to completing developmental and remedial courses, working part-time jobs, having periods of part-time attendance, or stopping out of college temporarily.16
The consistent definition IPEDS uses enables one to look at completion trends over time. Although completion rates have improved during the past decade or so, the growth for most sectors has not been considerable, and several sectors have experienced decreases in their completion rates during the past decade. Figure 1 displays how the six-year bachelor’s degree completion rate has changed from 2004 to 2016. During this time, completion rates at public four-year universities increased 12 percent, from 54.5 percent to 61.3 percent. Private universities and other public four-year institutions experienced a 6 percent increase in their completion rates. However, bachelor’s degree completion rates were stable at private four-year institutions that are not universities, and for-profit four-year colleges experienced a 25 percent decline in completion rates over the period.

Completion rates at two-year institutions have also changed, as shown in Figure 2. The rates reported are for the overall completion of any degree or certificate within 150 percent of normal time. Within this sector, the public two-year colleges have experienced a 3 percent increase in completion rates. However, the other two-year institutions have not fared as well: Private two-year colleges saw a 15 percent decline, and the for-profits saw a 10 percent decline.

Taken together, the trend data suggest that outcomes have improved within the public sector but are declining at for-profit institutions; the private institutions that are not universities are also suffering. These patterns raise the question about the determinants of college completion. This is a period of shifting enrollment and resources, as well as better data collection and measurement, which could help explain some of the trends from 2004 to 2016. But it is also a time of increased attention to the issue of student success and degree completion. Further analysis is needed to understand the degree to which institutional actions— such as improved educational supports and services— and policy have influenced these trends.
A Broader Definition of College Completion: The National Student Clearinghouse
As noted, the completion rate from the federal IPEDS survey gives only a partial picture of student outcomes because the traditional measure focuses on full-time students. In contrast, the NSC measure includes part-time students and thus gives a broader picture of completion for a wider range of students.17 Doug Shapiro and colleagues present the most recent college completion rates using the NSC data.18 Overall, they calculate a six-year completion rate of 56.9 percent for the cohort that began a postsecondary study in fall 2011. This is larger than what the IPEDS data report, and the discrepancy may be related to several factors.
First, the NSC data are better able to track students across institutions, and they use a different definition of a cohort. The completion rates reported also have a different base year (2010 for IPEDS and 2011 for NSC), and the outcomes for two-year colleges are based on six year, rather than three. In general, the NSC data suggest that private four-year institutions have the highest rates of completion (similar to what was found in the IPEDS data), and, over the course of six years, the NSC reports that nearly 4 of 10 students who start at public two-year colleges complete a formal credential.
Because it can track students over time and across institutions, the NSC report details where students completed their degree or certificate: at the starting institution, at a different four-year institution, or at a different two-year college (Table 2).19 For each type of institution, the bulk of students complete their credential at the starting institutions, but a substantial proportion complete elsewhere. This varies from 17 percent and 16 percent of students from public and private four years, respectively, to 29 percent and 37 percent for the public two years and for-profit four years, respectively. Therefore, if an institution is unable to track student enrollment at other colleges, then it will substantially underestimate its own completion rate.

The NSC data show that some of the completion accomplished by four-year students happens at two-year colleges, which may suggest downward adjustment in goals or finishing an associate degree before returning to a four-year institution. On the flipside, 20.5 percent of students who start at public two-year colleges and complete a credential do so at four-year institutions, which highlights the transfer function of community colleges. However, research suggests that although many students who begin at two-year colleges intend to obtain a bachelor’s degree, they do not reach that goal.20 One normative question related to these patterns is: To what degree are institutions responsible for the outcomes of students who transfer to other schools? The initial institution may be partly responsible for a student’s completion or failure to complete at another institution, but this is not currently considered in accountability regimes.
The NSC data provide a longer horizon—eight years—to observe how completion rates change over time.21 Focusing on the fall 2009 cohort, Shapiro and colleagues found that 52.9 percent had completed a degree or certificate within six years.22 Two years later (i.e., after eight years), this rate had climbed to 59 percent. This suggests that there is a large group of students who progress slowly to an educational credential; given the fact that the NSC measure includes part-time students, this longer time frame may be reasonable when measuring student outcomes. However, given the high cost of college, the longer time to degree has important repercussions, not just for students who must shoulder the burden of additional years of tuition and lost wages, but also for taxpayers who subsidize the costs of higher education each year.
How Outcomes Vary
Average college completion rates vary by institutional and student characteristics. The following sections take a closer look at how these factors affect degree attainment.
Outcomes Vary By Institutional Characteristics
Although overall college completion rates underscore the problem of non-completion generally, an investigation into how rates vary by institution and student profile may elucidate the underlying drivers of outcomes. Institutional mission and resources, admissions practices, and student body characteristics are some of the reasons why outcomes vary.
Using IPEDS data, Table 3 shows how completion varies by institutional selectivity as measured by the percentage of applicants who are accepted for admission. A college’s selectivity rate is correlated with the academic preparation level of incoming students; based on the substantial literature linking preparedness to college success, one would expect more selective institutions to have higher completion rates, all else being equal in terms of institutional resources and practices.

And that is what I find. Focusing on selectivity, institutions that accept a smaller proportion of applicants have higher completion rates. At public and private four-year colleges that accept fewer than 50 percent of applicants, the six-year completion rate in 2016 was 56.9 percent and 64.2 percent, respectively. In contrast, broad-access public and private institutions that accepted more than 75 percent of their applicants had completion rates of 47.1 percent and 52.8 percent, respectively. This pattern presents a cautionary tale: Institutions could raise their completion rates by increasing their admissions standards alone—that is, without making any other changes to educational quality or support. The flipside is also true: Broad-access institutions with open admissions policies that allow anyone to enroll are at risk of having lower completion rates. For this reason, completion rates should be treated carefully in accountability schemes so that institutions do not have greater incentives to “game the system” than to make meaningful improvements to the student experience.
The patterns found by institutional characteristics have also spurred suggestions to only compare the completion rates of similar institutions. In other words, some say it is not appropriate to interpret the difference in the completion rates of public universities and community colleges as suggesting differences in quality or institutional effectiveness because each type of institution has different student bodies and resources. There have been several public efforts to highlight comparisons of the student outcomes for similar schools. This work suggests that though resources and student preparation levels are undoubtedly related to an institution’s completion rate, these factors do not entirely explain why completion rates are much higher at some schools compared to others.
For example, Frederick Hess and colleagues document how the average six-year graduation rates vary not only across but also within selectivity groupings.23 They use selectivity groupings as defined by Barron’s Profiles of American Colleges, which categorizes institutions according to the high school class rank and test scores of the incoming freshman class, as well as admissions rates. For colleges rated as “very competitive,” the six-year graduation rate for the top third of institutions averaged 74 percent. In contrast, institutions in the bottom third averaged a six-year graduate rate of only 49 percent, a difference of 25 percentage points.24 Even among the “most competitive” colleges, there was a difference of 13 percentage points between the average of the top third and bottom third of institutions.25 As Hess and colleagues highlight, “There are vast disparities—even among schools educating similar students.”26
The College Results Online project by Education Trust provides a platform for exploring how completion rates can vary among similar institutions. Users can select a four-year nonprofit institution and see how its graduation rate compares to similar colleges serving similar students. Peer groups are determined by numerous factors that have been found to be statistically related to completion. These include SAT or ACT scores of the freshman class, selectivity ratings, Carnegie Classifications, sector, size, and student body characteristics such as the percentage from low-income families, the percentage age 25 or above, and the percentage who attend part time. Beyond the overall graduation rate, the College Results tool also displays rates by race, ethnicity, and gender; these data show that even when the overall rate is high, there may be significant gaps across groups and that not all students do equally well at a particular institution. Moreover, some institutions have been more successful in minimizing racial gaps in completion rates than others.
Therefore, despite the connection between completion rates and the characteristics and student body of a college, outcomes are also determined by other factors, including institutional practices and decisions regarding resources. John Bound, Michael Lovenheim, and Sarah Turner emphasize this point in their examination of how and why college completion rates have changed over time.27 They conclude that though the preparedness of entering students plays a role, an institution’s characteristics and resources are more important in determining graduation rates— and this highlights the potential importance of institutional action in improving completion outcomes.
Outcomes Vary By Student Profile
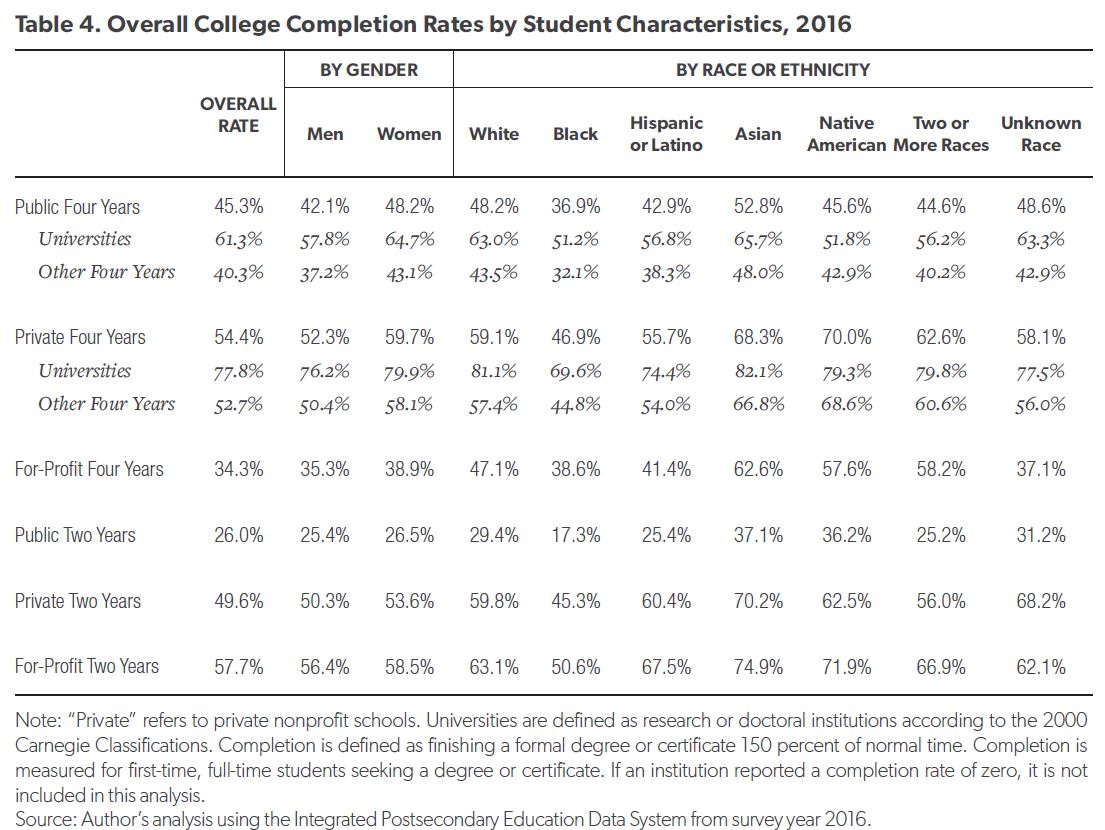
The differences in completion rates by institutional type are partly driven by the types of students each part of higher education tends to serve. As shown in Table 4, students in different demographic groups have varying levels of completion, and this can help explain why some sectors of higher education have lower rates than others. However, even within a sector, students from different genders and racial or ethnic groups have different likelihoods of college completion. Using the IPEDS definition of completion and focusing first on gender, women had higher completion rates across all types of institutions than men did in 2016. The gender gap in favor of women is especially large at public and private four-year institutions, but there is little average difference for students who begin at community colleges.
The NSC data also document differences in completion by gender. Using their broader definition of completion, they find that for the fall 2011 cohort, 43.2 percent of men completed within six years at their starting institutions compared to 47.5 percent of women. An additional 10.7 percent of men completed at a different institution compared to 12.7 percent of women.28
The remainder of Table 4 displays differences by student racial or ethnic group. In general, Asian and white students have higher completion rates than black and Hispanic or Latino students.29 Native American, multiracial, and those with unknown race tend to fall in the middle in terms of their outcomes, although this can vary.30 The differences within sector present several interesting patterns. First, at the universities, the institutions most focused on the research mission in higher education, all groups have more than half of their students complete within six years, and, except for black students, at least nearly three-fourths of students at private universities complete. Meanwhile, at the other four-year public and private institutions, the gaps by race and ethnicity are especially large between Asian students and black and Hispanic students. The outcomes at for-profit four-year colleges are also much stronger for students who are not black or Hispanic. Meanwhile, at the public two-year colleges, black students have especially low completion rates—just half the proportion Asian students experience.
Underlying these trends by race and ethnicity are important differences in income and resources. In terms of income, for instance, in 2016 the median family income was $49,370 for black students and $51,110 for Hispanic students. In contrast, Asian families had a median income of $93,500 and white families a median income of $82,070.31 There are also documented differences in K–12 education quality by race given how students are distributed across different neighborhoods and communities with varying resources and school outcomes. On average, black children attend schools with more inexperienced teachers, fewer opportunities to take advanced courses, lower average test scores, and higher proportions of low-income students.32 For these reasons, the patterns observed by race should be interpreted as also representing differences in the underlying resources of students by background.
The differences found by race do have important implications for the future. Given current population trends, the US Department of Education predicts a 22 percent increase in the number of postsecondary students who are black between 2014 and 2025. The projected increase is even larger for Hispanic students, with an expected increase of 32 percent, from 3.2 million to 4.2 million students over an 11-year time frame. In contrast, the number of students who are white is expected to increase only 3 percent during this time.33 Given these trends, unless something can be done to improve the outcomes of black and Hispanic students, national completion rates will fall, resulting in substantial losses for our country.
The Costs of Non-Completion
These trends and patterns of not receiving a postsecondary credential document the failure of millions of students to meet their educational goals. However, far larger costs, for both the individual and society, stem from non-completion.
Earnings and Tax Revenue
Simply put, non- completion prevents students from enjoying the increase in earnings that would be possible with a degree. Estimates of the returns to education suggest that college graduates with a bachelor’s degree between ages 25 and 29 earn roughly $15,500 more per year on average than individuals with only a high school diploma in the same age group.34 Each additional year of college results in increased earnings. For this reason, students who have even a few terms or semesters of college study usually experience a gain in their earnings even without a degree.
However, there is an especially large jump in earnings the year a student earns a degree. This has been documented in the research literature as “sheepskin effects,” also known as credential effects.35 Some suggest that employers are willing to compensate students at higher rates because they interpret completion as a sign of perseverance and hard work. Additional research has demonstrated that extended college attendance culminating in a postsecondary degree actually has causal effects on students. This means that higher education is more than just a signal of a student’s traits and abilities; instead, it actually increases the productivity and other attributes of a graduate.36
Recent data, as shown in Table 5, document the jump in earnings that college graduates receive. Note that national earnings data (i.e., from the US Census Bureau) focus on the completion of associate and bachelor’s degrees relative to “some college,” which is a catchall category for anyone who has attended at least a term of higher education but did not receive a degree.37 As shown in the top panel of Table 5, students with a degree make more, on average, than those with no degree: There is an annual difference of $4,300 for those with an associate degree and nearly $20,000 more annually for those with a bachelor’s degree. The gain in earnings is larger for men than for women. Moreover, the difference is especially large for individuals at the 75th percentile of the income distribution. Those with some college earn more than those with only a high school diploma, but the average gain is fairly small.

The gains in earnings from completing a degree are not just enjoyed by individual students. Those who have higher earnings tend to pay more in taxes. As shown in Table 5, the tax revenue collected from college graduates is higher than the tax revenue collected from those with some college. Proportionally, those
with a bachelor’s degree pay relatively more in taxes than those without a college degree, so the loss to taxpayers each time a student does not complete his or her program is understated by the difference in earnings.
Employment and Benefits
Beyond income, students who complete their degrees are also more likely to enjoy employer-provided benefits, such as health insurance and pension plan coverage. These percentages are displayed in Table 5. There are small but meaningful differences between the percentage of those with some college who receive health care and pension benefits and the percentage who receive them if they have a college degree: There is a difference of 7 and 4 percentage points, respectively, in terms of health insurance and pension plan coverage relative to those with a bachelor’s degree. This makes clear that focusing on earnings alone ignores other employment benefits enjoyed by those who complete a degree.
Table 6 considers the negative outcomes that are more prevalent for those with only some college. The upper panel displays trends in unemployment rates from 1995 to 2015. The data show that, for all time periods, individuals without a college degree have higher rates of unemployment. The difference was greatest in 2010, during the Great Recession. By 2015, rates had come down, but the proportion of workers who are unemployed is similar for those with only a high school diploma and those with some college. Meanwhile, those with associate and bachelor’s degrees or higher have fared much better. This suggests that another benefit to completion is being insulated from unemployment, particularly during times of recession, which is good for both the individual and the public purse.

Poverty and Government Dependency
Poverty is also more prevalent for individuals who have not completed college. Among those with some college, the percentage of individuals living in households in poverty was 11 percent in 2015, compared to 8 percent for those with an associate degree and 4 percent for those with a bachelor’s degree or higher. The poverty rate is especially high for female-headed households with children; again, those with some college have trends that appear closer to the group with only a high school degree as opposed to the college completers.
Given the differences in poverty rates, it is not surprising that there are also differences in the percentage of individuals who participate in public assistance programs. Individuals with some college are slightly more likely to participate in Medicaid and the Supplemental Nutrition Assistance Program (SNAP) than those with an associate degree, but the differences compared to those with a bachelor’s degree or higher are quite large; the proportion participating in Medicaid is half that of those with some college and is one-fourth to one-third of the rates experienced by the some college group for school lunch, SNAP, or housing assistance. These gaps not only signal the individual costs of not completing a degree but also highlight the costs to society of higher rates of government dependency from those who begin higher education but do not complete it.
Health and Civic Responsibility
It is important to note the differences found by education level in other outcomes. For example, health outcomes tend to be better for individuals with a college degree. Those who complete a degree are also more likely to volunteer and participate in civic activities such as voting. For example, individuals with a bachelor’s degree were nearly two and half times more likely to volunteer and twice as likely to vote during the 2014 midterm election than were those with only a high school degree.38
Student Debt
While non-completers are missing out on potential benefits, many of them are still suffering with the cost of higher education. In recent years, the amount of debt that students are taking on to pay for college has ballooned. According to the College Board, 30 percent of undergraduates borrowed from the federal Stafford Loan Program, with an average debt of $6,590 among borrowers.39
Unfortunately, many of those students will not complete a college credential and will struggle to repay their loans. Data suggest that non-completers are less able to engage in repayment. In 2010–11 and 2011–12, only 34 percent of non-completers paid down at least $1 of their loan principal after three years. In comparison, 60 percent of completers had done so.40
Conclusion and Implications
Higher education has made substantial progress in better understanding and measuring rates of college completion. Increasing evidence documents that the costs of non-completion are more than just foregone earnings and opportunities—there are also financial responsibilities these students must confront without the benefit of the gains of a credential. As a society, we also lose the many public and social benefits of having a more educated populace. The challenges and missed opportunities due to low rates of degree completion underscore the significance of the problem our nation faces.
About the Author
Bridget Terry Long is the Saris Professor of Education and Economics at the Harvard Graduate School of Education. She is a research associate of the National Bureau of Economic Research, and her research examines factors that influence college student access, choice, and success.
© 2018 by the American Enterprise Institute and Third Way Institute. All rights reserved.
The American Enterprise Institute (AEI) and Third Way Institute are nonpartisan, not-for-profit, 501(c)(3) educational organizations. The views expressed in this paper are those of the author.
AEI does not take institutional positions on any issues.
Endnotes
National Center for Education Statistics, “Digest of Education Statistics,” https://nces.ed.gov/programs/digest.
US Department of Education, National Center for Education Statistics, “Tracking Students to 200 Percent of Normal Time: Effect on Institutional Graduation Rates,” December 2010, https://nces.ed.gov/pubs2011/2011221.pdf.
For example, the National Survey of Student Engagement collects student-level information on time use and activities students participate in that institutions provide for their learning and development. Another example is the College Learning Assessment, which aims to test student reasoning and communication skills.
See Frederick M. Hess et al., Diplomas and Dropouts: Which Colleges Actually Graduate Their Students (and Which Don’t), American Enterprise Institute, June 3, 2009, http://www.aei.org/publication/diplomas-and-dropouts/. As noted in the authors’ analysis that focuses on graduation rates, the indicator is not “invariably a good sign or low graduation rates necessarily a bad one,” especially because “an easy way to pad graduation rates is to drop standards and hand a diploma to every student who walks through the door.” However, as the authors emphasize, nearly all students who enter four-year institutions expect to earn a bachelor’s degree. “College students do not pack their belongings into the back of a minivan in early September wondering if they will get a diploma—only.”
In K–12, different ways of measuring high school graduation spurred confusing, misguided debates about the state of secondary education until a common standard was accepted by schools and the government.
Carol Fuller, The History and Origins of Survey Items for the Integrated Postsecondary Education Data System, US Department of Education, National Postsecondary Education Cooperative, 2011, http://nces.ed.gov/pubsearch.
The institutional capacity to do this has increased incredibly in recent years. Some institutions subscribe to the National Student Clearinghouse or use social media (e.g., LinkedIn) to track students who transfer to other institutions. Also, some institutions have access to system-wide databases, which can help institutions track enrollments within a state.
Chronicle of Higher Education, “Why Colleges Don’t Want to Be Judged by Their Graduation Rates,” October 17, 2014. The calculation noted was made using the 2003–04 Beginning Postsecondary Students Longitudinal Study.
Hess et al., Diplomas and Dropouts.
This paper will discuss NSC results for the cohort that began in fall 2011. At that time, the NSC data covered 99 percent of public four years, 93 percent of private four years, but only 63 percent of for-profit four years.
See Doug Shapiro et al., Completing College: A National View of Student Completion Rates—Fall 2011 Cohort, National Student Clearinghouse Research Center, 2017. In addition, the NSC measures of completion represent unduplicated head counts. In contrast, other data sources such as IPEDS might double count a student who attends multiple institutions, especially if enrollment is concurrent.
The NSC measure also explicitly includes former dual-enrollment students who had previously taken college courses while still in high school; it excludes current dual-enrollment students who were still in high school.
The term “normal time” is taken from the IPEDS survey. As shown in Table 1, the time most students take to complete a bachelor’s degree is not normally four years, which makes the term out of date.
Author’s calculations from IPEDS.
The weighted average is slightly higher if one uses full-time equivalent (FTE) enrollment. It is 25.4 percent, still far lower than the institutional average of 38.6 percent.
See Eric Bettinger, Angela Boatman, and Bridget Terry Long, “Student Supports: Developmental Education and Other Academic Programs,” Future of Children: Postsecondary Education in the U.S. 23, no. 1 (Spring 2013): 93–116.
NSC defines a cohort as first-time, degree-seeking students 18 or older who began fall 2011.
Shapiro et al. present the most recent college completion rates using the NSC data. See Shapiro et al., Completing College.
Data are not provided on completion rates for private and for-profit two-year institutions.
For example, see Bridget T. Long and Michal Kurlaender, “Do Community Colleges Provide a Viable Pathway to a Baccalaureate Degree?,” Educational Evaluation and Policy Analysis 31, no. 1 (2009): 30–53.
IPEDS also surveys for completion rates 200 percent of normal time, which is eight years for four-year institutions, but it does not ask for eight-year outcomes from two-year colleges.
See Shapiro et al., Completing College.
See Hess et al., Diplomas and Dropouts. The authors use the 2007 IPEDS data, which are for students who entered in 2001.
According to Barron’s Profiles of American Colleges, institutions in the “very competitive” category typically admit students who rank in the top 35–50 percent of their graduating high school class and have median freshman test scores ranging from 573 to 619 on the SAT and from 24 to 26 on the ACT. These colleges admit between one-half and three-quarters of their applicants.
“Most competitive” colleges are defined as requiring a class rank in the top 10–20 percent, a high school GPA of B to A, and freshman test scores between 655 and 800 on the SAT and 29 on the ACT. These institutions typically admit fewer than one-third of applicants.
Hess et al., Diplomas and Dropouts, 1.
See John Bound, Michael Lovenheim, and Sarah Turner, Why Have College Completion Rates Declined? An Analysis of Changing Student Preparation and Collegiate Resources, National Bureau of Economic Research, 2009.
Shapiro et al., Completing College.
I use the terms “Hispanic or Latino” following the IPEDS survey terminology, even though these can be distinct groups.
Some of the differences in completion rates across types of institutions may be due to small sample sizes, especially for Native American students, as other years of data suggest different patterns.
US Census Bureau, “Annual Social and Economic Supplement of the Current Population Survey,” 2017.
See Sean F. Reardon, Demtra Kalogrides, and Ken Shores, “The Geography of Racial/Ethnic Test Score Gaps,” American Journal of Sociology, forthcoming; and Charles Clotfelter, Helen F Ladd, and Jacob Vigdor, “Who Teaches Whom? Race and the Distribution of Novice Teachers,” Economics of Education Review 24, no. 4 (2005): 377–92.
William J. Hussar and Tabitha M. Bailey, Projections of Education Statistics to 2025, US Department of Education, National Center for Education Statistics, 2017.
Jennifer Ma, Matea Pender, and Meredith Welch, Education Pays, College Board, 2016.
For a discussion of this issue, see David Card, “The Causal Effect of Education on Earnings,” in Handbook of Labor Economics, Volume 3, eds. Orley Ashenfelter and David Card (Amsterdam: Elsevier Science B. V., 1999).
Philip Oreopoulos and Uros Petronijevic, “Making College Worth It: A Review of the Returns to Higher Education,” Future of Children 23, no. 1 (2013): 41–65.
The completion of certificates is not captured in these large-scale national data sets.
Ma, Pender, and Welch, Education Pays.
Sandy Baum et al., Trends in Student Aid 2017, College Board, 2017.
Baum et al., Trends in Student Aid 2017.
Subscribe
Get updates whenever new content is added. We'll never share your email with anyone.