The State of American Higher Education Outcomes in 2019


Executive Summary
Obtaining an education beyond high school is no longer a luxury for the few, but rather a necessity for most to enter the middle-class. Jobs that only require a high school diploma are fading away, while those that require a credential or degree are rapidly expanding.1 For the US to maintain its competitiveness globally, the ability to access and complete a high-quality postsecondary education—whether that be from a four-year, two-year, or certificate-granting institution—has never been more important.
This report examines whether US institutions of higher education are successful in educating and preparing the next generation of workers. Specifically, it looks at three critical measures of success: 1) college completion; 2) post-enrollment-earnings; and 3) loan repayment. It examines these outcomes at four-year, two-year and certificate-granting institutions. It also provides a breakdown by educational sector, including student success rates at public, private non-profit, and for-profit institutions. We also examine whether institutions are succeeding across multiple measures, as federally-funded higher education institutions should ultimately be leading most of their students to graduate, earn a decent living, and pay down their loans over time.
Among our findings:

Four-year institutions:
- Completion: While the typical four-year institution graduates 77% of its students, many still struggle to help their students cross the finish line. In fact, 247 institutions (15%) still graduate less than half of their students, 33 of which show completion rates of 25% or less.
- Earnings: Even with middling graduation rates, most four-year institutions (83%) leave the majority of their students earning above the average high school graduate after attending. Almost a fifth (17%) have at least three-quarters of former students earning above this threshold.
- Loan Repayment: Most four-year institutions (85%) show the majority of their students successfully beginning to pay down their loan principal shortly after leaving. However, 237 four-year schools still leave most students unable to make sufficient payments to cover even their accumulating loan interest—let alone their principal—five years after beginning repayment.
Two-year institutions:
- Completion: Most two-year institutions struggle with getting students all the way through a program. Only 289 (29%) show that a majority of their students have earned a certificate or degree at the institution they enrolled in eight years prior.
- Earnings: With these low graduation rates, it’s not surprising that many schools also demonstrate troublesome employment and loan repayment outcomes. Over 70% of two-year schools left the majority of their former students earning less than the average high school graduate.
- Loan Repayment: While press coverage often focuses on large loan balances at four-year institutions, there is a repayment problem among those who have to borrow to attend two-year schools, as well. Most two-year institutions (68%) show a majority of former students who borrowed actually owing more on their educational debt than the amount they initially took out five years after they leave the institution.
Certificate-granting institutions:
- Completion: Certificate-granting institutions show better completion rates than two-year schools—likely because the time to complete most programs is quite short. Over half (59%) leave the majority of their students with an award or certificate, in comparison to 29% of two-year institutions.
- Earnings: Yet, even with high completion rates, certificate-granting institutions show some of the most worrisome post-employment outcomes. More than one in four institutions (26%) leave more than three-quarters of their former students earning less than the average high school graduate.
- Loan Repayment: Most students will struggle to make sufficient loan payments at the typical certificate-granting institution. In fact, 70% of these schools leave most of their students who borrowed to attend owing more on their educational debt than the amount they initially took out five years after leaving the institution.

The State of American Higher Education Outcomes in 2019
Every year, fifteen million students attend an institution of higher education in the US with the hopes of obtaining the credentials needed to compete in today’s economy.2 Students who earn a high-quality award or degree will likely succeed, as they will have gained the skills and qualifications necessary to find financially secure employment and pay back their educational debt after graduation.3 Those who don’t complete a postsecondary education will have a harder time, as employment opportunities for high school graduates are steadily decreasing year after year.4
To compete globally, the US must increase the amount and quality of postsecondary credentials awarded in this country. America lags behind 11 other countries in terms of postsecondary attainment, with less than half (45%) of 25-34 year olds currently obtaining any credential beyond a high school diploma.5 And with nearly two-thirds of all jobs in the US — including 18 of the fastest 30 growing professions — requiring some sort of postsecondary education, this lagging attainment is likely to result in future American workers lacking in opportunities to earn a comfortable, middle-class life.6
Because higher education is crucial to both individual and national success, American taxpayers invest nearly $120 billion in federal grants and loans every single year with the hopes of preparing the workers of tomorrow.7 That’s more than the budgets for the Department of Homeland Security, Department of Justice, the State Department, and NASA combined.8 And with such a substantial investment of time and money from students and taxpayers, it’s critical that they get a return. That means it’s essential to understand whether institutions are actually increasing opportunities for the students they serve.
To help answer whether the US higher education system is succeeding, this report uses three measures of student outcomes to assess institutional performance: college completion, post-enrollment earnings, and loan repayment rates. Within each section of this report, we offer a snapshot of institutional performance for those who enroll. This includes descriptive statistics for each level of institution, such as the number of institutions, typical undergraduate enrollment, net price, percent of part-time students, and the percent of students receiving Pell Grants. Overall, this report provides an overview of where US institutions are succeeding, where there is room for improvement, and where they are simply falling short.
Three Key College Outcomes
Completion
One of the most important outcomes to track in higher education is whether students earn the certificate or degree for which they enrolled. Leaving with a credential in hand is closely associated with the ability to earn a decent living and pay down their loans after attending.9 In fact, a bachelor’s degree is estimated to be worth $2.8 million on average over a lifetime—with those who earned it making 84% more than the average high school graduate.10 Student borrowers who earn an award or degree are also three times less likely to default than those who take out college loans but leave without any credential.11 To assess whether institutions are successful at graduating their students, the US Department of Education’s (Department’s) new Outcome Measures survey looks at the proportion of students who entered an institution eight years prior and ending up earning a certificate or degree.12 This survey also includes the outcomes of part-time and transfer-in students, an improvement from the Graduate Rate Survey, which only includes full-time students who are attending college for the first time.
Post-Enrollment Earnings
The number one reason why students enroll in an institution of higher education is to increase employment opportunities that lead to a financially stable future.13 One of the main ways the Department measures whether attending an institution leads to a wage premium is by determining how many students earn more than the average high school graduate — measured to be $28,000 right now — within six years of entering an institution.14 For example, if after six years of entering an institution, most students are unable to find employment that pays at least as much as the average high school graduate, it may not be financially worth it to attend. This means that most students who entered this program will have spent years out of the workforce, and possibly taken out debt to finance their educational program, only to be left with a salary that could have been achieved without going in the first place.
Loan Repayment
Right now, 70% of students take out loans to attend college.15 Providing students with sufficient employment opportunities to pay down those loans over time is a critical measure of institutional success. To help prospective students determine whether schools are delivering a return on this financial investment, the Department looks at whether students are making steady progress in paying down their debt shortly after leaving school. To do so, it looks at institutional loan repayment rates, which measure the proportion of student borrowers who can pay down at least $1 on the principal of their loans within five years of leaving an institution and beginning repayment.16 If a high percentage of students are unable to make sufficient payments to at least keep up with accumulating interest on their educational debt, it may indicate that the cost of an institution is too high, that it fails to provide sufficient economic returns, or both. It also presents a risk to taxpayers, as these loans may be less likely to be paid back in full over time.
Methodology
For this analysis, we pulled information from four different datasets at the Department: the College Scorecard, the office of Federal Student Aid, the Integrated Postsecondary Education Data System (IPEDS), and the Performance by Accreditor Data File.17 The compiled data set uses a unique six-digit institutional identifier derived from FSA and includes information on over 5,100 institutions that are eligible to participate in Title IV programs, meaning its students are eligible to receive grants and loans from the federal government.18 Our analysis examines aggregated institutional outcomes data in two ways: 1) by the credential awarded most frequently, and also 2) by the sector of institution, whether it be public, private, non-profit, or for-profit.
This analysis uses the most comprehensive completion data from the Department’s Outcome Measures survey, rather than utilizing the statutory graduation rate, which only includes first-time, full-time students.19 The Outcome Measures survey measures completion rates for first-time students, part-time students, and students who transfer into an institution, at four, six, and eight-year measurement periods.20 For this analysis, completion outcomes are measured at eight years after students enter an institution—the most generous graduation rate for which data is available. And while the statutory graduation rate treats students who transfer out of an institution as having not completed a degree, we recognize that some institutions—especially community colleges—may deem a high percentage of transfer students as a success. Since federal data has no way of determining how many students completed a credential after transferring out of an institution, this analysis removes transfer-out students from the numerator and denominator altogether, rather than treating them as a failure. The completion rate, in turn, measures only those students who enrolled at the institution eight years prior but never transferred.
Post-enrollment earnings data matches students who have received federal student aid with administrative salary data from the US Department of Treasury. This analysis uses a threshold earnings metric that measures the percentage of students who are earning more than the average high school graduate — which the Department estimates to be $28,000 per year —six years after they enroll. Therefore, if there are 100 federally aided students in an institutional cohort, and 75 of them earn more than $28,000 six years after enrollment, that institution would display a threshold earnings rate of 75%. Since this metric is limited to students who receive federal financial aid, it will provide for a more representative sample at institutions that display a higher percentage of borrowers.
Loan repayment rates are derived from FSA’s National Student Loan Data System and measure the percentage of students who have paid down at least $1 on their loan principal within five years of leaving school and entering repayment on their federal loans. For both post-enrollment earnings and loan repayment rates, students who are still enrolled, received military deferment, or who are deceased at time of measurement have been excluded from the calculation. More details on each metric, cohort year, and source of data can be found in the appendix.
Four-Year Institutions
Overall, there are 1,970 institutions that predominantly award bachelor’s degrees in the US. These institutions typically enroll around 1,900 degree-seeking students, a similar number as two-year institutions, yet significantly more than the average certificate-granting institution. They are generally more expensive than those alternatives, serve a more well-off population, and enroll more full-time students. And while the time to degree may be longer at a four-year institution, the payoff is also substantial. Students who go on to earn a bachelor’s degree typically earn 40% more than those who earned an associate’s.21 These institutions received $94.5 billion through federal grants and loans last year.2223
Quick Stats for Four-Year Institutions:
- Number of Bachelor’s Degree-Granting Institutions: 1,970
>Public (545), Private non-profit (1,315), For-Profit (110)
- Four-Year Students:
>Public (5,907,643), Private non-profit (2,515,938), For-Profit (555,902)24
- Median Undergraduate Enrollment: 1,871
- Median Net Price: $19,095 25
- Median Percentage of Enrolled Students Receiving a Pell Grant: 35%
- Median Percentage of Part-Time Students: 8%26
- Median Completion Rate: 77%
- Median Percentage Earning Above the Average High School Graduate: 64%
- Median Loan Repayment Rate: 68%
College Completion
Most four-year institutions show strong completion outcomes for the students who attend. At 53% of these schools, three out of every four students graduate. Yet at 33 four-year institutions that receive federal funds, less than one-fourth of their students complete a degree, making the chance of graduation unlikely.

Completion at Four-Year Institutions by Sector
Significant differences exist between completion rates at public, private non-profit, and for-profit four-year institutions. Nearly nine out of 10 (87%) of both public and private non-profit four-year institutions show the majority of their students leaving with a college credential. And six out of 10 private non-profit institutions graduate more than 75% of students. Yet, only four out of 10 for-profit institutions graduate more than half of entering students, leaving most without a credential, even eight years after entering.

Earnings Outcomes
Most four-year institutions (83%) leave the majority of their students earning more than an average high school graduate after attending, However, less than one in five four-year institutions (17%) show at least three-quarters of their students meeting this earnings threshold. And 14 federally-funded four-year schools show less than a quarter of their students able to earn above this threshold after attending.

Earnings at Four-Year Institutions by Sector
While every sector shows most four-year institutions leaving a majority of students earning above the average high school graduate, public and private non-profits showed better results on this measure than for-profit institutions. In fact, 87% of public and 82% of private non-profit institutions hit this benchmark, while nearly 40% of for-profits leave the majority of their students earning below $28,000 per year.

Loan Repayment

Repayment at Four-Year Institutions by Sector
While over 85% of public and private non-profit four-year institutions leave the majority of their students able to begin paying down their loan principal after five years, only 41% of for-profit institutions show the same result. The private non-profit sector shows the highest proportion of four-year institutions with strong repayment outcomes, with nearly 40% seeing more than three-quarters of former students paying down their loan principal. Only 11% of private non-profit institutions leave the majority of their students unable to meet this threshold.

Summary
Four-year institutions serve what has been historically deemed a more “traditional” college-going population than their two-year and certificate counterparts. Their students are generally more well-off, and nine out of 10 enroll on a full-time basis, a status that is associated with higher completion rates.27 Yet, while many four-year institutions show a majority of their students completing a credential, earning a decent living, and beginning the process of paying down their educational debt, there remain some areas of needed improvement.
While nearly nine out of 10 (85%) four-year institutions leave the majority of their students with an award or degree, 247 still leave most of their students without any sort of postsecondary credential, even eight years after entering. Four-year institutions as a whole show similar results in post-enrollment earnings and loan repayment — 83% of institutions show the majority of their students earning above the average high school graduate after attending, while 85% show most students making high enough loan payments to begin paying down their principal five years after leaving. Yet, 273 schools still leave most of their students earning below $28,000 per year, and 237 show their former students struggling with debt, with more than half actually owing more than they initially borrowed five years after they’ve left an institution.
There are also noticeable differences across sectors. While more than 85% of public and private non-profit institutions show the majority of their students completing a degree, only four out of 10 for-profit institutions hit this benchmark. Similar disparities exist within earnings and loan repayment rate outcomes: more than 80% of public and private non-profit institutions show at least half of their former students earning more than the average high school graduate and making adequate loan payments to at least cover their principal. Yet, nearly 40% of for-profits show the majority of their students earning less than $28,000 per year within six years of entering. And nearly six in 10 left most former students unable to make sufficient payments to cover the accumulating interest on their educational loan debt, meaning their overall loan balance was continuing to grow even if those students were making payments.
Two-Year Institutions
There are 1,035 institutions that predominantly award associate’s degrees in the United States, about half the amount of either four-year or certificate-granting institutions. Despite the smaller number of schools in this category, the typical two-year institution enrolls more degree-seeking students than their four-year and certificate-granting counterparts, with around 2,300 at each institution. While some have competitive admissions, many offer open enrollment to those who have a high school degree. They are generally the least expensive per year, serve a larger share of low-income students than four-year institutions, and enroll substantially more part-time students. These institutions received $15.6 billion in 2017-18, compared to over $90 billion for four-year institutions.
Quick Stats for Two-Year Institutions:
- Number of Associate’s Degree-Granting Institutions: 1,035
>Public (723), Private non-profit (128), For-Profit (184)
- Two-Year Students:
>Public (4,437,102), Private non-profit (118,918), For-Profit (173,575)
- Median Undergraduate Enrollment: 2,271
- Median Net Price: $9,186
- Median Percentage of Enrolled Students Receiving a Pell Grant: 41%
- Median Percentage of Part-Time Students: 39%
- Median Completion Rate: 38%
- Median Percentage Earning Above the Average High School Graduate: 45%
- Median Loan Repayment Rate: 44%
College Completion
While 289 two-year institutions (29%) show a majority of their students earning a certificate or degree at the institution where they initially enrolled within eight years, 699 (71%) do not. In fact, one out of every 10 two-year schools leave more than 75% of its students with any sort of credential (as noted in our methodology, in order to avoid counting transfer students as failures, this analysis instead removes transfer-outs from the numerator and denominator completely, instead focusing on proportion of students who entered, never transferred, and earned an award or degree at that institution).

Completion Rate at Two-Year Institutions by Sector

Earnings Outcomes
Nearly three-quarters of two-year institutions (72%) leave a majority of former students earning below $28,000 within six years of entering the institution. And while 30 institutions showed more than 75% of students earning above this amount, more two-year schools (41) showed even less than a quarter of students earning above this threshold.

Earnings at Two-Year Institutions by Sector

Loan Repayment
While press coverage often focuses on large loan balances carried by those who attended four-year institutions, two-year schools leave fewer of their student borrowers able to pay down their debt. Most two-year institutions (68%) show a majority of former students who took out loans to attend actually owing more than the amount they initially borrowed five years after they leave the institution.28 And even though two-year institutions cost less and more students may be able to avoid taking out loans in the first place, for those who do the outcomes are not good. Only 2% (20) of two-year institutions leave more than three-quarters of their students able to begin paying down their loan principal within five years, while 6% (52) show more than three-quarters of their students unable to make sufficient payments to even cover accumulating interest on their federal loans.

Repayment at Two-Year Institutions by Sector
The public and for-profit sectors show a similar proportion of two-year institutions (over 70%) that leave the majority of their students unable to pay down at least $1 on their loan principal within five years of leaving school. However, for-profits show a higher concentration of institutions with the poorest outcomes, with one in six (17%) showing over three-quarters of their former students unable to make sufficient loan payments to cover accumulating interest. And while most private non-profit two-year institutions show better results, almost half (46%) still leave most students who borrow unable to pay down their loan principal shortly after leaving, with 1 in 10 showing more than three-quarters of students actually owing more than the amount they took out in the first place five years after leaving school.

Summary
Two-year institutions often serve a different demographic of student than four-year institutions. Students are more likely to come from lower-income backgrounds, and nearly 40% attend part-time (in comparison to 8% of part-time students at four-year institutions). This suggests that many are balancing their postsecondary endeavors with other responsibilities outside of school. And while many two-year institutions are shown to serve their students well, too many still struggle with college completion—a characteristic that is shown to lead to lower post-enrollment earnings and a lower likelihood to pay down educational debt over time.29
In fact, over 70% of two-year institutions leave most of their students without an award or degree, even eight years after they enter. And more than one in 10 two-year schools leave over 75% of their students without any sort of credential. While students who transfer to other institutions are not included within this data as either positive or negative in the numbers, we know that fewer than one in seven who begin at a community college end up transferring and earning a bachelor’s degree, making any increases in overall completion likely to be inconsequential if more fulsome data were available.30 With completion numbers like these, it’s not surprising that many two-year institutions also demonstrate troublesome employment and loan repayment outcomes. More than seven in 10 two-year schools leave the majority of their former students earning less than the average high school graduate. And 68% showed most students who borrowed to attend unable to keep up with accumulating interest on their federal student loans, even five years after leaving school.
With over 1,000 two-year institutions across the US, there is a large variation in outcomes within each sector, whether it be public, private non-profit, or for-profit. Public institutions, which make up 70% of all two-year schools, struggle the most with completion, as 85% of their schools leave most students without an award or degree. And while two-year for-profits are shown to be better at helping their students graduate, they often struggle preparing students for employment opportunities that allow them to pay down their educational debts after they earn a degree. In fact, over 70% of two-year for-profit schools leave the majority of their students earning less than an average high school graduate and owing even more on their student loans than they initially borrowed five years after they’ve left the institution.
Certificate-Granting Institutions
Certificate-granting institutions offer non-degree granting programs that are designed to help students acquire a specific set of technical skills needed to enter a profession, such as a chef, nurse, or veterinary assistant. They typically take between six and 18 months to complete.31 Certificate-granting institutions make up the majority of institutions in the United States; however, they generally each enroll smaller numbers of students, typically around 150 at each institution. And while most certificate programs are shorter than those offered at two-year institutions, they typically cost about $6,000 more per year. Their student demographics also differ from two-year institutions—more are lower-income, and more attend on a full-time basis. These institutions received $8.5 billion through federal student aid last year compared to the $15.6 billion that was disbursed to two-year schools.
Quick Stats for Certificate-Granting Institutions:
- Number of Certificate-Granting Institutions: 2,123
>Public (554), Private non-profit (140), For-Profit (1,429)
- Certificate Students:
>Public (1,205,758), Private non-profit (55,323), For-Profit (415,662)
- Median Undergraduate Enrollment: 142
- Median Net Price: $14,659
- Median Percentage of Enrolled Students Receiving a Pell Grant: 56%
- Median Percentage of Part-Time Students: 29%
- Median Completion Rate: 56%
- Median Percentage Earning Above the Average High School Graduate: 35%
- Median Loan Repayment Rate: 42%
College Completion
Over half of certificate-granting institutions (59%) leave the majority of their students with an award or degree, doubling the 29% of two-year institutions that hit the same benchmark.32 However, 31 federally-funded certificate-granting institutions still fail to graduate even a quarter of the students who enroll.

Completion Rate at Certificate-Granting Institutions by Sector
Similar to completion outcomes for two-year institutions, private non-profit and for-profit institutions are more likely to graduate a higher proportion of students. In fact, 79% of private non-profit and 91% of for-profit institutions graduate more than half of their students, while only 30% of publics show the same result. In comparison to their two-year counterparts, a smaller amount of certificate-granting institutions show the most troublesome completion outcomes, with only 11% of publics, 3% of private non-profits, and 1% of for-profits graduating less than a quarter of their students.33 Certificate programs generally require less time to complete, which may make it easier for a higher proportion of students finish them.

Earnings Outcomes
Being that certificate programs are typically shorter than two- and four-year degrees, most students will have already been in the workforce for several years at the time of post-enrollment earnings are measured. Yet, even with several additional years of employment under their belt, most students from these institutions still show worrisome post-enrollment earnings outcomes even six years after they initially enrolled. Nearly 80% of certificate-granting institutions show a majority of their students earning less than the average high school graduate. And the worst performers far outnumber the best. In fact, 354 out of 1,383 institutions (26%) leave more than three-quarters of their former students earning less than the average high school graduate, while only 39 (3%) leave more than three-quarters earning above this benchmark.

Earnings at Certificate-Granting Institutions by Sector
While for-profits make up the majority of certificate-granting institutions, they also demonstrate the most troublesome employment outcomes. Nine out of 10 for-profits leave the majority of their students earning less than the average high school graduate — 38% cannot even get a quarter of their students above this minimum threshold. And while private non-profit show better outcomes overall, more than half of public (67%) and private non-profit institutions (54%) still show most of their students earning less than those who only obtained a high school diploma six years after they enrolled.

Loan Repayment
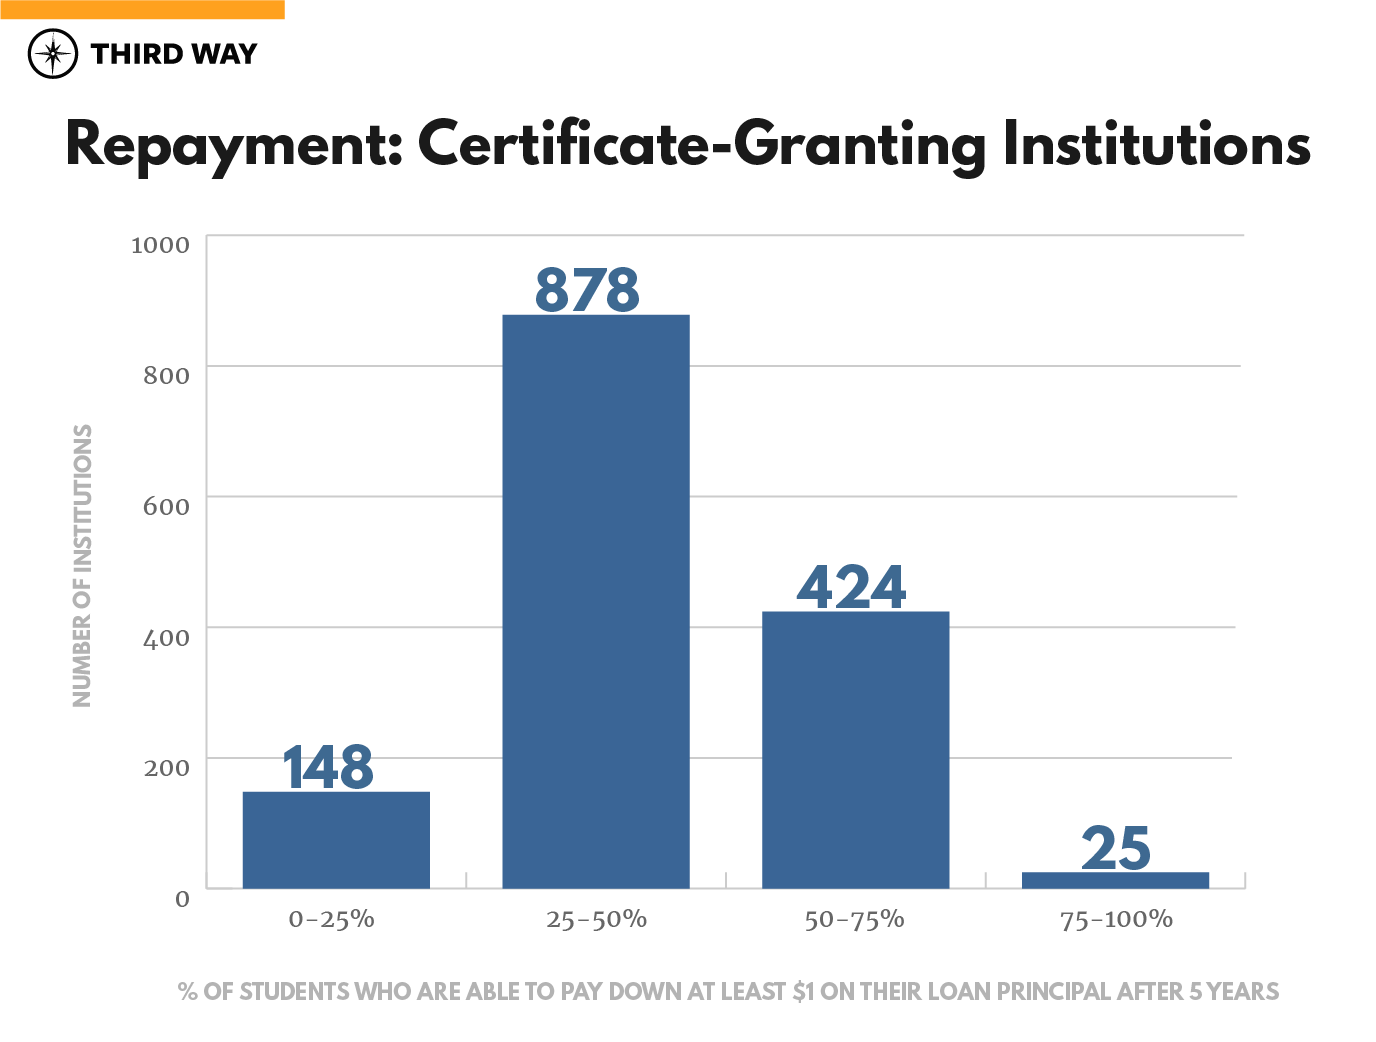
Certificate-granting institutions show some of the most difficulty in equipping former students to pay down their educational debt after attending, with 70% of schools leaving most students owing more than the amount they initially borrowed five years after leaving the institution. In fact, there are nearly six times as many certificate-granting institutions (148) where more than 75% of their students are unable to begin paying down their loan principal within five years than those (25) that show more than three-quarters of former students who can pay down at least $1 in principal over the same time frame.
Repayment at Certificate-Granting Institutions by Sector
For-profits make up over two-thirds of the institutions that predominantly award certificates, and they also have the highest proportion of institutions (75%) that leave most students unable to make a dent in their educational debt. Similar to repayment outcomes of two-year institutions, private non-profit institutions do best on this measure, with 65% leaving a majority of their students on their way to successful repayment. Thirty-nine percent of publics show the same outcome.

Summary
Certificate-granting institutions serve a higher proportion of low- and moderate-income students than two- and four-year institutions, as the typical institution is composed of nearly 60% of Pell Grant recipients.34 And while certificate-granting institutions often show higher completion rates than two-year institutions—perhaps due to a shorter time commitment and more students attending on a full-time basis—many still leave their students with difficulty finding employment that allows for successful loan repayment over time.
Nearly 60% of certificate-granting schools show their students earning a credential. Yet unlike at four-year institutions, high completion rates don’t always signify strong earnings and repayment outcomes at certificate-granting schools. Four-fifths still show a majority of their former students earning less than the average high school graduate, even six years after entering their program of study. And seven out of 10 leave students unable to make sufficient loan payments to keep up with accumulating interest on their debt, suggesting that some of these institutions may offer little return on investment, leaving many students worse off than they would’ve been if they’d never enrolled in the first place.
Similar to the outcomes by sector at two-year schools, for-profits show stronger completion rates at certificate-granting institutions. Yet, earning a certificate or degree at these institutions doesn’t appear to translate into strong employment outcomes or successful loan repayment within the sector. While 91% of for-profits graduate a majority of their students, 89% show a majority of their former students earning less than $28,000 per year—the salary of the average high school graduate. Public and private non-profit institutions, while making up a substantially smaller share of certificate-granting schools, also show worrisome outcomes. More than half show a majority of their former students earning below the average high school graduate six years after they enrolled.
Multiple Measures Tell a More Robust Story
While single measures of success offer a glimpse into how well institutions are doing in one area, examining multiple measures provides a more complete picture of how well they are serving their students. Below, we examine the proportion of institutions that show most of their students completing, earning above the average high school graduate, and paying down their principal.35 This gives a rough sense of whether an entering student is more likely than not to succeed on these three crucial measures.

More than a third of public institutions hit the 50% mark on all three metrics, and nearly 70% of private non-profit institutions show a majority of their students completing their program, earning a modest living, and beginning the process paying down their federal loans. For-profit institutions show a smaller proportion of their schools hitting these benchmarks. Only 13% of for-profit institutions show a majority of students succeeding on all three outcomes, and only 8% have more than half of their students able to earn more than a high school graduate and begin paying down their loan principal.36
There are More Institutions with Multiple Measures above 75% than Below 25%
While some institutions show worrisome outcomes across multiple metrics, our higher education system still has more high performers than troublesome actors.

There are 195 institutions across the US that show more than three-quarters of their students graduating, earning a decent living, and paying down their loan principal, compared to only four institutions that perform below 25% on all three metrics. While 46 of these high performing institutions are public, three-quarters are private non-profit. Only two are from the for-profit sector. A full 98% are bachelor’s degree-granting institutions. And while this high performance should be celebrated, it is unfortunately predominantly available to a wealthier student population. No institutions that performed at this high level on all three metrics enrolled more than 50% Pell Grant recipients, and about 8 in 10 enrolled less than 25% Pell students.37
Taxpayers Send a Lot of Money to Low-Performing Institutions
While the number of institutions performing poorly on all three metrics is substantially less than those performing well, too many institutions continue to get federal funds even when more than three-fourths of students leave degreeless, unable to earn a livable wage, and unable to pay back loans. These results can be devastating for the students who attend these institutions, wasting their time and money with little to show in return. These schools also cost taxpayers millions of dollars every single year.

Last year alone, nearly $120 billion in taxpayer-funded grants and loans helped subsidize students’ higher education endeavors.38 However, not all those investments paid off for students or taxpayers. In fact, $21 million in federal student aid flowed to institutions who performed below 25% on all three metrics – the worst of the worst institutions. And while the number one reason that students attend postsecondary schools is the promise of better employment and financial outcomes, too many federally funded institutions are failing to deliver on that promise. In fact, last year alone, $250 million went to the 82 institutions that left more than 75% of their students earning below a high school graduate and unable to begin paying down their loans.
Conclusion
This look at the State of American higher education outcomes shows that there is room for improvement across all levels and sectors of postsecondary education. While many institutions serve students well, too many still struggle to graduate the majority of their students. And with the cost of higher education growing, leaving without a degree makes it even more difficult to obtain a decent paying job and pay down educational debt over time. As Congress works towards reauthorizing the Higher Education Act, it is critical that federal policymakers put guardrails in place that will better target taxpayer subsidies toward institutions that are shown to increase opportunities for those who attend. If not, it is likely that performance at US institutions will stay stagnant, as too many schools will keep cashing taxpayer checks while failing to deliver on the promise of preparing the workers of tomorrow.
Appendix
|
Category |
Details |
Dataset Year |
Source |
|
Undergraduate Enrollment |
Enrollment of undergraduate certificate/degree-seeking students |
Fall 2016 |
College Scorecard (IPEDS): https://collegescorecard.ed.gov/data/ |
|
Net Price |
Average net price among undergraduate students receiving Title IV grants or loans |
Academic Year 2015-16 |
College Scorecard (IPEDS): https://collegescorecard.ed.gov/data/ |
|
Pell Grant |
Undergraduate students who received a Pell Grant |
Academic Year 2015-16 |
College Scorecard (IPEDS): https://collegescorecard.ed.gov/data/ |
|
Title IV Volume |
Title IV loan, grant, and campus-based aid disbursements (undergraduate and graduate) |
Loan and Grant Volume AY 2017-18. Campus-based AY 2016-17. |
FSA Data Center: https://studentaid.ed.gov/sa/about/data-center/student/title-iv |
|
Outcome Measures Completion Rate |
OM collects information on entering students who are first-time, as well as non-first-time students (i.e., transfer-in students). Completion is measured at eight years. |
Students who entered in 2009-10 and have completed an award or degree by August 2017. |
IPEDS Database: https://nces.ed.gov/ipeds/use-the-data |
|
Earnings |
Percent of Title IV undergraduate students earning at least $28,000 six years after entering the institution |
Treasury AY 2007-08 pooled cohort measured in CY 2014-15, inflation adjusted to 2017 |
College Scorecard (Treasury): https://collegescorecard.ed.gov/data/ |
|
Repayment Rate |
Five-year repayment rate, percent of undergraduate students reducing original principal balance |
NSLDS pooled FY 2011-12 cohorts measured in FY 2016-17 |
College Scorecard (FSA - NSLDS): https://collegescorecard.ed.gov/data/ |


Endnotes
Anthony Carnevale, et al. “Recovery: Job Growth and Education Requirements Through 2020.” Georgetown University Center on Education and the Workforce. 26 Jun 2013, https://cew.georgetown.edu/cew-reports/recovery-job-growth-and-education-requirements-through-2020/. Accessed 10 Oct 2018. See also, US Department of Labor – Bureau of Labor Statistics. “Employment Projections: 2016-2016 Summary.” 24 Oct 2017, https://www.bls.gov/news.release/ecopro.nr0.htm. Accessed 11 Mar 2019.
US Department of Education. “College Scorecard Data.” Updated on 30 Oct 2018, https://collegescorecard.ed.gov/data/. Accessed 11 Mar 2019.
Michael Itzkowitz. “Want More Students To Pay Down Their Loans? Help Them Graduate.” Third Way. 8 Aug 2018, https://www.thirdway.org/report/want-more-students-to-pay-down-their-loans-help-them-graduate. Accessed 11 Mar 2019; See also, US Department of Labor – Bureau of Labor Statistics. “Unemployment rates and earnings by educational attainment.” 27 Mar 2018, https://www.bls.gov/emp/chart-unemployment-earnings-education.htm. Accessed 11 Mar 2019.
“Workers with no college degree fall further behind than ever.” CBS News, 13 Jan 2017, https://www.cbsnews.com/news/workers-with-no-college-degree-fall-further-behind-than-ever/. Accessed 11 Mar 2019.
Organization for Economic Cooperation and Development. “Population with tertiary education.” 2019, https://data.oecd.org/eduatt/population-with-tertiary-education.htm. Accessed 11 Mar 2019.
Anthony Carnevale, et al. “Recovery: Job Growth and Education Requirements Through 2020.” Georgetown University Center on Education and the Workforce. 26 Jun 2013, https://cew.georgetown.edu/cew-reports/recovery-job-growth-and-education-requirements-through-2020/. Accessed 10 Oct 2018. See also, US Department of Labor – Bureau of Labor Statistics. “Employment Projections: 2016-2016 Summary.” 24 Oct 2017, https://www.bls.gov/news.release/ecopro.nr0.htm. Accessed 11 Mar 2019.
US Department of Education. “Title IV Volume Reports.” Updated Quarterly, https://studentaid.ed.gov/sa/about/data-center/student/title-iv. Accessed 11 Mar 2019.
Denise Lu and Kim Soffen, “What Trump cut in his agency budgets,” The Washington Post, 23 May 2017. https://www.washingtonpost.com/graphics/politics/trump-presidential-budget-2018-proposal/?utm_term=.2e4b7f6338a1. Accessed 8 June 2017.
Anthony P. Carnevale, et al. “The College Payoff.” 5 April 2011, https://cew.georgetown.edu/cew-reports/the-college-payoff/#infographic. Accessed 11 Mar 2019.
Anthony P. Carnevale, et al. “The College Payoff.” 5 April 2011, https://cew.georgetown.edu/cew-reports/the-college-payoff/#infographic. Accessed 11 Mar 2019.
US Department of Education. “Fact Sheet: Focusing Higher Education on Student Success.” 27 July 2015, https://www.ed.gov/news/press-releases/fact-sheet-focusing-higher-education-student-success#_ftn8. Accessed 11 Mar 2019.
US Department of Education. “IPEDS Outcome Measures Survey.” 2017, https://nces.ed.gov/ipeds/use-the-data. Accessed 11 Mar 2019.
Kevin Eagan. “The American freshman: National Norms Fall 2015.” Cooperative Institutional Research Program at the Higher Education Research Institute at UCLA, https://heri.ucla.edu/pr-display.php?prQry=196. Accessed 15 May 2017.
US Department of Education. “Using Federal Data to Measure and Improve the Performance of US Institutions of Higher Education.” Updated Jan 2017, https://collegescorecard.ed.gov/assets/UsingFederalDataToMeasureAndImprovePerformance.pdf. Accessed 11 Mar 2019.
Abigail Hess. “This is the age most Americans pay off their student loans.” CNBC, 3 July 2017, https://www.cnbc.com/2017/07/03/this-is-the-age-most-americans-pay-off-their-student-loans.html. Accessed 15 Mar 2019.
US Department of Education. “Using Federal Data to Measure and Improve the Performance of US Institutions of Higher Education.” Updated Jan 2017, https://collegescorecard.ed.gov/assets/UsingFederalDataToMeasureAndImprovePerformance.pdf. Accessed 11 Mar 2019.
US Department of Education. “College Scorecard Data.” Updated on 30 Oct 2018, https://collegescorecard.ed.gov/data/. Accessed on 11 Mar 2019; See also, US Department of Education. “Title IV Volume Reports.” Updated Quarterly, https://studentaid.ed.gov/sa/about/data-center/student/title-iv. Accessed 11 Mar 2019; See also US Department of Education. “Accreditor Data File.” 24 May 2018, https://sites.ed.gov/naciqi/archive-of-meetings/. Accessed 11 Mar 2019, See also, US Department of Education. “IPEDS Outcome Measures Survey.” 2017, https://nces.ed.gov/ipeds/use-the-data. Accessed 11 Mar 2019.
Some institutions were excluded from analysis for the following reasons: 1) they were not identified as predominantly awarding certificates, associate’s, or bachelor’s degrees (such as those offering only graduate education); 2) they operate in a US territory; or 3) their institutional identifier did not match either the FSA or Performance by Accreditor Database, indicating that they did not receive federal financial aid last year or they recently closed down.
S. 580 Students Right To Know and Campus Security Act. 8 Nov 1990, https://www.congress.gov/bill/101st-congress/senate-bill/580. 11 Mar 2019; See also, US Department of Education. “IPEDS Outcome Measures Survey.” 2017, https://nces.ed.gov/ipeds/use-the-data. Accessed 11 Mar 2019.
US Department of Education, Institute of Education Sciences. ”Expanding Student Success Rates to Reflect Today’s College Students.” 10 Oct 2017, https://nces.ed.gov/blogs/nces/post/expanding-student-success-rates-to-reflect-today-s-college-students. Accessed 11 Mar 2019.
US Department of Labor – Bureau of Labor Statistics. “Unemployment rates and earnings by educational attainment.” 27 Mar 2018, https://www.bls.gov/emp/chart-unemployment-earnings-education.htm. Accessed 11 Mar 2019.
US Department of Education. “Title IV Volume Reports.” Updated Quarterly, https://studentaid.ed.gov/sa/about/data-center/student/title-iv. Accessed 11 Mar 2019.
In a few instances, campus-based aid is disbursed to a central institutional office that has a separate and unique 6-digit OPEID. In these few instances, campus-based aid may be reflected as $0 within the dataset. However, this has a relatively minimal effect on overall Title IV dollars.
Measures undergraduate degree-seeking students.
Net Price was calculated at the Unit ID level due to it not being available at the 6-digit OPEID level within the College Scorecard dataset.
Information on part-time students is taken from the Outcome Measures survey. It includes students who started at an institution, yet never transferred to another institution in the eight years after entering. Medians represent the typical institution, and student averages may differ.
Michael Itzkowitz. “New Data Further Cements Completion Crisis in Higher Education.” Third Way. 1 Feb 2018, https://www.thirdway.org/memo/new-data-further-cements-completion-crisis-in-higher-education. Accessed 11 Mar 2019.
Laura Shin. “How This Lawyers Ended Up With $350,000 in Debt and Near Poverty Level Income.” Forbes, 30 Sep 2014, https://www.forbes.com/sites/laurashin/2014/09/30/how-this-lawyer-ended-up-with-350000-in-debt-and-near-poverty-level-income/#763d23f6d676. Accessed 11 Mar 2019.
Michael Itzkowitz. “Want More Students To Pay Down Their Loans? Help Them Graduate.” Third Way. 8 Aug 2018, https://www.thirdway.org/report/want-more-students-to-pay-down-their-loans-help-them-graduate. Accessed 11 Mar 2019; See also, US Department of Labor – Bureau of Labor Statistics. “Unemployment rates and earnings by educational attainment.” 27 Mar 2018, https://www.bls.gov/emp/chart-unemployment-earnings-education.htm. Accessed 11 Mar 2019.
Meredith Kolodner. “Fewer than one in seven community college students transfer and get a bachelor’s. degree – but there is new hope.” Hechinger Report, 19 Jan 2016, https://hechingerreport.org/how-often-do-community-college-students-who-get-transfer-get-bachelors-degrees/. Accessed 12 Mar 2019.
Jon Marcus. “New Research questions the value of certificates pushed by colleges, policymakers.” 24 Oct. 2017, https://hechingerreport.org/new-research-questions-value-certificates-pushed-colleges-policymakers/. Accessed 11 Mar 2019.
Outcome Measures completion data only includes degree-granting institutions. Therefore, certificate-granting institutions that do not also award — at least some — associate’s or bachelor’s degrees, are not included in this analysis.
However, because the newest completion data form the Department only includes degree-granting institutions, many institutions that only grant certificates are excluded from this data.
This reflects the amount of students receiving Pell Grants at the median certificate-granting institution.
Institutions without data on any of the given measures in this section were excluded from this analysis.
Because Outcome Measure completion data is limited to degree-granting institutions, There are less “for-profits included in “All three,” as there are in the other combination of metrics. This is because come for-profit institutions have been excluded from this piece of analysis that combines multiple metrics, if they only offer certificate-awards as their highest degree.
While it is beyond the scope of this paper, some scholars — such as Raj Chetty — have examined the effectiveness of institutions of higher education increasing socioeconomic mobility for the students who attend. While students from higher-income backgrounds are more likely to access and complete a college degree, some institutions are shown to be more effective at helping lower-income students climb the income ladder. More information can be found here: http://www.equality-of-opportunity.org/college/
US Department of Education. “Title IV Volume Reports.” Updated Quarterly, https://studentaid.ed.gov/sa/about/data-center/student/title-iv. Accessed 11 Mar 2019.
Subscribe
Get updates whenever new content is added. We'll never share your email with anyone.