The State of American Higher Education Outcomes in 2023


Is the US higher education system providing a baseline level of quality for college students? To answer that question, we have been regularly examining institutional outcomes in three key areas: completion, post-enrollment earnings, and student loan repayment. These metrics are informative in their own right, and they are also closely intertwined. Leaving college with a credential in hand is needed to fully unlock the financial and personal benefits associated with higher education, and graduation is a major indicator of future success—college graduates earn more than $1 million more over the course of their lifetime, while those who do not complete are three times more likely to default on their student loans.1 This report unpacks each of these critical outcomes at over 5,000 institutions of higher education and breaks down the data points by predominant degree awarded and sector, allowing for side-by-side examination of trends in multiple student success metrics across certificate programs and two- and four-year degrees at public, private non-profit, and for-profit institutions in the US.
Much has changed since Third Way published our last update to this report in 2019, yet a postsecondary credential remains vital to obtaining middle-class jobs and economic security. During the pandemic, workers with a high school diploma or less experienced the largest decline in labor force participation, and over the next decade, more jobs—including many of the fastest-growing and highest-paying—will require some level of postsecondary training.2 Policymakers must prioritize strengthening student outcomes across federally-funded higher education institutions to ensure that the US remains globally competitive, that taxpayer dollars are wielded responsibly, and that students are prepared to enter a changing workforce. This report offers a snapshot of how the higher education system is faring across key performance indicators related to graduating students and setting them up to make a sufficient income to repay their loans—and highlights where more work needs to be done.
Takeaways
Four-Year Institutions:
- Median Completion Rate: 78%
- Median Percentage Earning Above the Average High School Graduate: 76%
- Median Remaining on Loan Principal After Five Years: 90%
Two-Year Institutions:
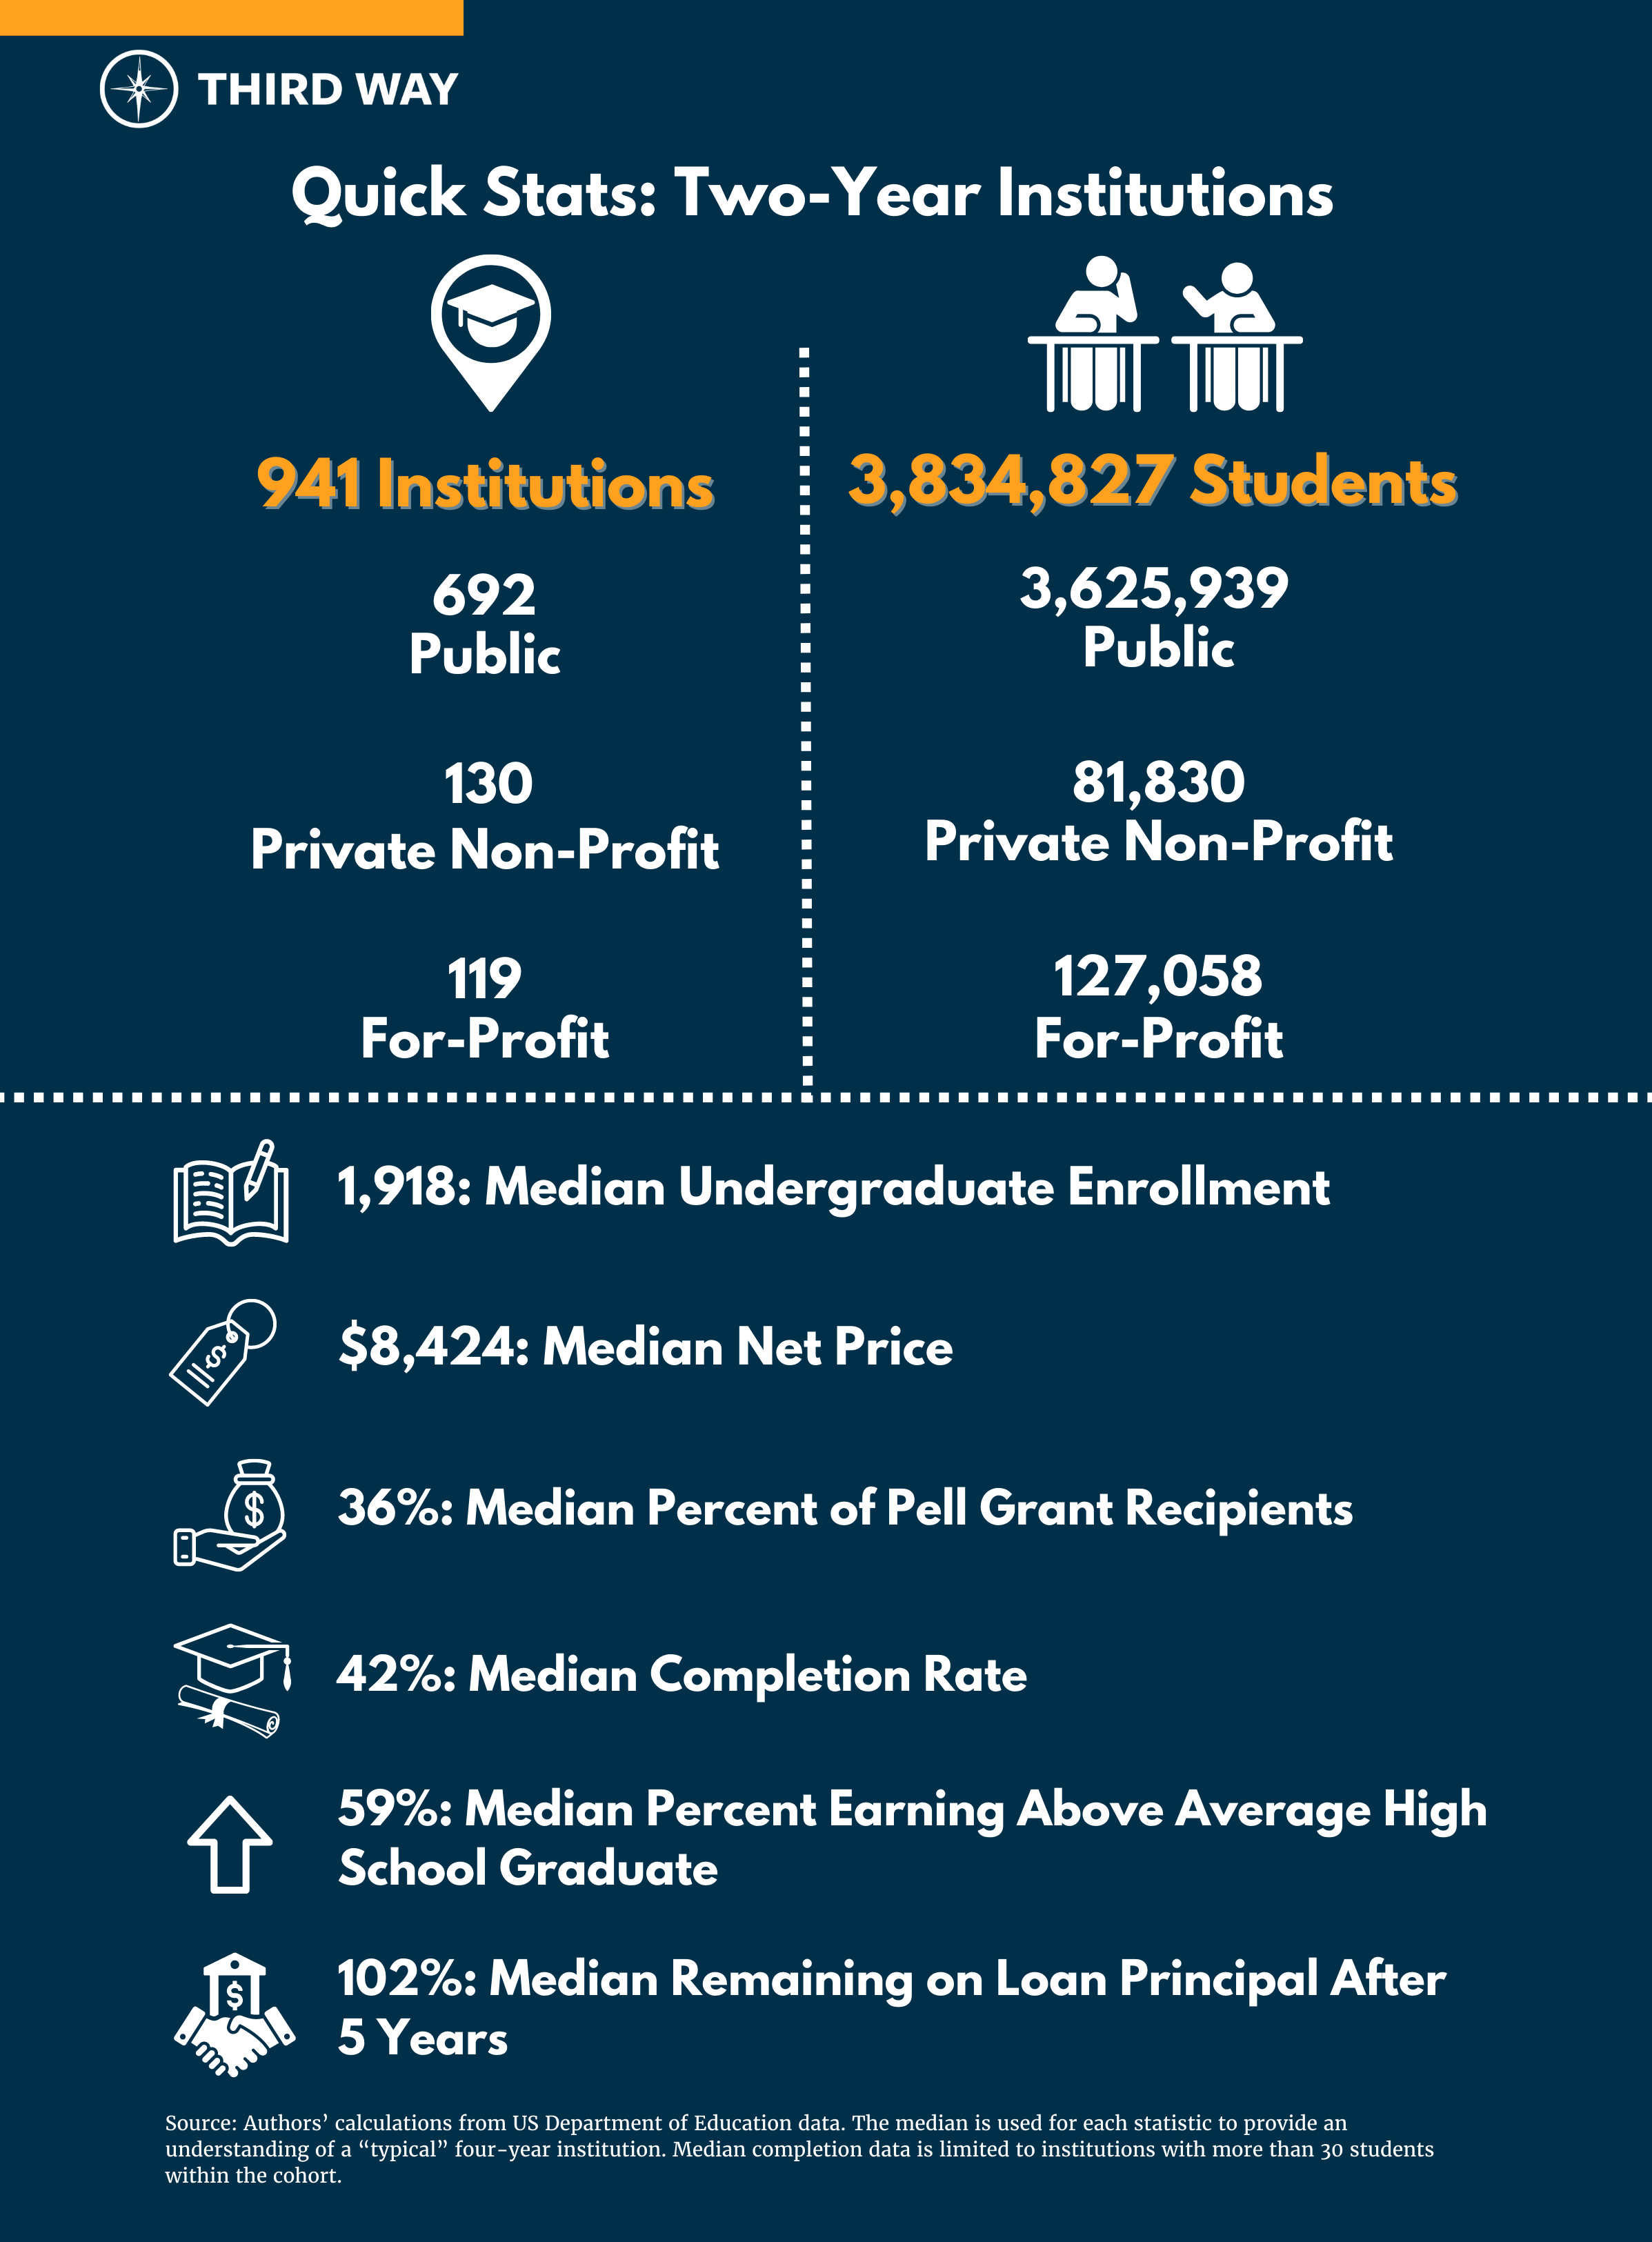
- Median Completion Rate: 42%
- Median Percentage Earning Above the Average High School Graduate: 59%
- Median Remaining on Loan Principal After Five Years: 102%
Certificate-Granting Institutions:
- Median Completion Rate: 54%
- Median Percentage Earning Above the Average High School Graduate: 48%
- Median Remaining on Loan Principal After Five Years: 97%
Methodology
For this analysis, we examine the outcomes of over 5,000 institutions of higher education using information from the US Department of Education (Department). Specifically, we pull information from the Accreditor Data File, which has information on institutional characteristics, completion rates, loan repayment rates, and the amount of federal financial aid (student grants and loans) that is distributed each year.3 We also incorporate the earnings of former students from the Department’s College Scorecard.4 Federal data elements are limited to those students who received federal student aid, and institutions without relevant available data were excluded from each part of the analysis in which data were absent.
For college completion rates, data are originated from the Department’s Integrated Postsecondary Educational Data System (IPEDS).5 Specifically, we use completion rates from the Outcome Measures survey, which, unlike other graduation rates, includes students who are part-time, as well as those who have transferred into an institution. Because part-time students are included, we use the most generous measurement period available for completion—eight years after initial enrollment. Rather than count students who transferred out of an institution as a failure, we exclude them from an institution’s completion rate. Therefore, only students who enroll and never transfer are included in the calculation.6
To examine economic outcomes, we use an earnings threshold that looks at the percentage of former students who earn more than the typical high school graduate (aged 25-34) 10 years after they initially enroll in an institution. The Department calculated the typical salary of a high school graduate at $31,000 per year for the measurement period used in this analysis.7 So, for example, if an institution had a cohort of 1,000 students and 750 of them were earning more than $31,000 10 years after enrolling, that institution would show an earnings threshold rate of 75%.8
To measure loan repayment outcomes, we use a dollar-based repayment rate for student borrowers who attended an institution. This tells us whether a cohort of students was able to effectively begin the process of paying down their education debt within five years of leaving the institution and entering repayment. If an institution shows a dollar-based repayment rate of over 100%, it indicates that their student borrowers now owe more on their loans than the amount they entered repayment with five years prior—in other words, their payments were less than the amount of interest accrued over this period. More information on each of these metrics can be found in the appendix of this report.
Four-Year Institutions
Overall, there are 1,823 institutions that predominantly award bachelor’s degrees in the US. The typical four-year institution enrolls around 1,794 students, which is similar to the median enrollment of two-year institutions but far more than certificate-granting institutions. They are generally more expensive than their counterparts and serve a more well-off population—though roughly one-third of students at these schools receive a federal Pell Grant, indicating they are from low- or moderate-income backgrounds. And while the time to earn a degree may be longer at a four-year institution and the overall cost may be greater, the payoff is also more substantial. Students who go on to earn a bachelor’s degree typically earn nearly 40% more than those with an associate degree.9
Quick Stats for Four-Year Institutions

College Completion
Most four-year institutions show strong completion rates, with 87% graduating the majority of students who pursue a degree. Over half (55%) graduate more than 75% of students who enroll. However, 214 four-year schools (12%) still leave most students degreeless, even eight years after entering the institution.

Completion at Four-Year Institutions by Sector
While the overall completion rates for four-year institutions are strong, outcomes can often vary by the sector of institution offering the degree. Nearly all four-year public (92%) and private non-profit (87%) institutions graduate the majority of students who enroll. And more than half of four-year public institutions (54%) and private non-profit institutions (58%) graduate more than 75% of their students. While there are fewer of them, four-year for-profit institutions tend to have poorer outcomes. Over half (53%) leave most of their students with no credential whatsoever, even eight years after entering the institution.

Earnings Outcomes
Students who attend a four-year institution are likely to earn more than if they hadn’t gone to college in the first place. Almost all (96%) four-year institutions see the majority of their students earning more than their peers with no college experience 10 years post-enrollment. And over half (52%) leave more than 75% of their students earning above this minimum economic benchmark.

Earnings at Four-Year Institutions by Sector
While the vast majority of four-year institutions show their students earning more than they would have if they had never attended, the typical earnings boost received varies by institutional sector. Generally, public and private non-profit colleges show better earnings outcomes than for-profit institutions. More than half (53%) of public and private non-profit four-year institutions see at least 75% of their students earning more than the typical high school graduate ten years after enrolling, in comparison to only 29% of for-profit schools showing the same result. However, almost all four-year colleges, regardless of the sector, show the majority of their students earning above this minimum economic threshold.

Loan Repayment
Most four-year institutions leave their students on a pathway to paying down their loans shortly after leaving. Seventy percent of four-year institutions see the majority of students able to begin the process of paying down their principal within five years of entering repayment. However, 496 four-year institutions (30%) leave their students unable to make sufficient payments to even cover their accumulating interest over this time.

Repayment at Four-Year Institutions by Sector
Consistent with earnings outcomes, we see public and private non-profit four-year institutions leaving their students with better loan repayment outcomes. The majority of public (66%) and private non-profit (75%) four-year institutions leave their students on a path to paying down their loan balance within five years of leaving the institution. Conversely, over two-thirds (69%) of four-year for-profit institutions leave former students unable to keep up with accruing interest on their loans, meaning they find themselves owing more than they did five years prior.

Summary
Most four-year institutions show the majority of their students completing college, earning a decent wage, and beginning to pay down their debt.
Eighty-seven percent of four-year institutions see the majority of their students completing their degree. But discrepancies emerge when breaking down completion by sector. Most public and private four-year schools graduate the majority of their students, but fewer than half (48%) of for-profit four-year institutions can say the same. Four-year schools also see good earnings outcomes—public, private non-profit, and for-profit four-year institutions all show 95% or more of their students earning more than the typical high school graduate. Because students see good earnings outcomes, they’re also more likely to start paying down their student debt faster. Seventy percent of four-year schools leave their students on a path to start paying down their loans within five years of leaving. Sixty-six percent of public and 75% of private non-profit four-year institutions show this outcome, but only 30% of for-profit four-year colleges can say the same. While four-year institutions broadly leave their students better off, there is still room for improvement.
Two-Year Institutions
There are 941 associate degree-granting institutions in the US, fewer than their counterparts that focus on awarding four-year degrees or shorter certificates. However, their enrollments trend larger, with nearly 2,000 students at each individual institution. They are often a more affordable up-front option than four-year institutions, with lower out-of-pocket costs and shorter timelines to complete a degree.
Quick Stats for Two-Year Institutions
College Completion
Two-year institutions graduate a smaller proportion of students than four-year colleges. Two-thirds (67%) leave over half of their students without a credential, even eight years after they enroll, and only 10% have more than 75% of their students completing within this timeframe. Eighty-two two-year institutions (9%) graduate fewer than one-in-four students who enter their doors.

Completion at Two-Year Institutions by Sector
While public institutions comprise much of the two-year landscape, they graduate a smaller proportion of those who enroll than other sectors. Only 19% of public two-year institutions graduate over half of their students eight years after enrollment, compared to 72% of private non-profit two-year institutions and 76% of for-profit two-year institutions. And while just over one-third (36%) of two-year private non-profit and for-profit institutions complete more than 75% of their students, only 2% of publics can say the same.

Earnings Outcomes
Even though completion rates at two-year schools are lower across the board than at four-year colleges, enrolling in a two-year school still often leads to some economic benefit for those who enroll. The vast majority (84%) show most students earning more than a high school graduate 10 years post-enrollment. However, many still fail to show a large proportion of their students doing so. Only 53 two-year schools leave at least three-quarters of their students meeting this minimum economic threshold (6% of two-years versus 52% of four-years).

Earnings at Two-Year Institutions by Sector
While fewer in number compared to other sectors, a higher proportion of private non-profit two-year institutions show their students with strong earnings after attending. Nearly a third leave over 75% of their students able to earn more than their high school graduate counterparts. Most public two-year schools also have reasonably strong earnings outcomes, with 87% leaving most of their students earning more than the typical high school graduate. Nearly a third (29%) of two-year for-profit institutions fail to meet this benchmark for the majority of their students.

Loan Repayment
In comparison to four-year institutions, two-year colleges are more likely to leave their students unable to pay down their loans over time—despite the fact at the up-front cost may have been lower. The majority (59%) show their student borrowers making payments that do not keep up with their accruing interest, meaning they actually owe more on their federal student loans than they did at the start, even five years after they’ve entered repayment.

Repayment at Two-Year Institutions by Sector
Regardless of institutional sector, many students who attend two-year colleges struggle to begin the process of paying down their loans after leaving. The majority of public (62%) and for-profit (52%) two-year institutions leave their students owing more on their educational debt five years after entering repayment, and 43% of private non-profit two-year institutions show the same. As noted above, these outcomes metrics are intertwined: given the low completion rates at these institutions, it follows that many students who enroll may find themselves without a degree and struggling to repay their loans.

Summary
Overall, two-year institutions see low rates of college completion, middling earnings outcomes, and subpar student debt repayment rates after five years.
Sixty-seven percent of two-year institutions don’t graduate the majority of their students. Most non-completers attended public two-year institutions, 80% of which fail to graduate the majority of their students, compared to 30% of private non-profit and 24% of for-profit two-year institutions. Despite low completion rates, most students attending two-year schools see reasonable earnings outcomes, with 84% percent of two-year institutions leaving most of their students earning more than the typical high school graduate. Private non-profit two-year schools see more of their students meeting this threshold, but two-year schools across all sectors see the majority of their students earning more than the typical high school graduate. Yet despite those numbers, only 41% of two-year institutions see the majority of their students able to start paying down their student debt five years into repayment. The issue is more pronounced at public and for-profit two-year schools, where only 37% and 48% of institutions, respectively, see their students meeting this threshold. Private non-profit two-year colleges perform a bit better, with 57% seeing their students start to pay down their debt.
Certificate-Granting Institutions
Certificate-granting institutions offer non-degree programs that are designed to help students acquire a specific set of technical skills needed to enter a profession. These non-degree credentials typically take between six and 18 months to complete. There are far more certificate-granting institutions than there are four-year or two-year institutions, though each institution serves far fewer students, with a median enrollment of 143 students across the sector. And while these programs are shorter than those offered at two-year institutions, they cost about $6,000 more per year (nearly double) compared to the cost of attending a two-year school. Despite this price difference, certificate-granting institutions enroll more Pell recipients than either four-year or two-year institutions.
Quick Stats for Certificate-Granting Institutions

College Completion
Certificate-granting institutions offer programs that take less time to complete, so not surprisingly, they produce completion outcomes that are better than two-year institutions—though they still lag behind four-year schools. Fifty-five percent of certificate-granting institutions see the majority of their students completing their credential within eight years of enrollment. Yet only 89 schools (18%) show over 75% of students who enter leaving with a credential in hand.

Completion at Certificate-Granting Institutions by Sector
Similar to two-year institutions, public certificate-granting institutions underperform those in the private non-profit and for-profit sectors. Only 30% of public colleges leave the majority of their students with a credential compared to 84% of private non-profit and 85% of for-profit certificate-granting institutions, respectively.

Earnings Outcomes
While certificate-granting institutions are more likely to leave their students with a credential than their two-year counterparts, the majority show their students earning less than a high school graduate after they attend. Only 46% of these institutions see most of their students earning more than this minimum economic benchmark, indicating that a credential from some of these institutions does not reliably lead to income gains—despite their purported career orientation.

Earnings at Certificate-Granting Institutions by Sector
Even though more certificate-granting institutions in the public sector fail to leave their students with a credential, they are still more likely to deliver better employment outcomes than those in the for-profit sector. The large majority of public (67%) and private non-profit (65%) see most of their students earning more than the typical high school graduate. But nearly three-in-four (74%) for-profit schools that primarily award certificates leave the majority of their students failing to meet this threshold, even 10 years after enrollment. While fewer in number (135), private non-profit certificate-granting institutions generally perform better. Forty-four percent of private non-profit institutions leave more than 75% of their graduates earning more than the typical high school graduate, compared to just 3% of public and for-profit institutions.

Loan Repayment
While most certificate-granting institutions see their students beginning to pay down their debt after five years, more than four out of 10 (42%) leave their students owing more debt than they had when they left school five years prior. In fact, only 7% show their student borrowers able to pay down over 25% of the initial principal on their loan balance over this time.

Repayment at Certificate-Granting Institutions by Sector
While less prevalent, private non-profit certificate-granting institutions show better loan repayment outcomes than public and for-profit institutions. Seventy-four percent leave students able to make a dent on their loan principal within five years of entering repayment, in comparison to 53% and 59% of public and for-profit institutions, respectively. While every sector shows the majority of institutions enabling students to begin the process of loan repayment, there is substantial room for improvement for those that focus on awarding short-term credentials.

Summary
Certificate-granting institutions see average completion rates, poor earnings outcomes, and middling loan repayment outcomes.
Fifty-four percent of certificate-granting institutions show the majority of their students graduating, which still leaves a large number of non-completers. Most of the institutions failing to meet this threshold are in the public sector—69% of public certificate-granting institutions fail to graduate the majority of their students, compared to just 16% of private and 15% of for-profit institutions. Fifty-four percent of certificate-granting institutions leave the majority of their students earning less than the typical high school graduate. For-profit institutions see the worst earnings outcomes, with 74% of institutions leaving most of their students unable to meet this threshold, compared to 33% of public and 35% of private non-profit certificate-granting institutions. Still, most students who attend these schools are able to start paying down their loans after five years—58% of certificate-granting institutions show their students making progress on their debt within that time period. The majority of certificate-granting institutions in all sectors meet this repayment threshold, with private non-profit institutions slightly outperforming their counterparts.
Conclusion
Examining completion, earnings, and loan repayment outcomes across US institutions of higher education reveals significant room for improvement in delivering on the promise of a postsecondary degree. While some credential levels or institutional sectors typically deliver better outcomes for students, too many schools leave too many students with no degree, high debt, and limited employment opportunities—making it difficult to recoup their educational costs or see a return on their investment. To ensure that students are served well and that the considerable taxpayer dollars flowing into our higher education system only go to high-quality programs, policymakers in Congress and the Department of Education must remain focused on instituting incentives and guardrails that promote better outcomes and more informed student choice—not continuing to send blank checks to schools that consistently leave students worse off than when they enrolled.
Appendix
|
Category |
Details |
Measurement year |
Source |
|
Undergraduate Enrollment |
Enrollment of undergraduate certificate/degree-seeking students |
Fall 2020 |
Accreditor Data File: https://sites.ed.gov/naciqi/files/2022/06/Accreditor-Data-File-Updated-Summer-2022.xlsx |
|
Net Price |
Average net price among undergraduate students receiving Title IV grants or loans |
Academic Year 2019-20 |
Accreditor Data File: https://sites.ed.gov/naciqi/files/2022/06/Accreditor-Data-File-Updated-Summer-2022.xlsx |
|
Outcome Measure |
Share of all entering undergraduate students (including part-time and non-first-time students) that completed college within eight years and never transferred to another institution. |
Academic Year 2020-2021 |
Accreditor Data File: https://sites.ed.gov/naciqi/files/2022/06/Accreditor-Data-File-Updated-Summer-2022.xlsx |
|
Earnings Threshold |
Percent of Title IV undergraduate students earning at least $31,000 10 years after entering the institution |
Treasury AY2007-08, AY2008-09 pooled cohort measured in CY2018, CY2019, inflation adjusted to 2020 dollars |
College Scorecard (Treasury): https://collegescorecard.ed.gov/data |
|
Dollar-based repayment rate |
Ratio of the balance owed on loans 5 years after entering repayment to the original loan principal amount. |
Award year 2018-19 and 2019-20 (2-year pooled) |
Accreditor Data File: https://sites.ed.gov/naciqi/files/2022/06/Accreditor-Data-File-Updated-Summer-2022.xlsx |
Endnotes
Carnevale, Anthony P., et al. “The College Payoff: More Education Doesn’t Always Mean More Earnings.” Georgetown University Center on Education and the Workforce, 2021. https://cew.georgetown.edu/cew-reports/collegepayoff2021/. Accessed 24 Jan 2023.
Falk, Gene, et al. “Unemployment Rates During the COVID-19 Pandemic.” Congressional Research Service, 20 Aug 2021. https://sgp.fas.org/crs/misc/R46554.pdf. Accessed 24 Jan 2023.; “Occupational Outlook Handbook.” U.S. Bureau of Labor Statistics, 8 Sept 2022. https://www.bls.gov/ooh/. Accessed 24 Jan 2023.
“Archive of Meetings.” National Advisory Committee on Institutional Quality and Integrity, U.S. Department of Education, 2022. https://sites.ed.gov/naciqi/archive-of-meetings/. Accessed 24 Jan 2023.
“College Scorecard.” U.S. Department of Education. https://collegescorecard.ed.gov/data/. Accessed 24 Jan 2023.
“Integrated Postsecondary Education Data System.” National Center for Education Statistics. https://nces.ed.gov/ipeds/. Accessed 24 Jan 2023.
For more information on why we excluded transfer students, please see: https://medium.com/@ThirdWayTweet/the-most-complete-way-to-measure-college-completion-with-current-data-d3c9d2b78914.
The typical salary of high school graduates can vary significantly by state. For example, the typical salary of a high school graduate may be lower in Kentucky than it is in Connecticut. While this analysis aims to give a general overview of the economic outcomes of college attendees, this should be considered when assessing the economic outcomes for individual institutions. For information on how the earnings threshold was calculated by the Department, please see: https://collegescorecard.ed.gov/assets/InstitutionDataDocumentation.pdf.
Subscribe
Get updates whenever new content is added. We'll never share your email with anyone.