Report Published March 18, 2016 · Updated September 13, 2017 · 19 minute read
A Dollar Short: What’s Holding Women Back from Equal Pay?
Emily Liner
Takeaways
- Newly released data from the U.S. Census Bureau shows that women working full-time earned 80% of what men working full-time earned in 2016. This figure, frequently cited as 80 cents to the dollar, is real.
- 2015 hourly wage data show a pay ratio of 86 cents, indicating that the pay gap cannot be fully explained by the fact that men tend to work more hours than women.
- The pay ratio worsens from 90 cents to 82 cents as women move from the early to middle stages of their careers.
- Occupations with more female workers pay less than those with more male workers, by a ratio of 85 cents to the dollar, in 2015.
- Women still make less than men after accounting for differences in job type, job level, experience, education, hours worked, and location—which proves bias in the workplace also contributes to the gender pay gap.
- A single fix alone will not close the gap; rather, it will require targeted solutions to its various causes.
For decades, the gender pay gap has been expressed as cents to the dollar—a way to represent women’s wages relative to men’s. In 2016, women reached a new high in pay equity. That’s the good news. The bad news is that it was 80 cents to the dollar.1
If that doesn’t sound like much progress, that’s because the ratio of women’s to men’s earnings cleared 70 cents back in 1990. Progress since then has amounted to less than a dime. And it’s even worse for women of color. In 2016, black women earned 70% of what men overall earned, and Hispanic women earned 61% compared to men overall.2
But the existence of the gender pay gap cannot be chalked up to a singular factor. There are a myriad of obstacles that women face which add up to this stubborn shortfall: caregiving expectations that limit women’s hours at work and men’s time at home, pay gains that disappear as women age, wage differences between traditionally male and female jobs, and plain old wage discrimination against individual women. These different ways of looking at the pay gap and how it is measured may yield fresh insights into how public policies can narrow it.
80 Cents: The Headline Gender Pay Gap Is Instructive but Incomplete
What’s going on:
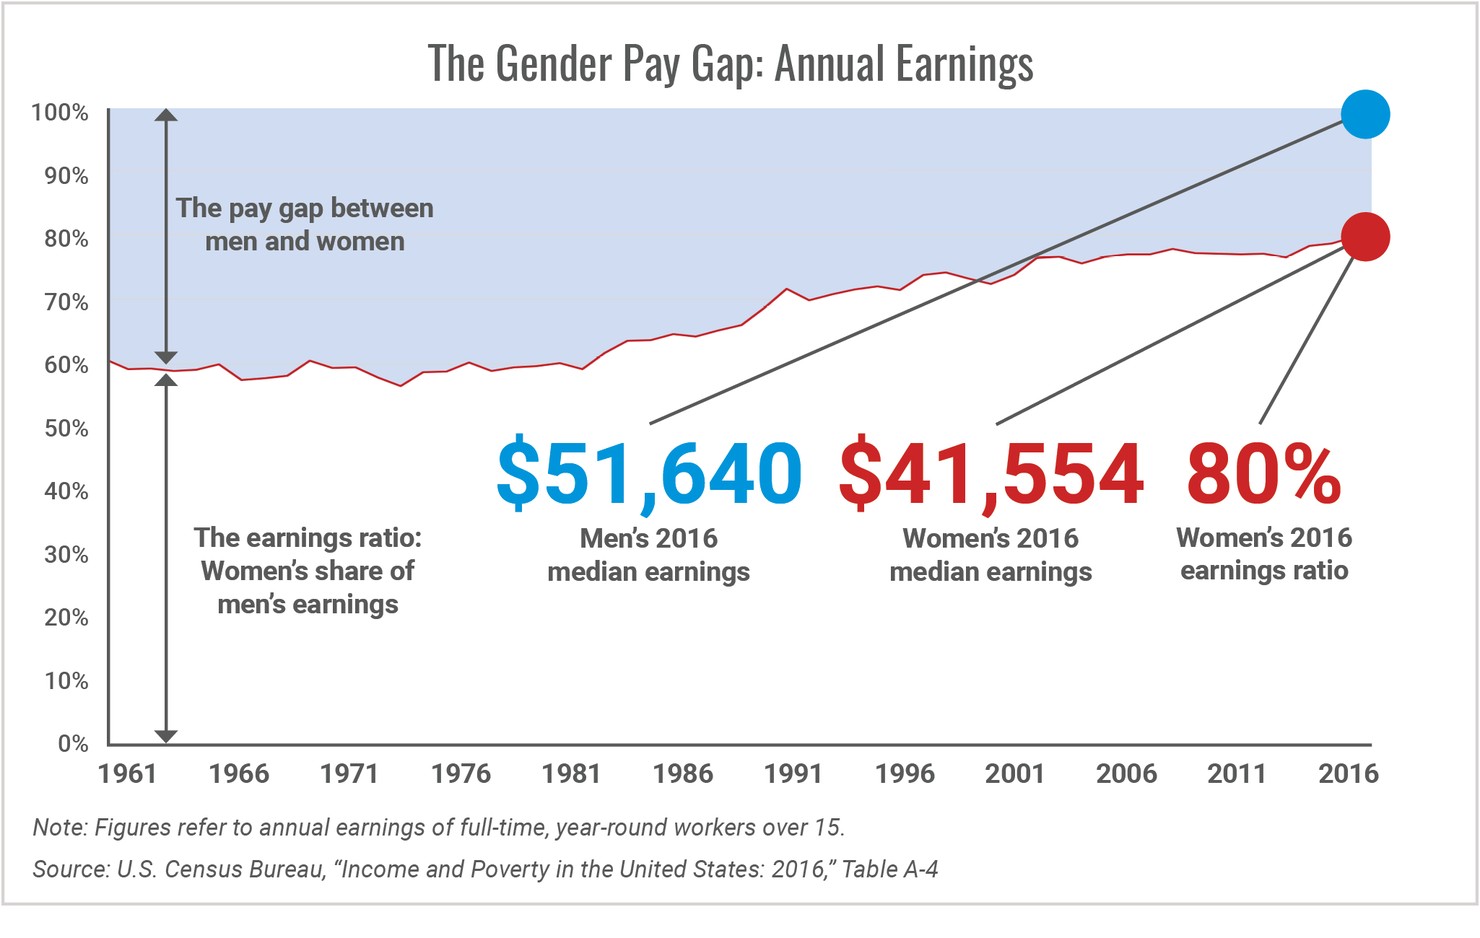
Based on median annual earnings of all year-round workers who usually work 35 or more hours per week, women make 80 cents on the dollar, or 80%, of what men make. Although this figure does not account for differences in type of work, it is useful for comparing the magnitude of the gender pay gap over long periods of time.
First things first: Where does 80 cents to the dollar come from? This is how it’s calculated.
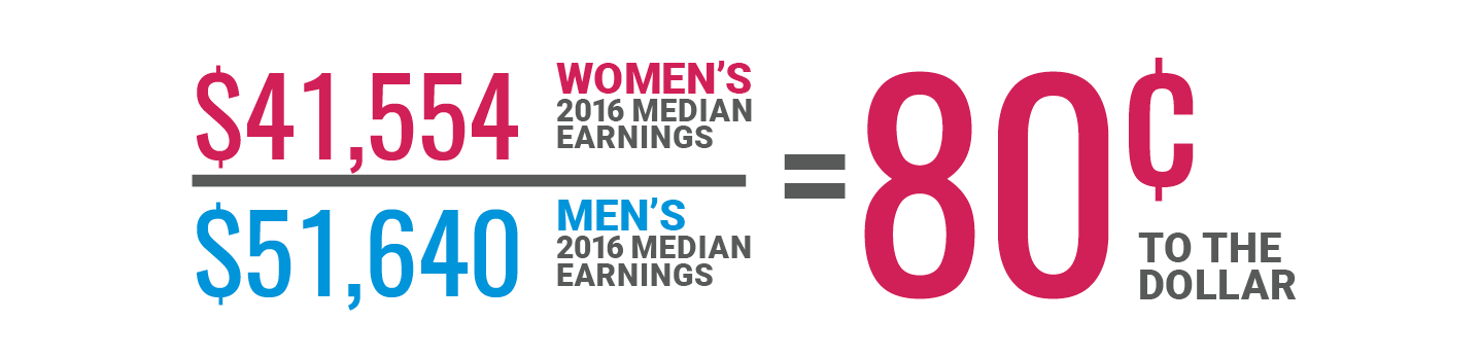
Every year, the Census Bureau surveys 98,000 U.S. households in the Current Population Survey’s Annual Social and Economic Supplement (CPS ASEC). This survey gathers information about earnings among full-time, year-round workers over the age of 15.3 This is where we get the “80 cents to the dollar” pay gap figure so often cited in news reports. It is the result of dividing median female annual earnings ($41,554 in 2016) by median male annual earnings ($51,640).4
This statistic is both instructive and incomplete.
For example, we can note important trend lines. In the ‘60s and ‘70s, the gender pay gap stagnated. Then two important things happened. First, in 1978, women’s labor force participation reached 50% for the first time.5 Then, in 1979, women began to exceed men in college enrollment, a trend which has continued every year since.6 Around that time, the gender pay gap began to shrink at a much faster rate, narrowing by a substantial nine cents in the ’80s. Then progress slowed again, as women gained only four cents in the ’90s and five cents in the ’00s.7
But there is a lot this blunt statistic doesn’t account for. Although it shows us that women do not make as much as men, it does not explain why. To do that, we need to consider each contributing factor in isolation.
To illuminate various ways of analyzing the gender pay gap, we now turn to wage data measured by hourly rates, age, and occupation. This data is compiled by the U.S. Bureau of Labor Statistics, which will release 2016 annual data later this year. The following data, therefore, comes from 2015.
86 Cents: Hourly Wages Show a Significant, Though Smaller, Pay Gap
What’s going on:
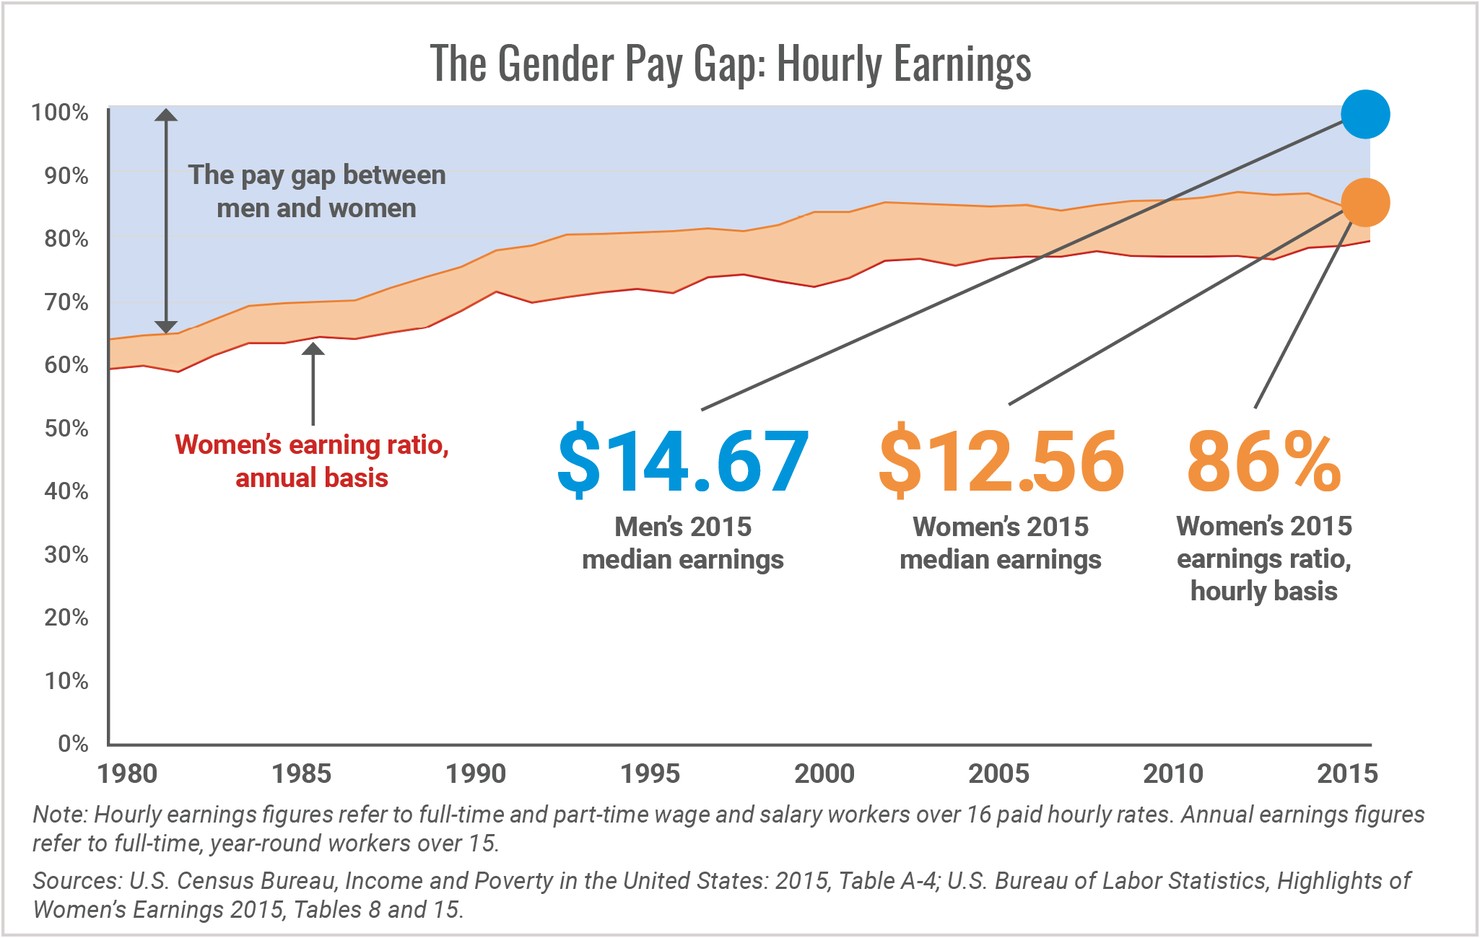
The orange line in this chart introduces a new way to measure the women’s earnings ratio: hourly rates. This allows us to compare the base pay of women and men for the 60% of American workers, both full-time and part-time, who are paid by the hour. While the annual earnings ratio only includes full-time workers, it is affected by time spent at work—and even among full-time workers, men put in more hours at work each week. This is why the annual pay gap, represented by the red line, is wider.
Another way to look at the gender pay gap is to zoom in on hourly wages. This information is provided by the Current Population Survey (CPS), a survey of 60,000 U.S. households conducted monthly by the Census Bureau. The Bureau of Labor Statistics (BLS) uses the results of the CPS to create the household section of the monthly Employment Situation Report, also known simply as the Jobs Report. In 2015, hourly data showed a gender pay gap of 14 cents—about six cents narrower than the gap for all workers that year.
Why is the hourly wage gap (the orange line) always smaller than the overall pay gap? Using hourly earnings instead of annual earnings reduces the effect of a major variable between working men and women: time spent at work. And this makes a difference because men are more likely than women to work a 40-hour week and to put in overtime.8 No doubt, gender expectations about child and elder caregiving roles contribute to these discrepancies.
Granted, this measurement has drawbacks. Hourly earnings datasets don’t include jobs that pay on salary or commission, like management and professional jobs, which make up two-fifths of the U.S. economy.9 Therefore, lower-skilled, lower-paying jobs tend to be over-represented—and jobs that pay closer to the minimum wage tend to have less of a gender pay gap because of the existence of a pay floor. Hourly wage data also don’t account for the types of jobs that men and women hold and whether there is a built-in wage bias on behalf of males. And they don’t account for differences that may result from work experience, educational attainment, seniority, and other variables.
Despite these issues, analyzing earnings data in smaller increments provokes important questions about the gender pay gap. To put more salaried, professional workers into the comparison, we can look specifically at those who usually work 40 hours per week. Yet even in this group of workers, women made 88 cents to the dollar.10 If these women and men are putting in the same amount of time on the job, other factors must be contributing to the gap.
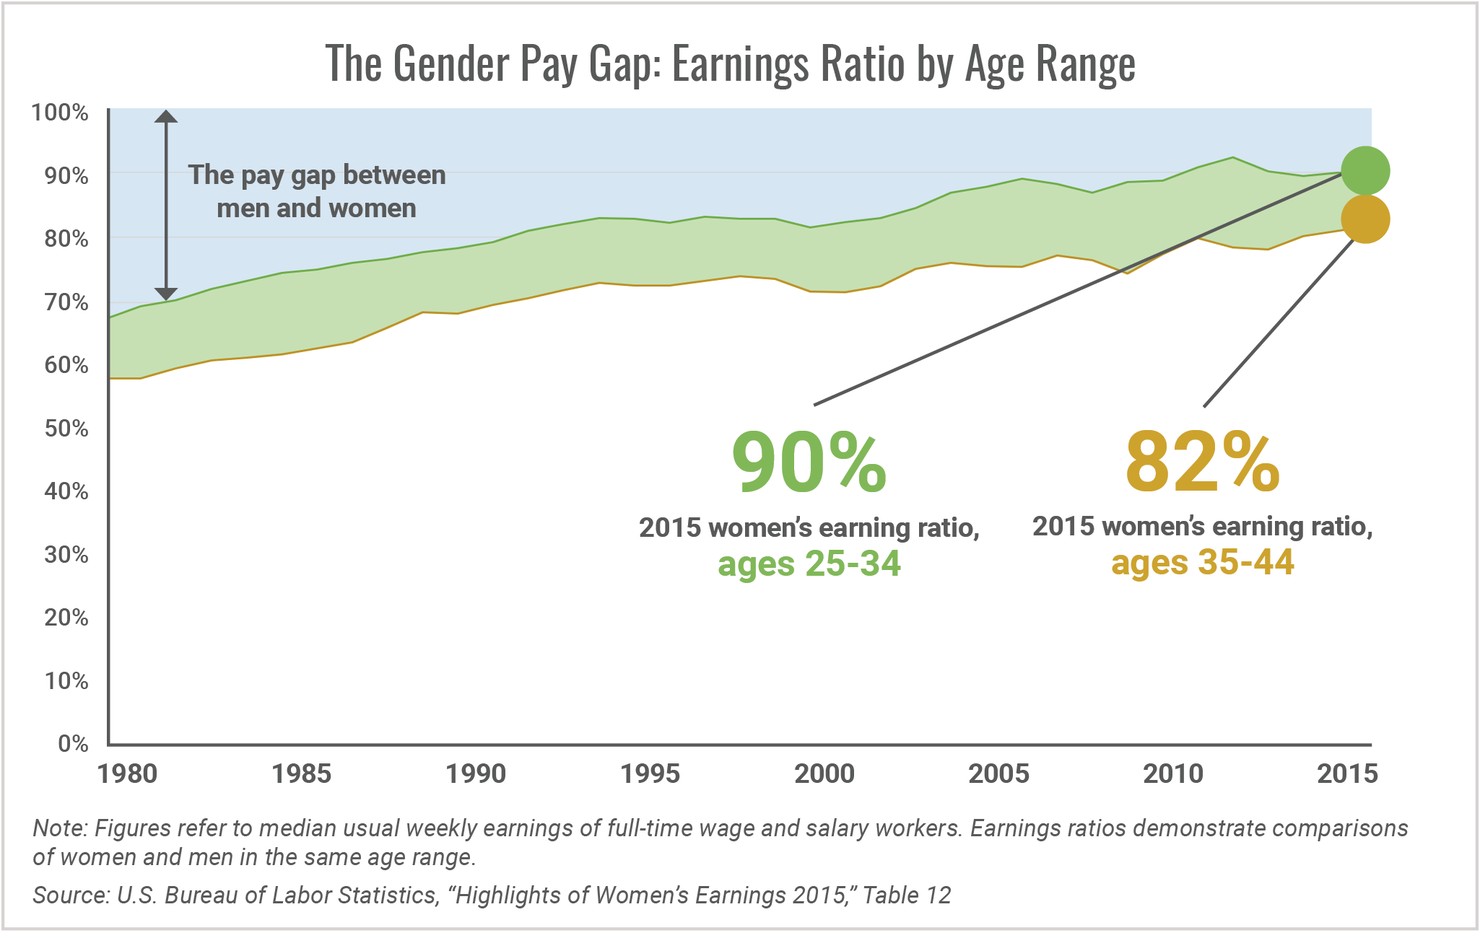
90 Cents to 82 Cents: The Pay Gap Widens Mid-Career
What’s going on:
A woman in the early stages of her career currently makes 90 cents on the dollar—a vast improvement from 35 years ago, when early-career women made 68 cents on the dollar. Although women in the middle of their careers face a bigger pay gap, they have similarly made gains over time.
Yet women today experience a bigger gap as they progress through their careers. The same woman who makes 82 cents on the dollar as a 40-year-old in 2015 would have made 89 cents on the dollar as a 30-year-old in 2005.
The gender pay gap comes into stark focus when comparing women at different career stages. This chart shows the ratio of earnings for full-time workers in two broad age groups: 25- to 34-year-olds, which we can call early-career women, and 35- to 44-year-olds, or mid-career women. Looking at the green line for early-career women, we see a familiar pattern. The gap they faced narrowed from 68 cents in 1979 to 92 cents in 2011 before falling back slightly to 90 cents today.
For mid-career women, represented by the gold line, the gap has also narrowed over the decades. Women in that group made only 58 cents to the dollar in 1979, and now they earn 82 cents. But the pay gap for mid-career women is nearly double that of early-career women, even today. And it stays wide as women age. In 2015, the pay gap clocked in at 77 cents for 45- to 54-year-olds and 74 cents for 55- to 64-year-olds.
Here’s how to think about what’s causing the gap to widen for women in their 30s. Some of this discrepancy is explained by the time period when those individuals entered the work force. For example, Baby Boomers who started working in 1979 faced a tougher work environment for women than Millennials who have just started their first jobs.
But much of the remaining discrepancy can be attributed to the effects of marriage and childbirth. In 2015, women (regardless of age) who had never been married made 91% of what never-married men made on a weekly basis. But never-married women represent only 28% of women who work full-time.11 Although two frequently cited private studies have found evidence of women who have equaled and even outearned men, they apply to even smaller segments—young, single women without children, who typically have less work-family conflict.12
In contrast, married women who work full-time make just 78% compared to married men who work full-time, and working mothers make 74% of what working fathers earned (regardless of marital status).13 Unfortunately, single mothers are affected disproportionately, and they face the added dilemma of paying for childcare or leaving their children unattended.14
This is the heart of the problem: When families begin to form, cultural expectations often still dictate that women step back at work while men keep their feet on the gas pedal. Even as recently as 2013, a Pew poll found that 51% of Americans believed that children are better off with a mother who stays at home, while only 34% say they are just as well off if a mother works. For men, those expectations are wildly different—only 8% said children are better off with a father who stays at home.15
These beliefs contribute to the gender pay gap. A study by Professor Michelle Budig of the University of Massachusetts at Amherst found that women who return to the labor force after having children face a wage penalty of 4% per child that cannot be explained by other factors. Working men with children, however, experience a “fatherhood bonus” of 6%, regardless of the size of their brood.16
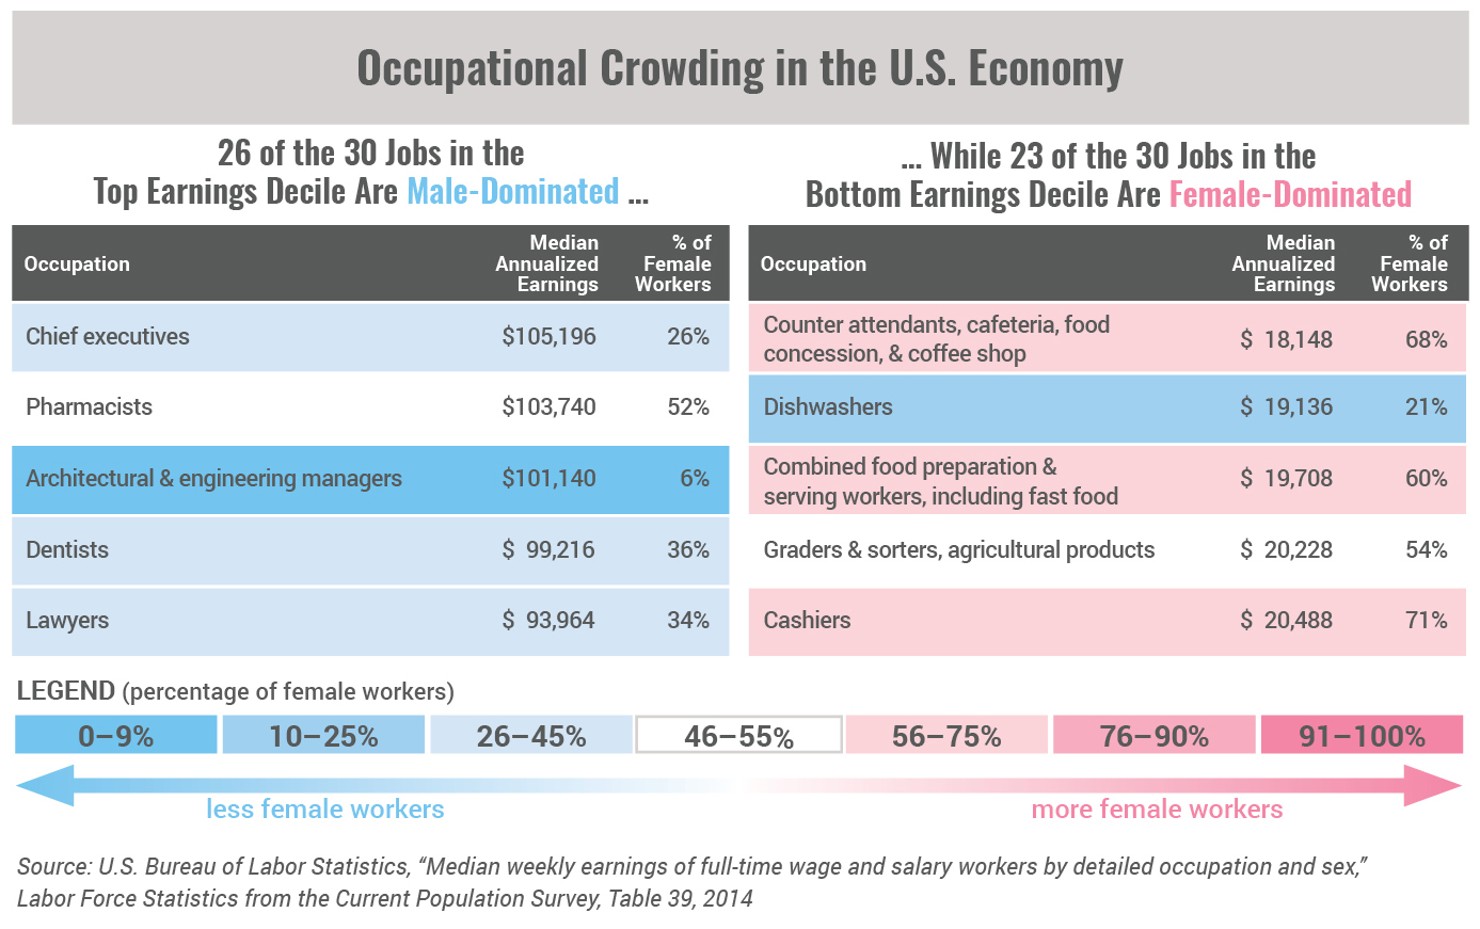
83 Cents: Male-Dominated Jobs Are Higher-Paying Jobs, Regardless of the Worker’s Sex
What’s going on:
This chart snapshot from 2014 shows the five highest-paying occupations on the left and the five lowest-paying occupations on the right. As the preview demonstrates, the highest-paying jobs tend to have mostly male workers, while the lowest-paying jobs tend to have mostly female workers. See the appendix for the full chart.
In general, female-dominated occupations pay less than male-dominated occupations. The average median weekly pay of all workers (male and female) in occupations with more than 50% female workers ($827) is about 15% lower than the average median weekly pay for all workers in occupations with more than 50% male workers ($974).17
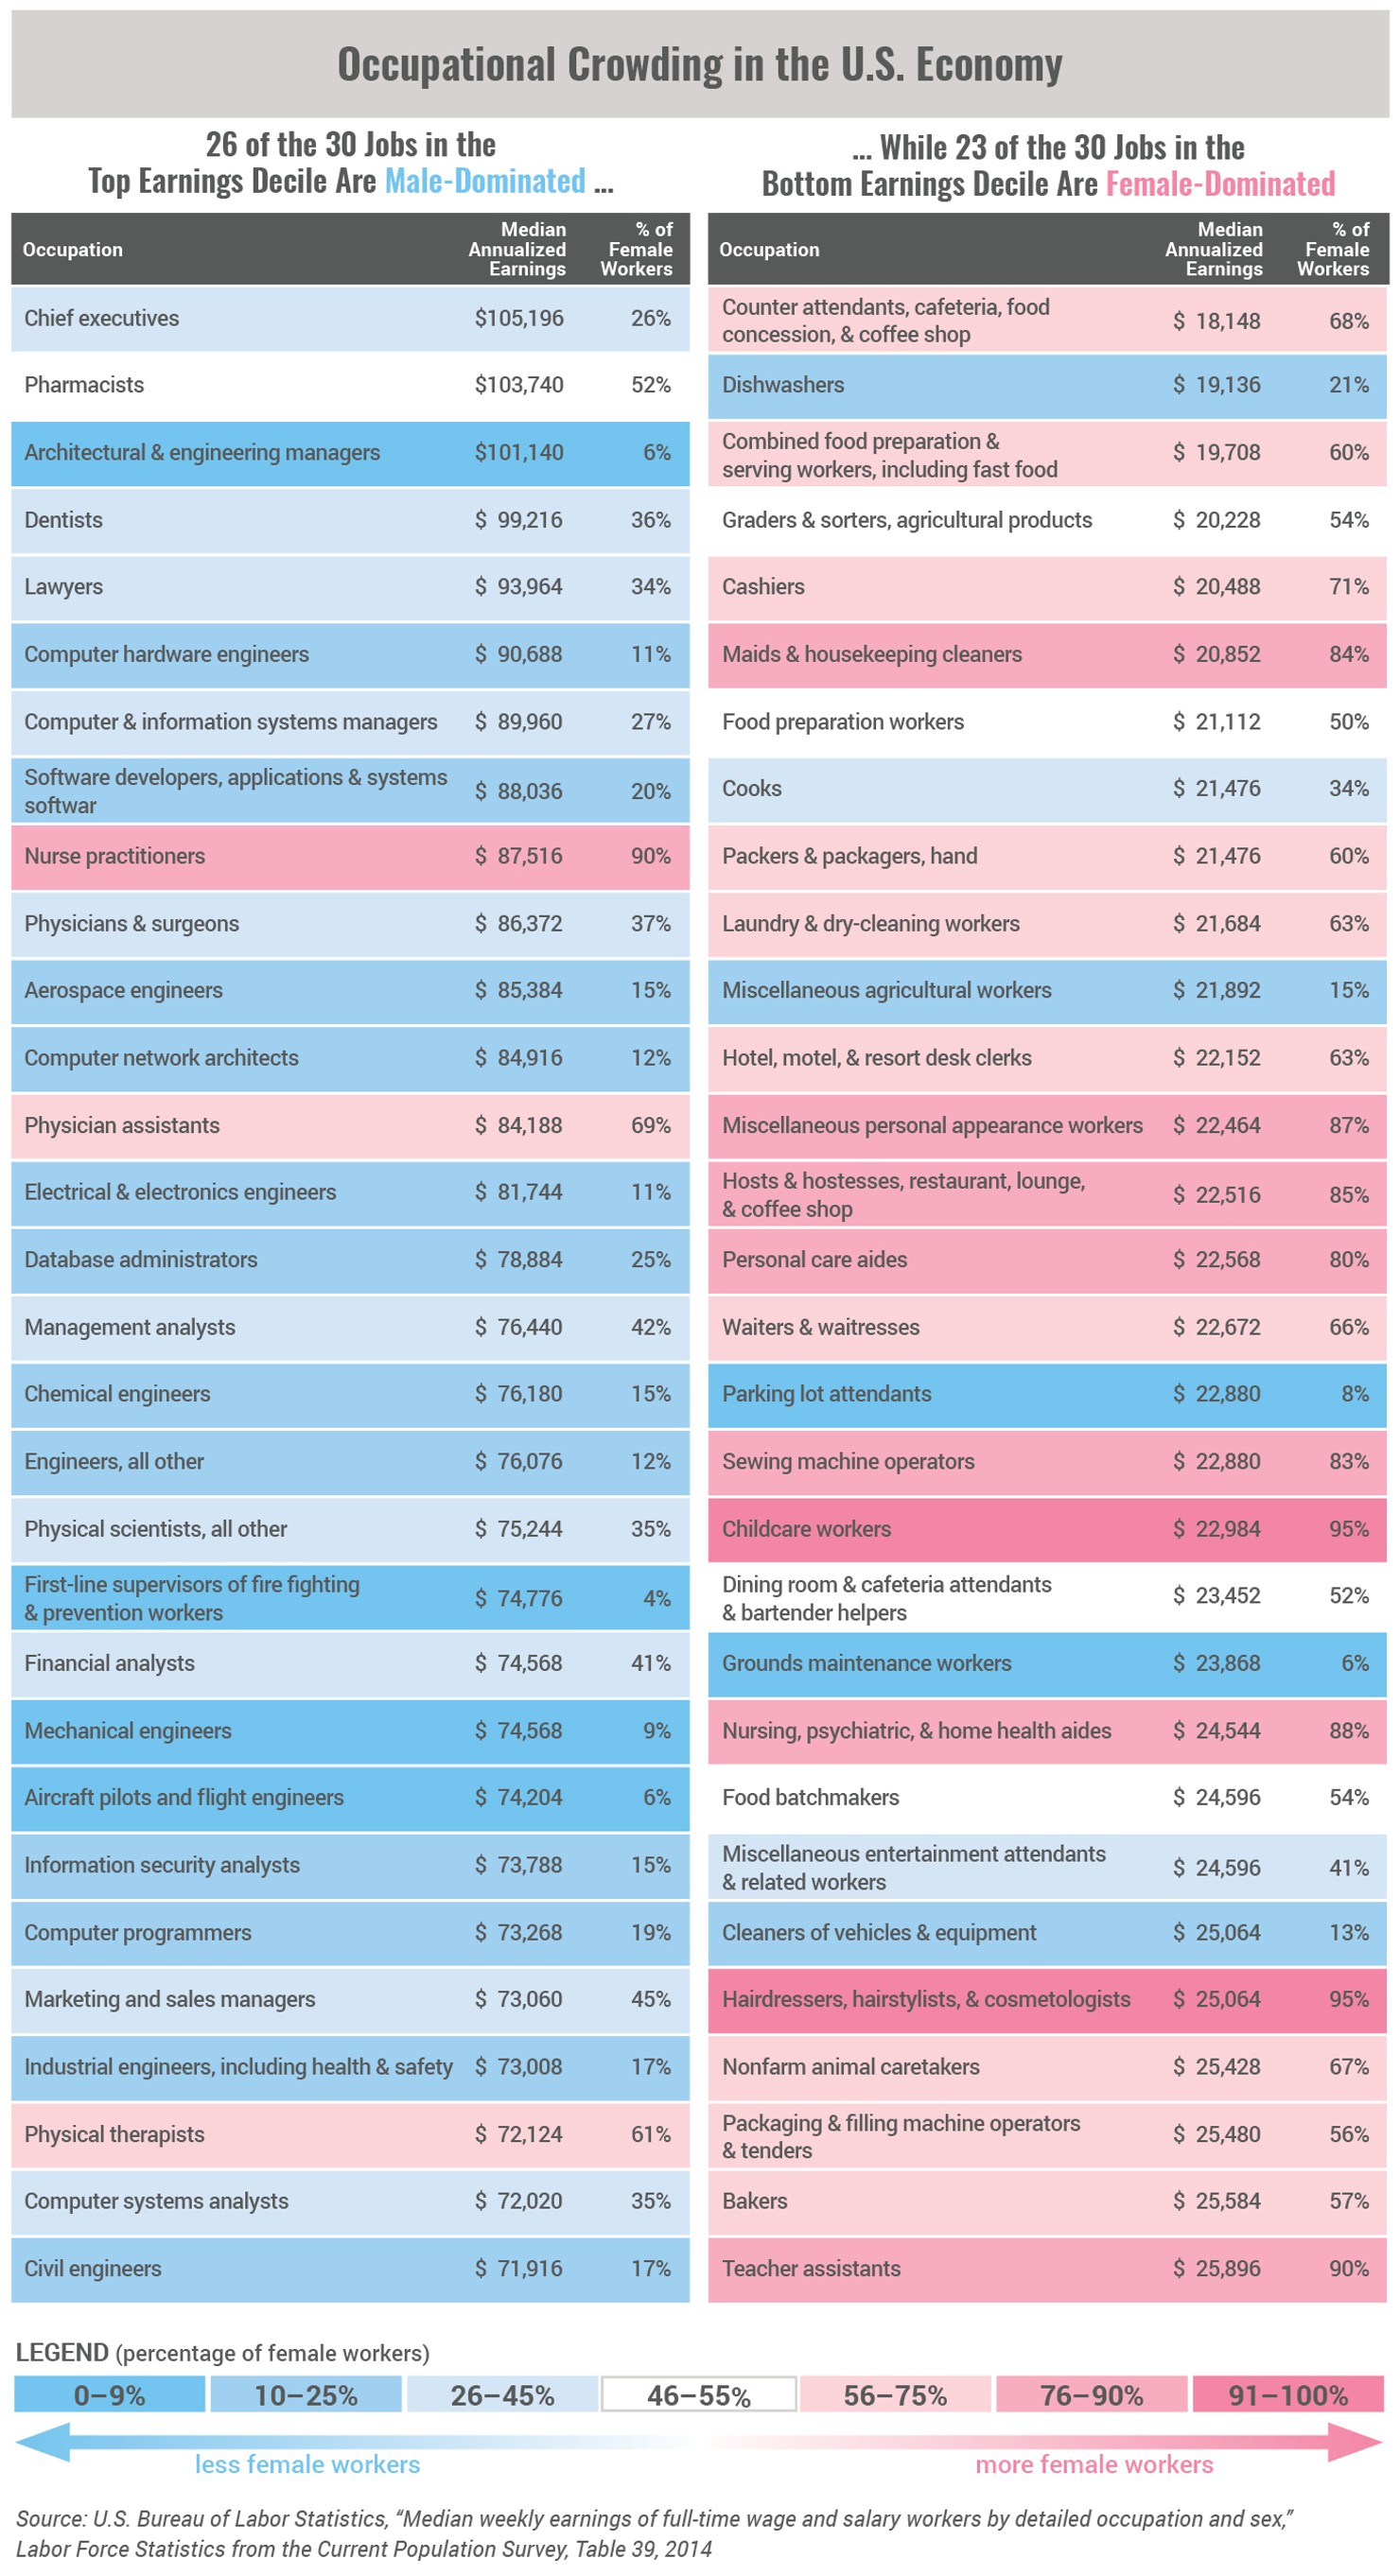
Women are overrepresented in support roles, teaching, and caregiving, yet the compensation for these jobs do not fully reflect the social value they provide. More than two million women are employed in each of the top three occupations for women: secretaries and administrative assistants, elementary and middle school teachers, and registered nurses. None of these professions cracks the top decile in occupational pay.18
Men, meanwhile, tend to work in different fields. In these three occupations, for example, men’s employment tops out at 124,000 for secretaries and administrative assistants, 543,000 for elementary and middle school teachers, and 278,000 for registered nurses. Furthermore, men vastly outnumber women in engineering and computer science, from pilots and flight engineers (8% female) to web developers (35% female).19 This gender-sorting phenomenon has been called occupational crowding.20
Are female-dominated occupations compensated at a lower level because labor markets price those jobs below the occupations that are dominated by men? Or are there longstanding biases about the worth of the types of work that men have traditionally done versus women? For example, maids and housekeeping cleaners, who are 85% female, make 14% less than cleaners of vehicles and equipment, who are 90% male—even though these occupations are generally analogous. Similarly, cashiers, who are 69% female, earn 16% less than parking lot attendants, who are 86% male.21
Even within occupations, women and men still take home different paychecks. Of 120 occupations, men out-earn women in 116 of them.22 In the occupation with the biggest discrepancy between men and women, male personal financial advisors make $705 more than women on a weekly basis, for an annualized difference of $36,660. (Bonuses, which are not captured by weekly data, could result in different estimates for the annual gender gap.)23 Although CPS data does not account for hours worked, years of experience, or job title or specialty within occupations, there is still a consistent gender pay gap no matter what jobs women and men choose to pursue.
The Unexplained Pay Gap Indicates Workplace Bias
Even though much of the pay gap is attributable to differences in hours worked, the effects of family formation, and occupational choice, there remains a gap that cannot be attributed to observable factors. That’s the unexplained gap, and it is the strongest evidence of direct gender discrimination within individual workplaces, happening to individual women on a daily basis.
Estimates of the unexplained gap vary, but there is evidence that it has gotten smaller over the decades. Cornell professors Francine Blau and Lawrence Kahn’s January 2016 paper finds that the unexplained portion of the pay gap fell from 23 cents on the dollar in 1980 to nine cents in 2010.24 Some private studies have found even smaller estimates of the unexplained gap. A 2007 study commissioned by the Department of Labor found an unexplained gap of five to seven cents on the dollar.25 More recently, analyses by companies that collect self-reported salary data have also found evidence of a small unexplained gap. On Glassdoor, it was 5%, and on PayScale, it was 2%.26
Regardless of the size of the unexplained gap, each of these studies show that it continues to exist—and there is a growing body of research that documents specific episodes of bias against women.
- Getting hired: In two studies, when participants reviewed resumes that were exactly the same except for the names—which sounded either male or female—the applicants with male names were more likely to get a job offer.27 After orchestras in the U.S. instituted blind tryouts, women were 50% more likely to get past the first round.28
- Negotiating promotions: Several academic studies have shown that women are less likely than men to ask for promotions. But even that behavior may stem in part from bias, as women who negotiate are perceived as more demanding and difficult to work with—by both their male and female colleagues.29 Furthermore, women tend to receive less challenging assignments than men, and women tend to be harder on themselves in self-evaluations.30
- Reaching the top: As of January 2017, there were just 26 female CEOs in the S&P 500.31 Making matters worse, women at the highest levels still face obstacles to equal pay and equal treatment. A new study from the New York Fed found that female executives receive less than 10% of what male executives receive for improving their firms’ value, and they are penalized more than men when their firms perform poorly.32
Conclusion: Closing the Gap
For our society to achieve gender equality and for our economy to reach its full potential, we need to close the entire 20-cent gap. That effort must include policies that ensure employers are not systematically paying women less than men for equal work—and not treating women any differently when they negotiate.
But if we focus only on workplace discrimination, we’re going to miss other sources of the problem—and we will come up short. Ending the gender pay gap will require a multi-pronged approach with policy solutions targeted at multiple problems with laser-like precision.
First, there are gender differences in hours spent at work. Solving this problem requires a focus on family leave and work-life balance so that women and men can put in the same amount time both at work and at home. When new parents are considering which partner will stay home to care for a child, an employer’s policy should not make the gender of the parent part of the equation. To accomplish this, legislation can modernize family leave policy, and workplaces can take it upon themselves to offer more leave than the bare minimum—which not only improves the quality of life for their employees, but also makes these companies more competitive in the marketplace for top talent.
Second, there is the reality that 27% of children live in households with a single parent.33 These women—and sometimes, men—cannot share work and childcare duties with a partner. But families and the economy benefit when these workers are just as successful in their careers as workers from two-parent households. That means childcare must be far more accessible and affordable than it is today.
Third, our economy would benefit tremendously if workers were to select careers—and employers were to select workers—based only on talent and interest, and not on gender norms or stereotypes. That only 14% of computer hardware engineers are women signifies a huge lost opportunity for innovation in computing. Similarly, attracting more men to primary education, which is only 19% male, would increase the talent pool of teachers and give kids a more diverse learning experience.34 Solving occupational crowding, though, will require a broad set of solutions, from getting girls interested in STEM fields at a young age, to employers proactively recruiting workers of an underrepresented gender and rooting out behavior that drives women out of male-dominated workplaces.
Just as there is no single number to fully represent the pay gap, there is no single fix. Achieving gender pay parity will require both determination and creativity among policymakers, employers, workers, and educators alike.
Appendix: Occupational Crowding in the U.S. Economy, 2014
Appendix: Studies of the Gender Pay Gap
U.S. Bureau of Labor Statistics, “Highlights of Women’s Earnings,” Annual Report
Since 1998, the BLS has produced this report comparing women’s and men’s earnings by age, race and ethnicity, education, occupation, hours worked, marital and parental status, and other factors. Many of the data sets are reported as far back as 1979. The 2015 edition found a gender pay gap of 19% using weekly earnings and 14% using hourly earnings.
The American Association of University Women, “The Simple Truth about the Pay Gap,” Semi-Annual Report
The AAUW has produced a number of reports looking at the pay gap, with a focus on outcomes for college graduates. It has found a 7% unexplained gender pay gap between male and female college graduates one year after college graduation, which grows to 12% 10 years after college graduation.
Francine D. Blau and Lawrence M. Kahn, “The Gender Wage Gap: Extent, Trends, and Explanations,” 2016
These two Cornell professors have written extensively on gender and economics. Their latest research finds that unexplained factors made up 38% of the overall pay gap between women's and men's earnings in 2010, compared to 49% in 1980.
Glassdoor, “Demystifying the Gender Pay Gap: Evidence from Glassdoor Salary Data,” 2016
Glassdoor analyzed self-reported salary data and found a 24% overall gender pay gap. After controlling for education, experience, job title, and employer, the unexplained pay gap was 5%. Glassdoor found that the biggest driver of the pay gap is the sorting of men and women into different occupations and industries; this alone explained 54% of the overall pay gap.
PayScale, “Inside the Gender Pay Gap,” 2016
PayScale, a website that collects self-reported salary data, found a 24% raw gender pay gap, in line with other estimates. But the controlled gender pay gap was 2%, the lowest estimate thus far. This discrepancy may be because the respondents do not comprise a random sample of the U.S. population.
Claudia Goldin, “A Grand Gender Convergence: Its Last Chapter,” 2014
In her presidential address to the American Economic Association, Goldin discusses the trajectory of the gender pay gap thus far and argues that the remaining pay gap between women and men is the result of compensation structures that “disproportionately reward” individuals who work continuous hours.
CONSAD Research Corporation, “An Analysis of Reasons for the Disparity in Wages Between Men and Women,” 2009
Prepared for the Department of Labor during the George W. Bush Administration, this source is viewed as a more conservative interpretation of the gender pay gap, but it still finds evidence of an unexplained pay gap, estimated between 5% and 7%.
Appendix: Other Relevant Contextual Information
The White House, Council of Economic Advisers, “Eleven Facts about American Families and Work,” 2014, “Expanding Opportunities for Women in Business,“ 2015, and "Equal Pay for Equal Work? The State of the Gender Pay Gap," 2016
Under Chair Jason Furman and former Member Betsey Stevenson, the CEA produced these extensive research reports on women in the workforce. Additionally, former Member Sandy Black gave a presentation on the gender pay gap at a 2016 Third Way event.
Catalyst Knowledge Center
The nonprofit organization Catalyst produces research on a variety of topics to promote the business case for women’s advancement in both the U.S. and internationally.
LeanIn.org and McKinsey & Company, “Women in the Workplace,” 2016
This report, jointly produced by Facebook COO Sheryl Sandberg’s nonprofit and a leading strategy consulting firm, tackles the leadership ambition gap, work-life balance issues, and the results of workplace advancement and development programs.
Credit Suisse, “The CS Gender 3000: Women in Senior Management,” 2014
This analysis of 3,000 companies worldwide quantifies the financial performance of companies with female CEOs, senior managers, and board members. This report also reviews the progress of women in business and further improvements that need to be made to address four types of obstacles facing women: individual, cultural, workplace, and structural/policy.
Weber Shandwick and KRC Research, “Gender Equality in the Executive Ranks: A Paradox,” 2015
This survey polled executives around the world to compare beliefs held by men and women in corporate leadership roles.