Report Published September 25, 2019 · 11 minute read
Higher Ed’s Broken Bridge to the Middle Class
Michael Itzkowitz

Last year, 16 million students enrolled in an institution of higher education.1 Their number one reason for doing so: to get a good job that provides for a financially secure future.2In practical terms, that means earning more than they would have if they never pursued a postsecondary education in the first place. Yet, employment data from the US Department of Education (Department) show that many institutions are failing to meet this expectation for most of their students.3Last year alone, more than half of institutions left the majority of their students earning less than $28,000—the typical salary of a high school graduate.4
Providing information on post-enrollment employment outcomes to students and families is critical, as it can help them determine whether an institution is providing a return on investment for students who enroll. While the federal government currently makes earnings data available through a consumer website, it has no laws in place to ensure that even a modest proportion of students are financially better off after attending a college or program that is funded by federal grants and loans. This analysis defines a baseline earnings measure that can be used by students when deciding which college to attend, as well as by policymakers who should take a harder look at how well federally-funded higher education institutions are equipping students to earn more than a high school graduate.
Methodology
The data included in this analysis come from two Department data sources: The Accreditation Data File and the College Scorecard.5 The Accreditation Data File was used to pull in institution names, the sector and type of institution, and the amount of federal student aid received in award year 2017-2018. The College Scorecard was used to incorporate data on the percentage of students who earn more than the average high school graduate at each individual institution. Institutions that did not share a unique six-digit OPEID from the office of Federal Student Aid within the two data sets were excluded from this analysis. Furthermore, institutions with no earnings data available were also excluded.
The threshold earnings measure used in this analysis reflects the percent of students earning above the average high school graduate at each institution—measured by the Department to be $28,000.6 Both students who completed or left an institution before completing are included in this analysis. Students who were deceased or were receiving an in-school or military deferment at the time of measurement were excluded.78These data are also limited to students who have received federal grants or loans.9 Therefore, it may be less representative at institutions with low proportions of students receiving federal aid to pay for their studies.1011
Choosing the Right Earnings Measure
Currently, the Department collects and publishes information on three main employment metrics for former students who have attended an institution: 1) the mean salary, 2) the median salary, and 3) the percentage of former students who earn more than the typical high school graduate.12 However, when trying to determine whether an institution provides a basic level of economic value to a student, the first two metrics can be misleading. For example, simply looking at raw salary numbers may serve as a better reflection on the majors a school offers, unfairly penalizing institutions that prioritize graduating students in lower-paying fields (such as teaching) in favor of higher-paying fields (like engineering). In addition, these numbers may indicate wage gaps that are outside of the control of an institution, including earnings disparities that exist in more rural areas of the country and for women and students of color.13 Lastly, if a few students from an institution end up very financially successful after attending, the mean, or average, salary may be skewed toward the performance of those outliers, misrepresenting the student population as a whole.
That is why a threshold that measures the proportion of students who earn above or below a certain amount presents a more accurate picture of a basic economic outcome that an institution should provide to its students. Specifically, looking at a defined cutoff of $28,000—the amount that the typical high school graduate earns—helps to determine the percentage of students who are earning at least as much those who graduated high school, but received no postsecondary training at all. That’s a basic measure of whether most students got at least some return on their higher education investment. Whether an institution primarily focuses on education or engineering, if a high proportion of students are shown to earn below the average high school graduate after they attend, it could be determined that the institution is failing to provide an economic return that justifies attending that institution in the first place. Furthermore, if an institution enrolls a high proportion of students who face wage disparities to begin with and leaves them still earning even less than this basic threshold, it may perpetuate the economic barriers that currently exist. For these reasons, this analysis uses a threshold earnings measure to determine the percentage of former postsecondary students at each institution who now earn more than the average high school graduate.
Earnings Outcomes Over Time
When providing information on post-enrollment earnings, the data also reflects how long students have been out of school during the time of measurement. Using a shorter measurement period (such as six years after enrollment) can be beneficial, as it better demonstrates how well an institution is preparing its students to enter the existing job market, and any recent changes an institution has made to do so. However, a longer-term measurement period provides former students with more time to settle into the workforce and may provide a better indication of future employment opportunity and the growth potential of a particular credential over time. Yet, using an eight- or 10-year measurement period may not reflect any changes that have been made by an institution over the last few years to improve performance, as outcomes will be based on students who enrolled at an institution nearly a decade prior.
Given this context, the table below highlights the number and percentage of institutions that show more than half of former students failing to earn more than an average high school graduate within six, eight, and 10 years after enrollment. Specifically, we show the total number and proportion of institutions that have more than half of students earning less than the average high school graduate within each of these timeframes.
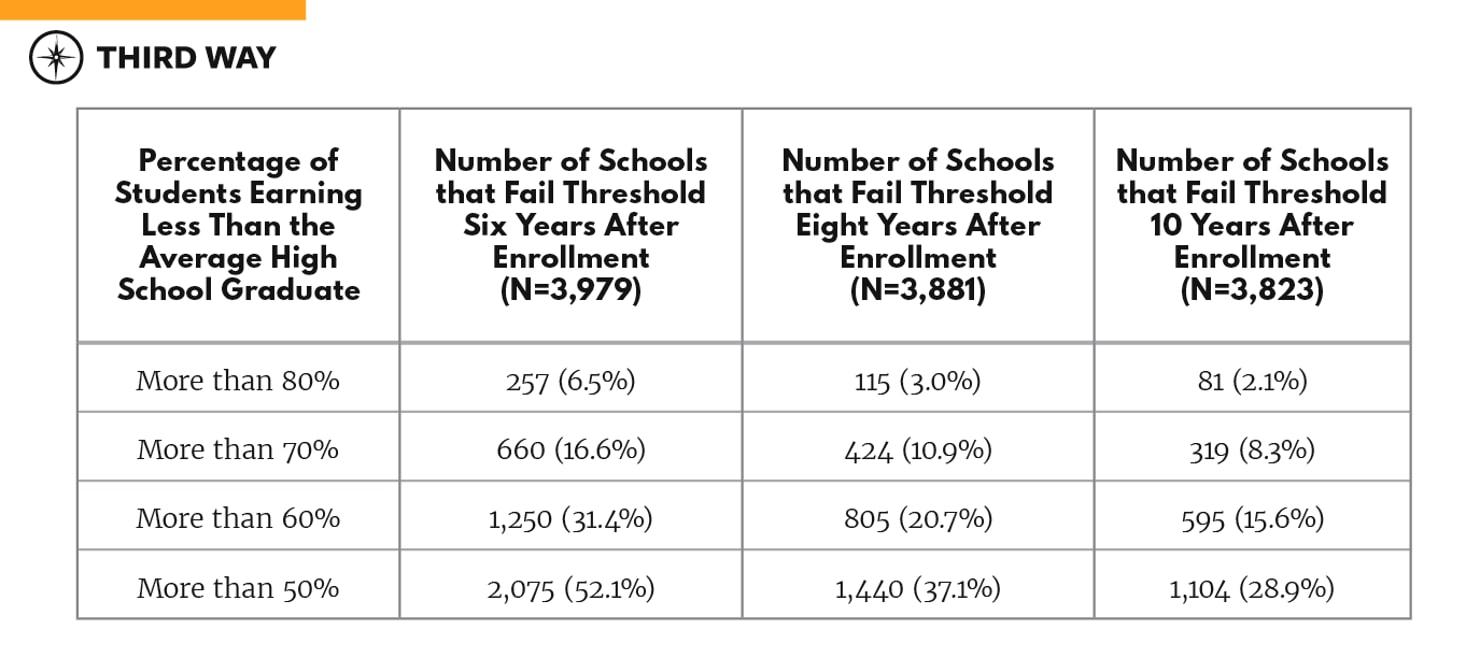
When measuring post-enrollment earnings six years after enrollment, there are 257—or 6.5% of all institutions with earnings data available—where over four-fifths of the student body fails to earn as much as the average high school graduate. And there are a whopping 2,075 institutions (52% of all institutions) where over half of students who enroll are earning less than a high school graduate six years later. Even after 10 years, more than a quarter of institutions still fail to have the majority of their students meet this minimum economic threshold, demonstrating a pervasive problem with our current higher education system’s ability to produce a basic level of post-enrollment earnings for a significant number of students who enroll.
Earnings Outcomes Across Educational Sector
When drilling down even further, we can see that certain sectors show substantially higher rates of students failing to earn more than the average high school graduate after they attend an institution. Below, we look specifically at the number and percentage of institutions within each sector—whether it be public, private, or for-profit—that show more than half of students failing to earn more than the average high school graduate six years after attending.
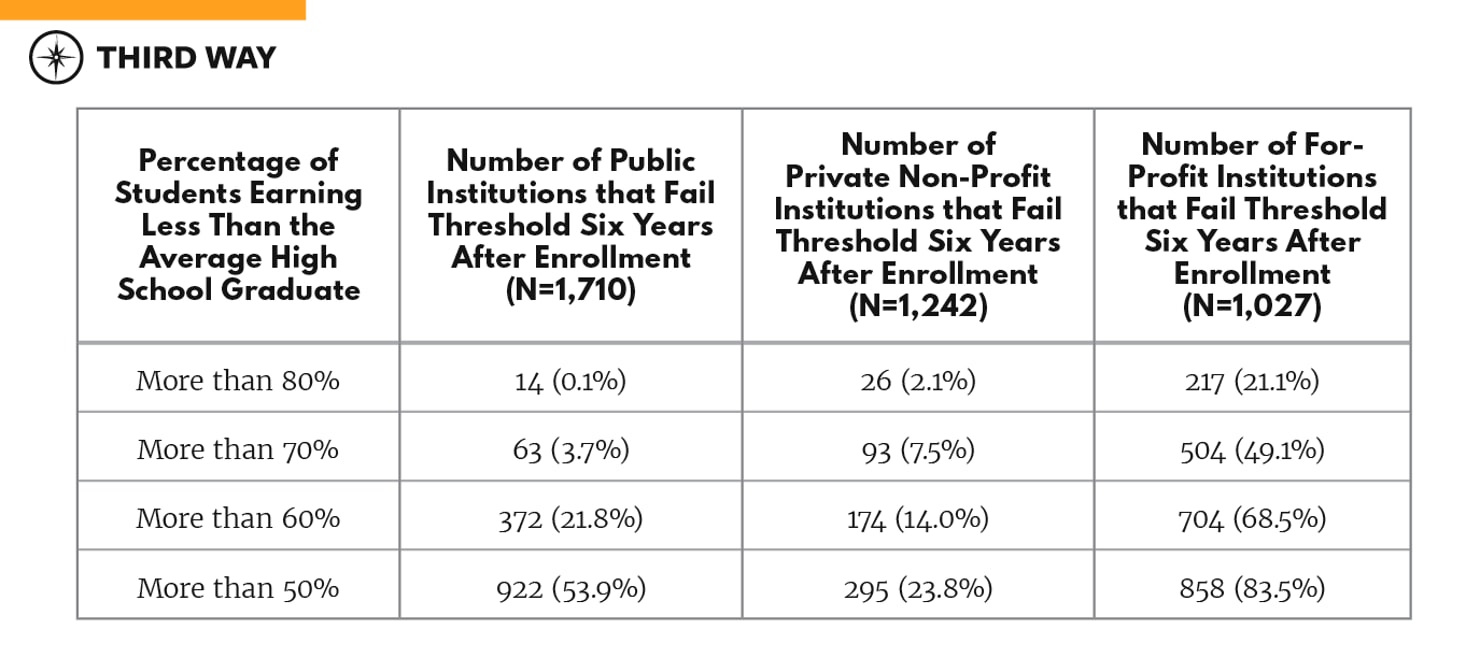
While private non-profit institutions show some of the strongest post-enrollment earnings outcomes as a sector, 93 (or 7.5%) still show over 70% of students earning even less than the typical high school graduate six years after they enroll. Public institutions are shown to avoid some of the worst outcomes, yet 922—which is over half of all schools in this sector—still show substandard earnings outcomes for the majority of their students. By far, though, the for-profit sector shows some of the most worrisome employment outcomes within higher education: one in five of these schools show over 80% of former students failing to earn more than someone with no postsecondary experience at all. And over four-fifths of for-profit institutions show the majority of students earning less than the average high school graduate within six years of entering school.
Earnings Outcomes at Different Types of Institutions
Beyond the sector of institution, post-enrollment earnings also vary by the type of credential offered. Below, we examine the outcomes of institutions that predominately offer certificates, associate’s degrees, and bachelor’s degrees.
Similar to above, we use a measurement period reflective of students’ earnings six years after entering an institution. In practical terms, if a student completed a certificate in one year, a six-year measurement period would reflect their annual income five years after they’ve left an institution. And, for those who completed a bachelor’s degree in four years, it would measure their income within two years of graduation.14 As with all earnings measures used in this analysis, students who are receiving an in-school or military deferment during the time of measurement are excluded from the calculation.15
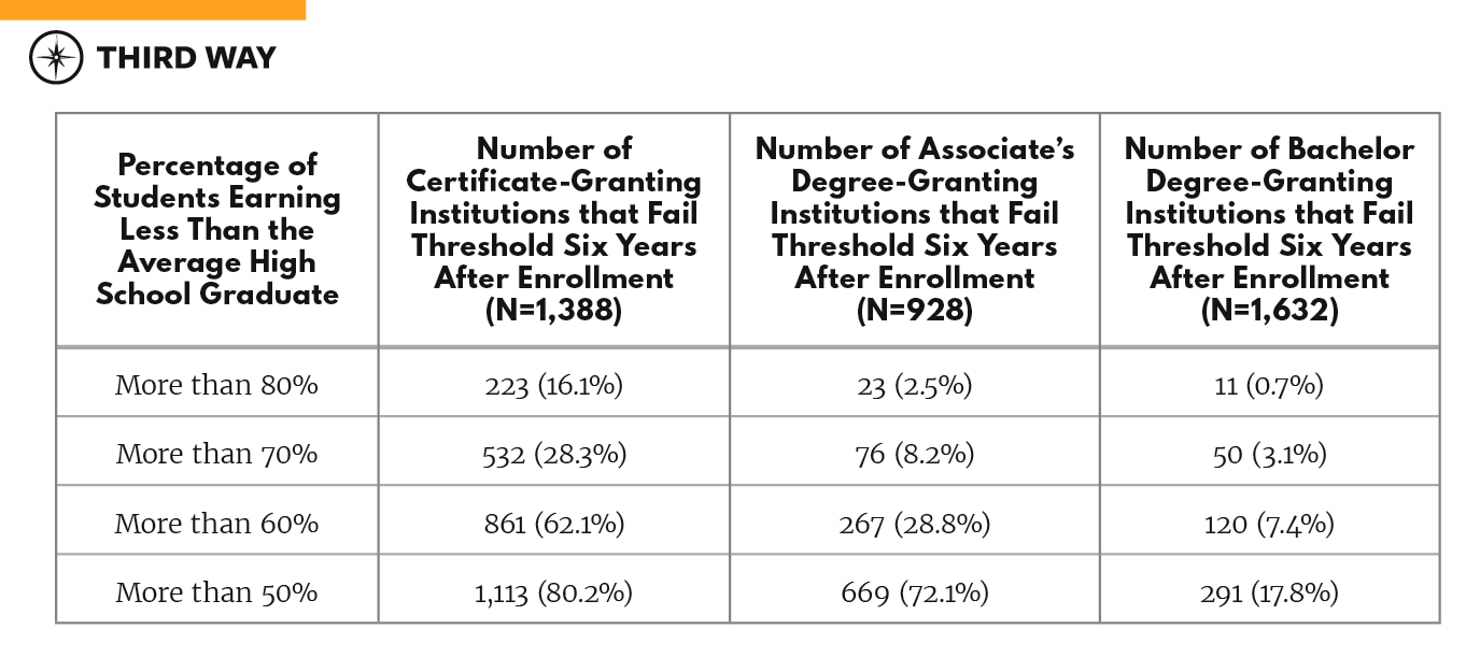
Institutions that focus on short-term credentials show a lower proportion of students earning more than the average high school graduate—even though their students who completed their credentials on-time have had several more years of workforce experience to get their wages up. In fact, 80% of institutions that focus on granting certificates show the majority of students earning less than $28,000 per year, even six years after enrollment. And while most institutions that primarily offer associate’s degrees avoid some of the worst employment outcomes, 72% still show the majority of students able to hit this minimum benchmark. Institutions that concentrate on awarding bachelor’s degrees fare better, with less than one in five leaving most of their students earning less than a typical student who graduated high school but never attended college in the first place.
Federal Aid to Institutions That Leave Students with Poor Employment Opportunities
While attending a college that provides limited post-enrollment earning potential can be devastating for students, it also harms taxpayers who subsidize these institutions with hundreds of millions of dollars in federal student aid every single year. Below, we examine the amount of federal student aid disbursed to institutions that show some of the worst employment outcomes for the students they enroll. Specifically, we look at the amount of aid that was disbursed to those institutions that show over 70% of their students earning even less than the average high school graduate within six, eight, and 10 years after enrollment.
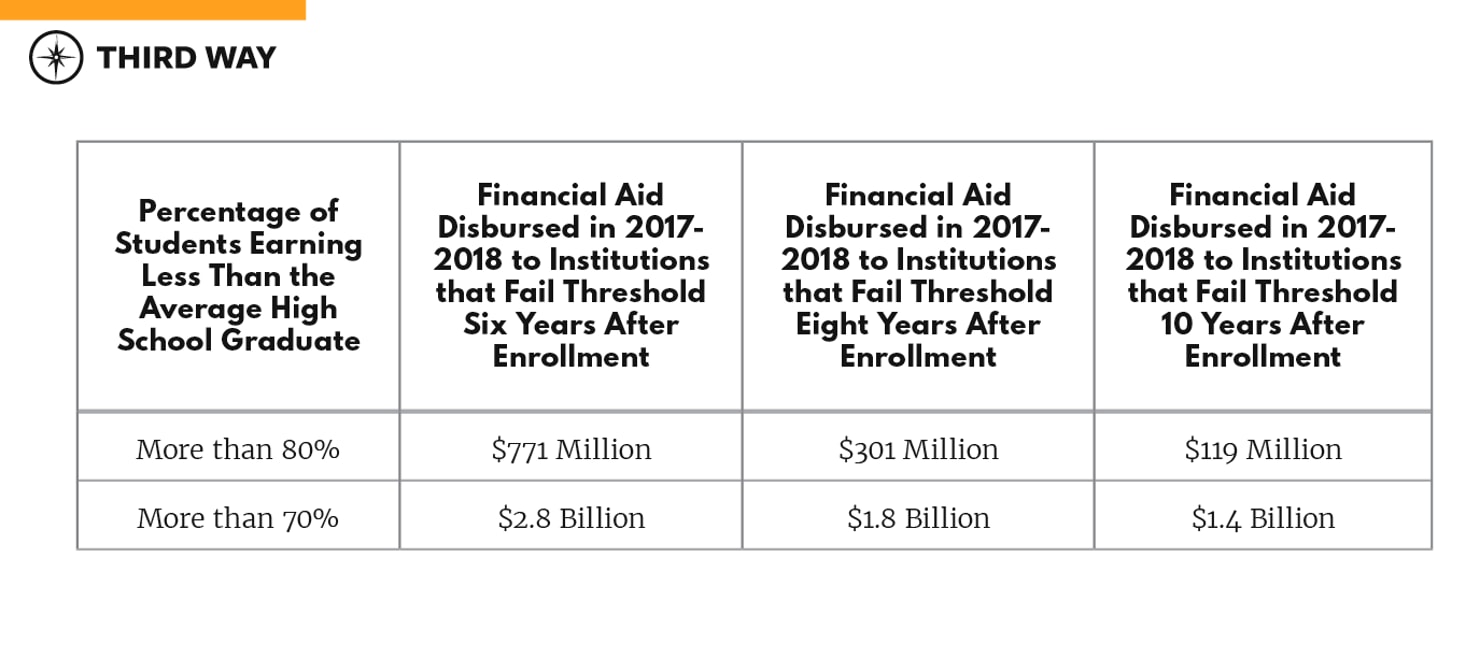
When measuring employment outcomes six years after students have enrolled in school, $2.8 billion was disbursed in a single academic year to institutions that showed over 70% of students failing to earn more than the average high school graduate. And over $770 million went to institutions that showed more than four-fifths of students failing to meet the same economic benchmark. Even when measuring post-enrollment earnings ten years later—allowing former students more time to settle into employment—$1.4 billion still flowed to schools that left over 70% of students failing to earn more than $28,000 per year, calling into question the quality assurance mechanisms we are using to protect these taxpayer dollars, which are currently going to institutions that provide little economic value to their students.
Conclusion
Every year, millions of students enter our nation’s institutions of higher education, most with the expectation that it will lead them to a financially secure future.16 However, federal data show that many will leave with employment opportunities that fall short of that initial expectation, as thousands of schools are providing minimal economic benefit to those who enroll. And for the many students who take out loans to finance their postsecondary endeavors, limited post-attendance economic opportunities may leave them in one of the most precarious financial situations, with student debt that is simply unmanageable. As prospective students consider which institutions will serve them well, it’s critical that they factor in this minimum baseline of economic success as they weigh their postsecondary options. And as Congress works toward a rewrite of the Higher Education Act, it’s essential that policymakers put more effective guardrails in place that assure students will be financially better off after they attend a federally funded institution, ensuring taxpayers get a return on their massive annual investment in higher education institutions across the United States. If not, millions of students may end up worse off than if they hadn’t enrolled in the first place, and low-performing schools will continue to cash in taxpayer subsidies while failing on the promise to prepare students for success in the 21st century economy.