Peaceful or Stressful? America has Two Kinds of Retirement

HG Two economies two different retirements
Photo of Anthony Colavito
Anthony Colavito
Former Economic Policy Advisor

Takeaways

Retirees in this country experience one of two very different worlds. With a college degree, retirees typically have the financial and physical health to live an active and comfortable senior life. Retirees without a degree have lower incomes, fewer assets, poorer health, and are far more reliant on federal safety net programs.

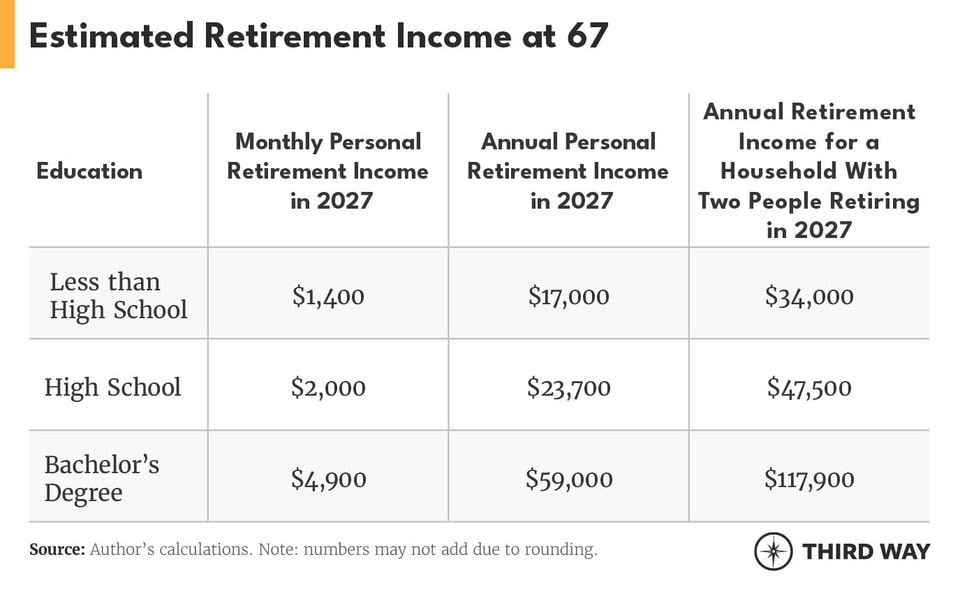
In new projections we calculated for the next generation of retirees, we find that a two-adult household of high school-educated workers can expect to live on $48,000 year if they retire at age 67, less than half the $118,000 a two college-educated adult household can expect. That is the difference between a retirement of leisure and comfort, and one of anxiety and uncertainty.

That means those without a degree will:

  • Have less than half the retirement income;
  • Be twice as reliant on Social Security;
  • Have double the rate of poor or fair health;
  • Need means-tested assistance at higher rates.

America is grayer by the day. Between 1980 and 2021, the number of people aged 55 and older more than doubled—from 46 million to 98 million.1 The bulk of this increase has come from the rising share of people without a four-year degree entering their older years. Today, the median non-college American adult is 53 years old, five years older than their college-educated counterpart.2 The number of older (aged 55+) Americans without a four-year degree now stands above 66 million, two-thirds of the senior population and a quarter of the voting-age population.3

As we explored in a previous work, there are two economic worlds in America today—one for the college-educated and one for those without four-year degrees. Non-college America is bigger and more diverse, but inhabitants face unrelenting economic headwinds. One source of these challenges comes from the difficulty those without a college degree face in preparing for retirement. In this report, we explore the current and next generation of non-college retirees and uncover how the college-educated are prepared for and more capable to enjoy their retirement, while the non-college educated are just scraping by and more likely to be financially insecure and anxious.
Current Retirees: College Comfort versus Degreeless Anxiety

Retirement-age non-college Americans have lower incomes, fewer assets, and are more reliant on safety net programs like Medicaid and SSI than their college-educated counterparts. So, while a college-educated retiree can have comfort and leisure in their senior years, those without degrees all too often spend those years with more financial and physical worry.

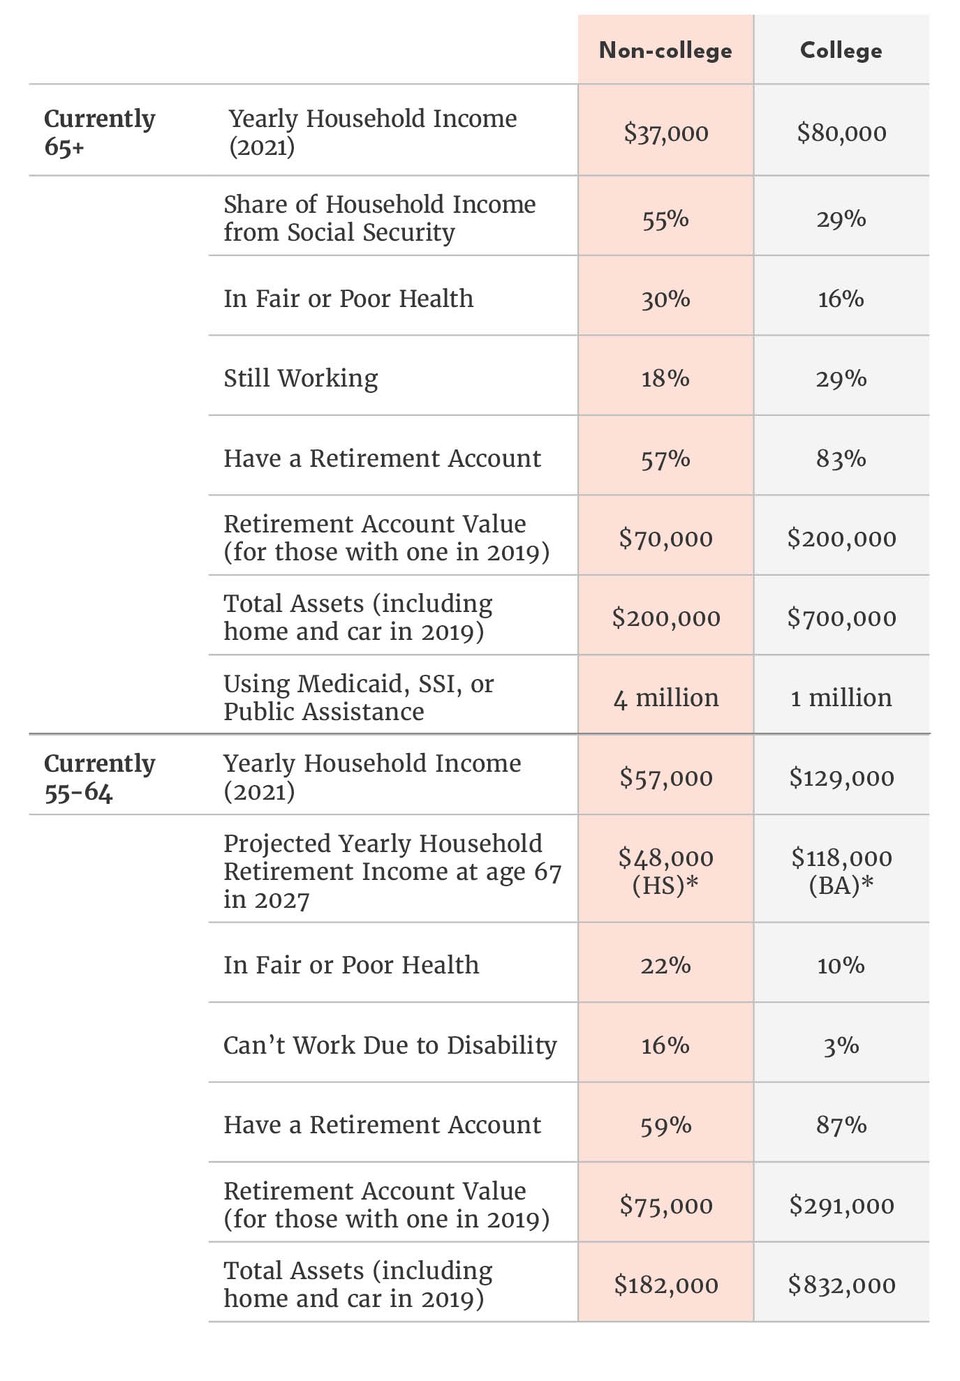
In 2021, households headed by non-college retirees had just $37,000 in income, less than half the $80,000 college-educated households received.4 Fifty-five percent of non-college senior household income comes from Social Security, versus just 29% for college-educated retirees.5

These income disparities arise from two key differences between those with a four-year degree and those without: the ability to work and the capacity to save.

Non-college people are less likely to work—and thus receive earnings—in retirement-age years. Because non-college workers are more likely to work physically demanding jobs, they are less likely to continue working as they get older and become less healthy.6 In 2021, 30% of non-college seniors reported having fair or poor health versus 16% of similar college-educated people.7 Unsurprisingly, just 18% of non-college seniors worked at all in that same year, compared to 29% of college-educated seniors.8

Even more than the ability to work, the biggest driver of income gaps among seniors is savings—or the lack thereof. Forty-three percent of non-college seniors do not belong to a household with any type of retirement account such as an IRA, 401(k), or traditional pension plan.9 Just 17% percent of college-educated seniors, on the other hand, are in a household without a retirement account.10

Further, non-college seniors that do own some type of savings account have significantly less savings than college-educated seniors. In 2019, among households headed by a senior with a private retirement account, the median account value was $70,000 for those without a college degree versus $200,000 for those with a four-year degree or more.11 Of course, retirees may finance their retirement with savings other than those in a retirement account. But even under a broader view of savings, non-college retirees are far behind. The median retirement-age college-educated household has $700,000 in total assets, including their house and car, versus $200,000 for households headed by someone without a four-year degree.12 When looking at just financial assets, these figures are $234,000 and $20,000, respectively.13
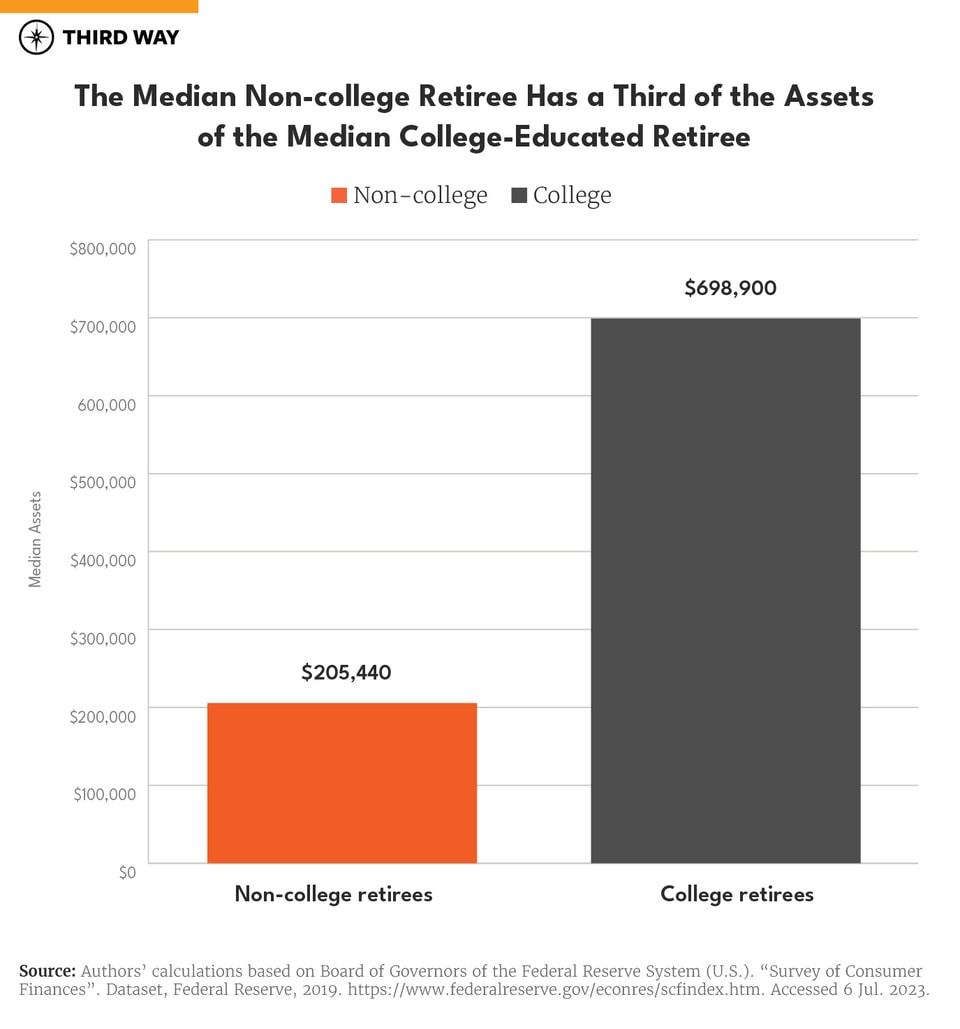
Overall, disparities in work, other income, and savings leave non-college retirees facing greater challenges than college-educated retirees. Nearly double the share of non-college retirees are in poverty—13% versus 7%—translating to 5 million impoverished elderly non-college adults versus 1 million college-educated ones.14 Consequently, retirees without a college degree are more reliant on means-tested programs. Four million non-college retirees receive Medicaid, SSI, or another form of public assistance compared to just 1 million college-educated retirees.15 While these programs help keep some above water, many non-college retirees are still struggling to stay afloat.

Near Retirees: Confidence versus Concern

The next generation of retirees (those currently between the ages of 55-64) face vastly different retirements depending on whether they have a college degree. Older college-educated workers are more likely to be able to look forward to retirement while non-college workers near retirement are likely to be concerned about what retirement may hold.

To see which workers were best prepared to thrive in retirement, we estimated the monthly retirement income for a typical worker across three levels of education. To do so, we first estimated workers’ Social Security incomes using data on lifetime earnings. Then, using information on a typical household’s finances near retirement, we estimated what their retirement income could be with a monthly annuity purchased with their size-adjusted household wealth (excluding their primary home, any vehicles owned, and the value of any defined benefit or cash balance plans). We then added these amounts to compare them by monthly income, annual income, and income for a two-person household.

For an average household with two college-educated workers born in 1960 and retiring in 2027—the first group of people for whom Social Security’s full retirement age of 67 applies—annual retirementincome would be $118,000.16 For a household with two average workers without a high school education, retirement income would equal $34,000, just a third of the college household.17 And for households with two workers with a high school education but no college degree, it would equal $48,000.18 To be sure, some families participate in defined benefit or cash balance plans, so these figures may be below what newly retired families take in. However, just 30% of non-college workers near retirement belong to a household with a defined benefit or cash balance plan compared to 50% of the college educated.19 And many of these pensions belong to workers with jobs not covered by Social Security (such as state & local workers), so whatever income missed by these projections may be offset by losses in Social Security income. But among senior households with a company or union pension, the median annual benefit is $9,600 for a non-college household and $15,500 for a college-educated one, so disparities between these groups may be greater than they appear.20
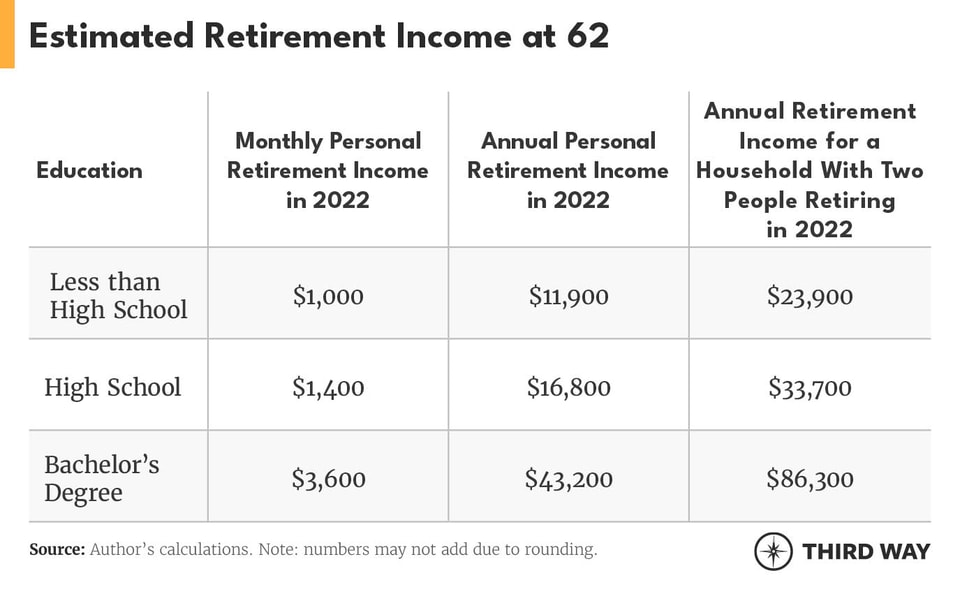
And of course, not every worker will retire at 67. In fact, around a third of workers retire and claim Social Security benefits at the earliest age possible, 62.21 These workers are more likely to have lower life-time earnings, have worked in blue-collar occupations, and have health problems—characteristics that are associated with not having a college degree.22 If a household with two workers with a high school diploma but no college degree retired and claimed Social Security at age 62 rather than age 67, their annual retirement income would equal $33,700, inclusive of Social Security and our estimated other retirement income.23 For a household with two workers with less than a high school education, it would be $23,900.24
Why will many of the next generation of non-college retirees face a difficult retirement? Just like current non-college retirees, they have less savings, less income, and are more likely to not work due to health problems than the college educated.

Less Savings: Forty-one percent of non-college Americans between the ages of 55-64 live in a household without any type of retirement plan, compared to 13% of similarly aged college-educated people.25 Of households with retirement savings in 2019, the median non-college household near retirement had $75,000 in savings versus $291,000 for the college-educated.26 When looking across all households, the median non-college household had $13,000 in financial assets out of $182,000 in total assets, which includes the value of their home.27

Less Income: One reason older non-college workers have less savings than the college educated is that they often earn less from work. Over half of this group are employed in blue-collar occupations compared to a little over one-in-ten of older college-educated workers.28 These occupations are among the lowest paid. For example, the average weekly wage of a worker in the transportation & material moving occupations is $800, while it is $1,400 for a worker in the health care practitioner & technical occupations.29 Median household income is $57,000 for a household headed by a non-college worker aged 55-64, less than half the $129,000 older college-educated households take home.30 Non-college households make up 85% of the poorest fifth of households in this age range versus just 30% of the richest fifth.31

Less likely to be able to work: Disparities in types of jobs worked not only lead to less earnings but also higher rates of disability and poor health among those without a four-year degree. Non-college workers’ blue-collar jobs exact a physical toll on their bodies over the course of their career. In addition, many were unlikely to have and afford consistent health care for years of their lives.32 Consequently, over one-in-five older non-college workers reported fair or poor health in 2021 compared to 10% of those without a college degree.33 Partly as a result, over six times the number of older non-college workers have ever quit or left a job for health reasons than the number of college-educated workers.34 In 2021, 16% of all non-college people near retirement did not work at all due to an illness or disability, whereas just 3% of older college-educated workers did the same.35

Conclusion

Retirement can be peaceful or stressful. A lot of that has to do with how prepared people feel financially for the moment they leave the workforce. Non-college retirees are far more likely to fall in the stressful camp, and the next generation of non-college retirees isn’t prepared to feel much better. Disparities in types of jobs worked, health, income, and savings mean a comfortable retirement is out of reach for millions of older non-college Americans. Policymakers hoping to confront the challenges facing the non-college economy need to be aware of the problems facing older non-college Americans. Further, they must not let generations down the line run the same risks.

Addressing these gaps will go a long way in ensuring everyone can afford a fulfilling retirement, not just those with college degrees.

Appendix

Retirement income projections for “near retirees” are the sum of estimated Social Security income and the size of a lifetime monthly annuity a typical retiree could purchase at retirement with the liquidation of assets. Social Security income is estimated using data on real lifetime career earnings for an individual of a given education level estimated by Broady, Kristen E. and Brad Hershbein. “Major Decisions: What Graduates Earn Over Their Lifetimes.” The Hamilton Project, 8 Oct. 2020, https://www.hamiltonproject.org/publication/post/major-decisions-what-graduates-earn-over-their-lifetimes/. Accessed 9 Jul. 2023. This real income is converted into nominal dollars using the PCE Price Index and used to estimate monthly Social Security retirement benefits for an individual born in 1960. Careers are assumed to have begun in 1978 for individuals with a high school diploma or less and in 1982 for those with a bachelor’s degree. Annuity income is estimated using size-adjusted median wealth excluding primary residence and any vehicles owned among households headed by persons aged 55-64 from the U.S. Census Bureau’s Survey of Income and Program. It is then inflated using Congressional Budget Office’s PCE Price Index projections. Estimated household income is the sum of two model individual’s projected retirement income. The table below compares the incomes of current retirees with our projected incomes for those retiring at 67, 65, and 62, all expressed in 2022 dollars.
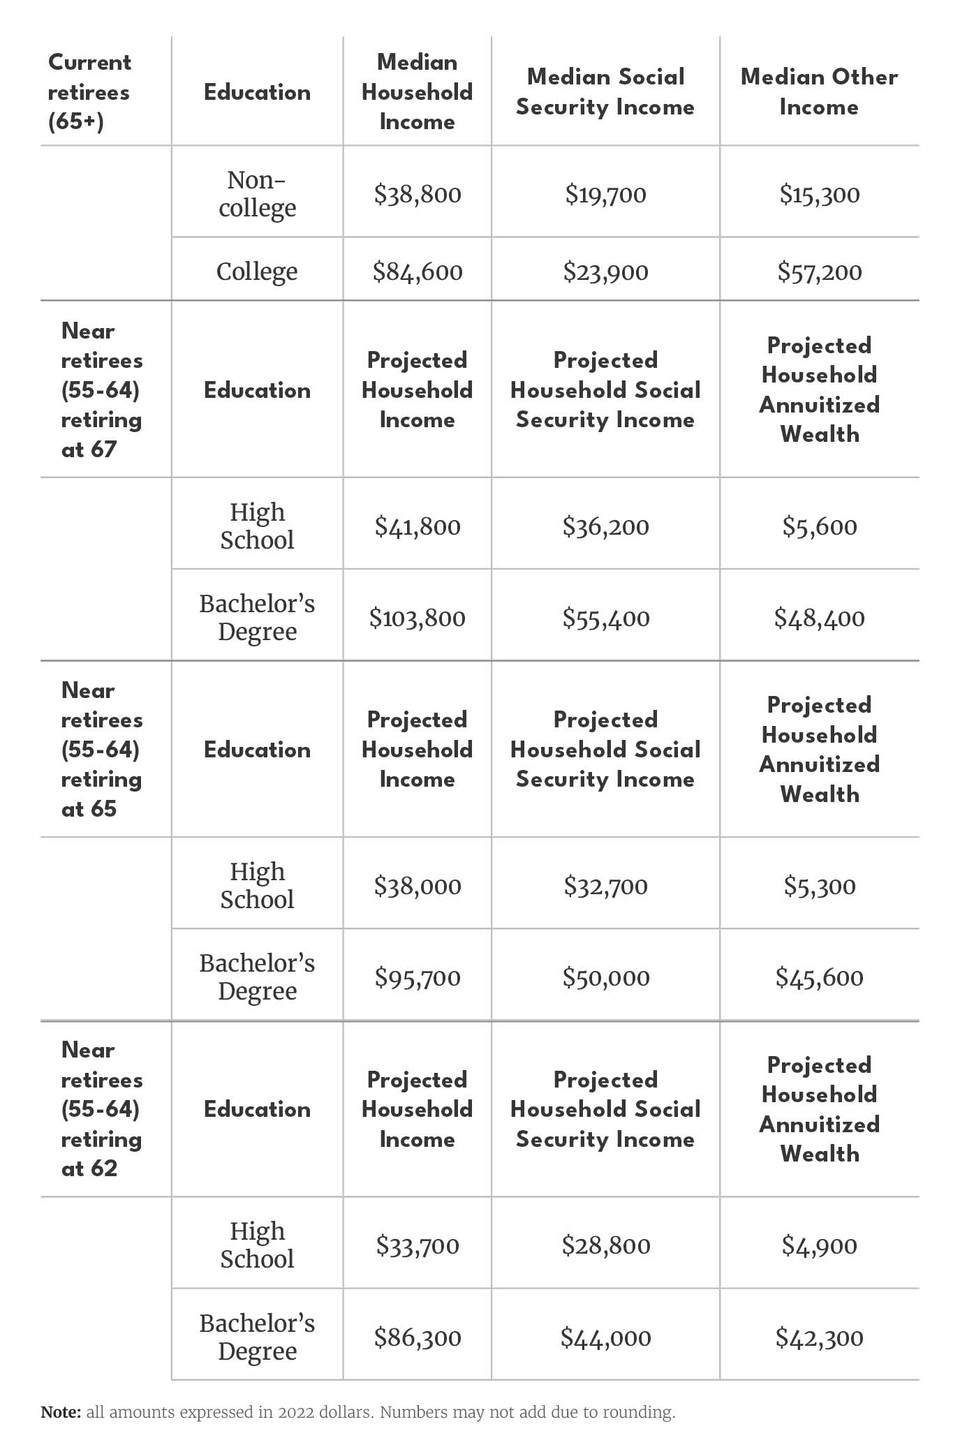
This report was updated on 11/20/23 to correct a minor calculation error and to indicate that numbers in tables may not add due to rounding.

Topics
  • All Topics
  • Workforce & Training127
  • 21st Century Jobs72
  • Retirement62

Endnotes

  1. Authors’ calculations based on Flood, Sarah, et al. “IPUMS CPS: Version 10.0” 2022 Current Population Survey Annual Social and Economic Supplement, Minnesota Population Center, University of Minnesota, 2022. https://doi.org/10.18128/D030.V10.0. Accessed 6 Jul. 2023.

  2. Authors’ calculations based on Flood, Sarah, et al. “IPUMS CPS: Version 10.0” 2022 Current Population Survey Annual Social and Economic Supplement, Minnesota Population Center, University of Minnesota, 2022. https://doi.org/10.18128/D030.V10.0. Accessed 6 Jul. 2023.

  3. Authors’ calculations based on Flood, Sarah, et al. “IPUMS CPS: Version 10.0” 2022 Current Population Survey Annual Social and Economic Supplement, Minnesota Population Center, University of Minnesota, 2022. https://doi.org/10.18128/D030.V10.0. Accessed 6 Jul. 2023.

  4. Authors’ calculations based on Flood, Sarah, et al. “IPUMS CPS: Version 10.0” 2022 Current Population Survey Annual Social and Economic Supplement, Minnesota Population Center, University of Minnesota, 2022. https://doi.org/10.18128/D030.V10.0. Accessed 6 Jul. 2023.

  5. Authors’ calculations based on Flood, Sarah, et al. “IPUMS CPS: Version 10.0” 2022 Current Population Survey Annual Social and Economic Supplement, Minnesota Population Center, University of Minnesota, 2022. https://doi.org/10.18128/D030.V10.0. Accessed 6 Jul. 2023.

  6. Ravestejin, Bastian, Hans van Kippersluis, and Eddy van Doorslaer. “The Contribution of Occupation to Health Inequality.” Health and Inequality, Research on Economic Inequality, Volume 12, Emerald Group Publishing Limited, Bingley, 30 Dec. 2022. https://doi.org/10.1108/S1049-2585(2013)0000021014.

  7. Authors’ calculations based on Flood, Sarah, et al. “IPUMS CPS: Version 10.0” 2022 Current Population Survey Annual Social and Economic Supplement, Minnesota Population Center, University of Minnesota, 2022. https://doi.org/10.18128/D030.V10.0. Accessed 6 Jul. 2023.

  8. Authors’ calculations based on Flood, Sarah, et al. “IPUMS CPS: Version 10.0” 2022 Current Population Survey Annual Social and Economic Supplement, Minnesota Population Center, University of Minnesota, 2022. https://doi.org/10.18128/D030.V10.0. Accessed 6 Jul. 2023.

  9. Authors’ calculations based on “2021 Survey of Income and Program Participation.” U.S. Census Bureau, U.S. Department of Commerce, 31 Aug. 2022. https://www.census.gov/programs-surveys/sipp.html. Access 6 Jul. 2023.

  10. Authors’ calculations based on “2021 Survey of Income and Program Participation.” U.S. Census Bureau, U.S. Department of Commerce, 31 Aug. 2022. https://www.census.gov/programs-surveys/sipp.html. Access 6 Jul. 2023.

  11. Authors’ calculations based on Board of Governors of the Federal Reserve System (U.S.). “Survey of Consumer Finances”. Dataset, Federal Reserve, 2019. https://www.federalreserve.gov/econres/scfindex.htm. Accessed 6 Jul. 2023.

  12. Authors’ calculations based on Board of Governors of the Federal Reserve System (U.S.). “Survey of Consumer Finances”. Dataset, Federal Reserve, 2019. https://www.federalreserve.gov/econres/scfindex.htm. Accessed 6 Jul. 2023.

  13. Authors’ calculations based on Board of Governors of the Federal Reserve System (U.S.). “Survey of Consumer Finances”. Dataset, Federal Reserve, 2019. https://www.federalreserve.gov/econres/scfindex.htm. Accessed 6 Jul. 2023.

  14. Authors’ calculations based on Flood, Sarah, et al. “IPUMS CPS: Version 10.0” 2022 Current Population Survey Annual Social and Economic Supplement, Minnesota Population Center, University of Minnesota, 2022. https://doi.org/10.18128/D030.V10.0. Accessed 6 Jul. 2023.

  15. Authors’ calculations based on Flood, Sarah, et al. “IPUMS CPS: Version 10.0” 2022 Current Population Survey Annual Social and Economic Supplement, Minnesota Population Center, University of Minnesota, 2022. https://doi.org/10.18128/D030.V10.0. Accessed 6 Jul. 2023.

  16. Author’s calculations model retirement income based on the sum of Social Security income and the size of a lifetime monthly annuity a typical retiree could purchase at retirement with the liquidation of assets. Social Security income is estimated using data on real lifetime career earnings for an individual of a given education level estimated by Broady, Kristen E. and Brad Hershbein. “Major Decisions: What Graduates Earn Over Their Lifetimes.” The Hamilton Project, 8 Oct. 2020, https://www.hamiltonproject.org/publication/post/major-decisions-what-graduates-earn-over-their-lifetimes/. Accessed 9 Jul. 2023. This real income is then converted into nominal dollars using the PCE Price Index and used to calculate monthly Social Security retirement benefits. Annuity income is estimated using median wealth excluding primary residence and any vehicles owned among households headed by persons aged 55-64 from the U.S. Census Bureau's Survey of Income and Program Participation inflated using Congressional Budget Office’s PCE Price Index projections.

  17. Author’s calculations model retirement income based on the sum of Social Security income and the size of a lifetime monthly annuity a typical retiree could purchase at retirement with the liquidation of assets. Social Security income is estimated using data on real lifetime career earnings for an individual of a given education level estimated by Broady, Kristen E. and Brad Hershbein. “Major Decisions: What Graduates Earn Over Their Lifetimes.” The Hamilton Project, 8 Oct. 2020, https://www.hamiltonproject.org/publication/post/major-decisions-what-graduates-earn-over-their-lifetimes/. Accessed 9 Jul. 2023. This real income is then converted into nominal dollars using the PCE Price Index and used to calculate monthly Social Security retirement benefits. Annuity income is estimated using median wealth excluding primary residence and any vehicles owned among households headed by persons aged 55-64 from the U.S. Census Bureau's Survey of Income and Program Participation inflated using Congressional Budget Office’s PCE Price Index projections.

  18. Author’s calculations model retirement income based on the sum of Social Security income and the size of a lifetime monthly annuity a typical retiree could purchase at retirement with the liquidation of assets. Social Security income is estimated using data on real lifetime career earnings for an individual of a given education level estimated by Broady, Kristen E. and Brad Hershbein. “Major Decisions: What Graduates Earn Over Their Lifetimes.” The Hamilton Project, 8 Oct. 2020, https://www.hamiltonproject.org/publication/post/major-decisions-what-graduates-earn-over-their-lifetimes/. Accessed 9 Jul. 2023. This real income is then converted into nominal dollars using the PCE Price Index and used to calculate monthly Social Security retirement benefits. Annuity income is estimated using median wealth excluding primary residence and any vehicles owned among households headed by persons aged 55-64 from the U.S. Census Bureau's Survey of Income and Program Participation inflated using Congressional Budget Office’s PCE Price Index projections.

  19. Authors’ calculations based on “2021 Survey of Income and Program Participation.” U.S. Census Bureau, U.S. Department of Commerce, 31 Aug. 2022. https://www.census.gov/programs-surveys/sipp.html. Access 6 Jul. 2023.

  20. Authors’ calculations based on Flood, Sarah, et al. “IPUMS CPS: Version 10.0” 2022 Current Population Survey Annual Social and Economic Supplement, Minnesota Population Center, University of Minnesota, 2022. https://doi.org/10.18128/D030.V10.0. Accessed 6 Jul. 2023.

  21. Early Claiming of Social Security Retirement Benefits Increased During the Recession.” Research Summaries, Office of Research, Statistics, and Policy Analysis, Social Security Administration, Apr. 2013. https://www.ssa.gov/policy/docs/research-summaries/early-claiming.html. Accessed 6 Jul. 2023.

  22. Waldron, Hilary. “Working and Claiming Behavior at Social Security’s Early Eligibility Age Among Men by Lifetime Earnings Decile.” ORES Working Papers, Office of Research, Statistics, and Policy Analysis, Social Security Administration, Sep. 2020. https://www.ssa.gov/policy/docs/workingpapers/wp115.html. Accessed 6 Jul. 2023; And Zajacova, Anna and Elizabeth M. Lawrence. “The Relationship Between Education and Health: Reducing Disparities Through a Contextual Approach.” Annual Review of Public Health, 1 Apr. 2018. https://www.ncbi.nlm.nih.gov/pmc/articles/PMC5880718/. Accessed 6 Jul. 2023.

  23. Author’s calculations model retirement income based on the sum of Social Security income and the size of a lifetime monthly annuity a typical retiree could purchase at retirement with the liquidation of assets. Social Security income is estimated using data on real lifetime career earnings for an individual of a given education level estimated by Broady, Kristen E. and Brad Hershbein. “Major Decisions: What Graduates Earn Over Their Lifetimes.” The Hamilton Project, 8 Oct. 2020, https://www.hamiltonproject.org/publication/post/major-decisions-what-graduates-earn-over-their-lifetimes/. Accessed 9 Jul. 2023. This real income is then converted into nominal dollars using the PCE Price Index and used to calculate monthly Social Security retirement benefits. Annuity income is estimated using median wealth excluding primary residence and any vehicles owned among households headed by persons aged 55-64 from the U.S. Census Bureau's Survey of Income and Program Participation inflated using Congressional Budget Office’s PCE Price Index projections.

  24. Author’s calculations model retirement income based on the sum of Social Security income and the size of a lifetime monthly annuity a typical retiree could purchase at retirement with the liquidation of assets. Social Security income is estimated using data on real lifetime career earnings for an individual of a given education level estimated by Broady, Kristen E. and Brad Hershbein. “Major Decisions: What Graduates Earn Over Their Lifetimes.” The Hamilton Project, 8 Oct. 2020, https://www.hamiltonproject.org/publication/post/major-decisions-what-graduates-earn-over-their-lifetimes/. Accessed 9 Jul. 2023. This real income is then converted into nominal dollars using the PCE Price Index and used to calculate monthly Social Security retirement benefits. Annuity income is estimated using median wealth excluding primary residence and any vehicles owned among households headed by persons aged 55-64 from the U.S. Census Bureau's Survey of Income and Program Participation inflated using Congressional Budget Office’s PCE Price Index projections.

  25. Authors’ calculations based on Board of Governors of the Federal Reserve System (U.S.). “Survey of Consumer Finances”. Dataset, Federal Reserve, 2019. https://www.federalreserve.gov/econres/scfindex.htm. Accessed 6 Jul. 2023.

  26. Authors’ calculations based on Board of Governors of the Federal Reserve System (U.S.). “Survey of Consumer Finances”. Dataset, Federal Reserve, 2019. https://www.federalreserve.gov/econres/scfindex.htm. Accessed 6 Jul. 2023.

  27. Authors’ calculations based on Board of Governors of the Federal Reserve System (U.S.). “Survey of Consumer Finances”. Dataset, Federal Reserve, 2019. https://www.federalreserve.gov/econres/scfindex.htm. Accessed 6 Jul. 2023.

  28. Authors’ calculations based on Flood, Sarah, et al. “IPUMS CPS: Version 10.0” 2022 Current Population Survey Annual Social and Economic Supplement, Minnesota Population Center, University of Minnesota, 2022. https://doi.org/10.18128/D030.V10.0. Accessed 6 Jul. 2023.

  29. Colavito, Anthony, Joshua Kendall, and Zach Moller. “World’s Apart: The Non-College Economy.” Economy, Third Way, 19 May 2023. https://www.thirdway.org/report/worlds-apart-the-non-college-economy. Accessed 6 Jul. 2023.  

  30. Authors’ calculations based on Flood, Sarah, et al. “IPUMS CPS: Version 10.0” 2022 Current Population Survey Annual Social and Economic Supplement, Minnesota Population Center, University of Minnesota, 2022. https://doi.org/10.18128/D030.V10.0. Accessed 6 Jul. 2023.

  31. Authors’ calculations based on Flood, Sarah, et al. “IPUMS CPS: Version 10.0” 2022 Current Population Survey Annual Social and Economic Supplement, Minnesota Population Center, University of Minnesota, 2022. https://doi.org/10.18128/D030.V10.0. Accessed 6 Jul. 2023.

  32. Morrissey, Monique. “Many older workers have difficult jobs that put them at risk.” Economic Policy Institute, 17 May 2023. https://www.epi.org/publication/older-workers-difficult-jobs/?mc_cid=390d589d47&mc_eid=5f5261db4e. Accessed 6 Jul. 2023.

  33. Authors’ calculations based on Flood, Sarah, et al. “IPUMS CPS: Version 10.0” 2022 Current Population Survey Annual Social and Economic Supplement, Minnesota Population Center, University of Minnesota, 2022. https://doi.org/10.18128/D030.V10.0. Accessed 6 Jul. 2023.

  34. Authors’ calculations based on Flood, Sarah, et al. “IPUMS CPS: Version 10.0” 2022 Current Population Survey Annual Social and Economic Supplement, Minnesota Population Center, University of Minnesota, 2022. https://doi.org/10.18128/D030.V10.0. Accessed 6 Jul. 2023.

  35. Authors’ calculations based on Flood, Sarah, et al. “IPUMS CPS: Version 10.0” 2022 Current Population Survey Annual Social and Economic Supplement, Minnesota Population Center, University of Minnesota, 2022. https://doi.org/10.18128/D030.V10.0. Accessed 6 Jul. 2023.

Subscribe

Get updates whenever new content is added. We'll never share your email with anyone.