Worlds Apart: The Non-College Economy


There are two Americas today: one for the college educated, and one for those without four-year degrees. Workers in these economies are worlds apart—the type of work they do, how they receive their pay, when they start their workday, and the benefits they get from employment are night and day.
College graduates have double the yearly income, four times the retirement savings, and four times the net worth of working age, non-college Americans. Non-college workers are five times more likely to be in poverty and lack health insurance, and more likely to move because of economic trouble. There are four times as many working the night shift, and three times as many not working at all.
As these economic worlds have drifted apart, so has their relative status. In the 1960s, one of every four Members of Congress had no college degree.1 Today, it’s one out of 25.2 Staff, consultants, lobbyists, pollsters, and think tanks are populated only by those with degrees. As elected officials themselves and the people closest to them look less like the economy they represent, they separate further from the majority of this country—the nearly two-thirds of adult America without a college degree. For example, the political shorthand for the working class conjures up a picture of a white male worker, yet nearly half of working age, non-college workers are people of color. The non-white share is 33% for those with at least a four-year degree. White men are only 29% of the non-college, working age population.3
In this paper, we take a snapshot of the economic situation of college and non-college degree-holding Americans. We focus on those aged 25 to 64, the ages of people most likely to be in the workforce. Now more than ever, your educational attainment determines the life you experience. With policymakers almost exclusively in the college-educated camp, there is an urgent need to better understand how the other two-thirds is doing.

109 Million Majority
There are 172 million Americans between the ages of 25 and 64.4 Almost two-thirds, or 109 million working age Americans, lack a four-year degree.5 Of those, 38 million have some education or credential above high school, while 71 million have a high school diploma or less.6
Every state has a sizeable non-college population, but ten states in particular have more than 70% of working age adults without a college degree.7 Eight of those states had the eight highest poverty rates in America in 2021: Alabama, Arkansas, Kentucky, Louisiana, Mississippi, New Mexico, Oklahoma, and West Virginia.8
And even in states where the non-college share of the population does not stand out—California, Florida, New York, and Texas—there are still millions of Americans without college degrees. These states face specific challenges that their non-college residents must also take on–they all have some of the highest housing cost burdens in the country, and Florida and Texas have median household incomes that fall $10,000 and $3,000 below the national median, respectively.9
Far More Diverse
Non-college America is rich with diversity compared to college-educated America. 50 million (46%) of the non-college population are people of color, compared to 22 million (34%) of the college educated.10 Just 31 million (29%) of the non-college educated are white men, versus 19 million college educated (31%).11

Except for Asian Americans, there are more Americans of each race without a four-year degree than there are those with one.12 For Black and Hispanic people, there are three times as many non-college individuals for everyone who is college educated.13
The non-college population is older and more male compared to the college educated. 37% of the working age non-college population is over 50 years old, compared to 30% of the college-educated population.14 And 52% of the non-college workforce is male compared to 46% of those who are college educated.15 Over time, gender differences will widen. By 2028, 57% of bachelor’s degrees are projected to be conferred to females and 60% of master’s degrees.16

On Their Feet, Not at a Desk
Blue-collar work is rare for college grads and common for non-college grads. 42 million non-college grads work in blue-collar occupations, the type of work that often requires standing, making things, and physical activity.17 Just 7 million college-educated Americans work in blue-collar occupations while a whopping 51 million work in white-collar ones.18
Blue-collar jobs earn less than white-collar jobs ($814 a week versus $1,313 a week).19 Nine of the ten highest paying occupations are white-collar, college jobs.20 Eight of the ten lowest paying occupations are blue-collar, non-college jobs.21
Blue-collar jobs are more hands-on, tangible, and often physically demanding. White-collar jobs rely more on staring at a screen, communication, and interpersonal skills than on physical tasks. Research has shown these jobs are associated with higher prestige than blue-collar ones, suggesting they come with greater social respect in addition to higher earnings.22
Commuting in the Dark
23 million non-college workers start work in the dark, beginning their shift between 7:00pm and 7:00am.23 Only 8 million college graduates keep to the same schedule. 2 million non-college individuals work the night shift (500,000 for college degree holders), starting work between 7:00pm and midnight. 8 million non-college workers start work between 4 and 6 am (2 million for college degree holders). Finding child care, getting enough sleep, going out to dinner with a spouse or friends, helping a child with homework and generally participating in society—all of it is harder.24

The non-college workforce has significantly less work-life flexibility than their graduate counterparts. The recent trend towards remote work has disproportionately favored the college educated, as 15.7 million (29.5%) work from home while only 8 million (11%) non-college workers have the opportunity.25
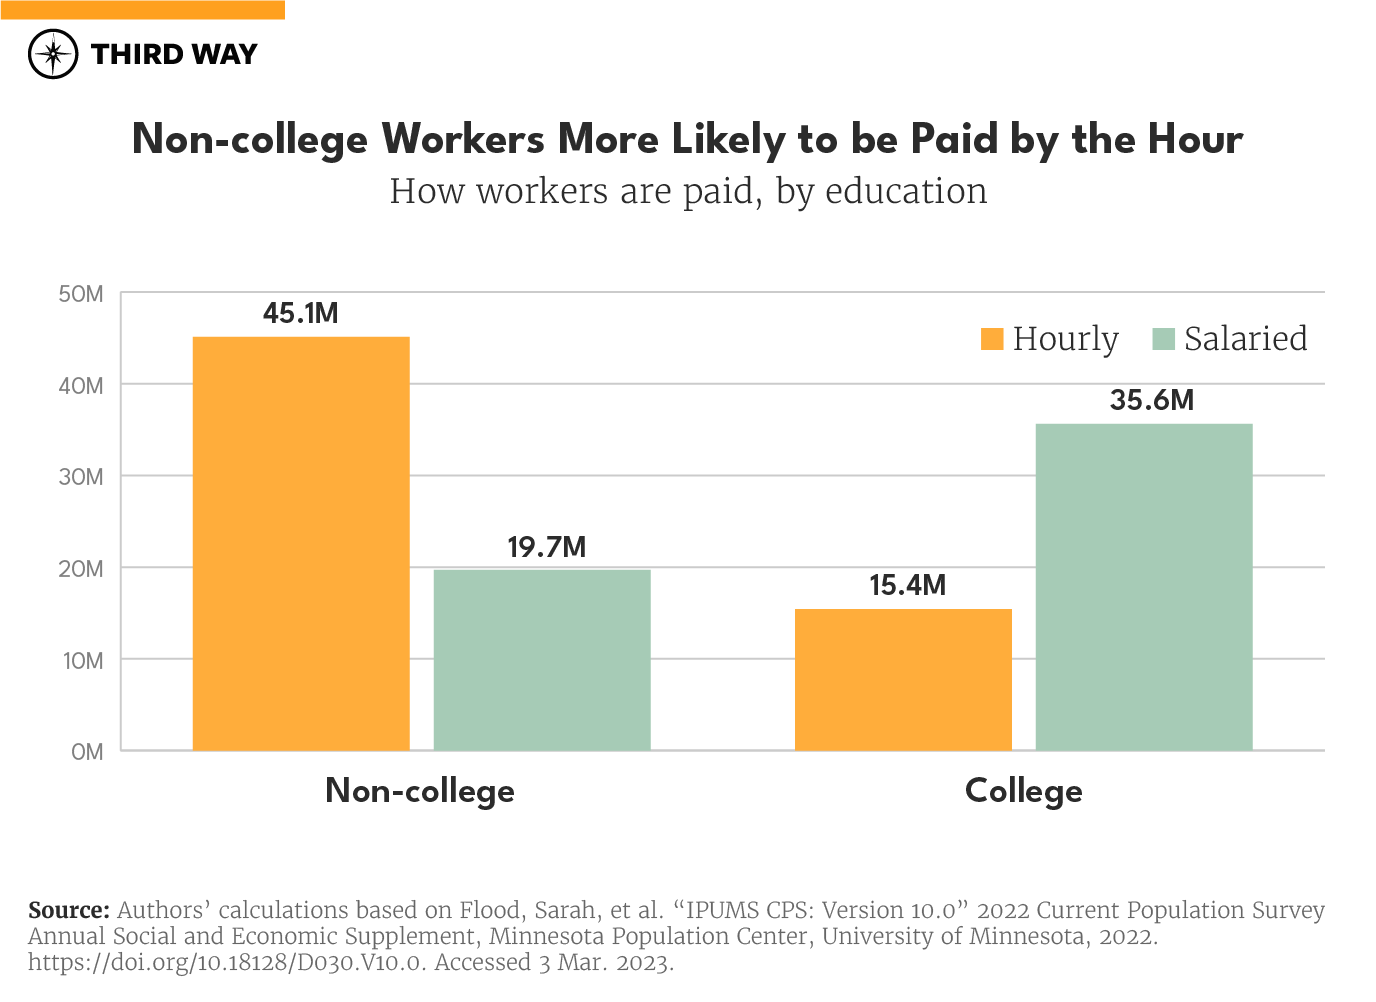
Mostly Punching the Clock
The hourly wage workforce is almost entirely non-college educated.26 45 million non-college workers get paid by the hour while just 20 million are salaried.27 In comparison, 15 million college-educated workers get paid by the hour while 36 million are salaried.28 Seven of ten non-college educated workers are paid by the hour; seven of ten college-educated workers are paid a salary.29
Paid vacation time, sick leave, retirement benefits, and flexible scheduling are more often the purview of salaried work.30 This workplace flexibility makes it easier for workers to pick up their kids from school, go grocery shopping, deal with home maintenance, or handle anything else life throws their way.
More Detached from the Workforce
31 million non-college Americans were unemployed or outside the labor force in March 2022, roughly 30% of the working age, non-college population.31 3 million were officially unemployed, and 28 million were not in the labor force.32 Of those 28 million, 250,000 were marginally attached to the labor force, meaning they want a job, have looked for work sometime in the past 12 months, but are no longer looking for work.33
Just 10 million of the college educated were unemployed or outside the labor force in March 2022, or 16% of the working age, college population.34 1 million were unemployed and 9 million were not in the labor force.35 Of those 9 million, 61,000 were marginally attached to the labor force.36

25 million (83%) of the non-college educated not working in March 2022 did not work at all in 2021.37 19 million did not work because they could not find work, were ill or disabled, or were taking care of their home or a family member.38 In contrast, just 8 million (77%) of the college educated not working in March 2022 did not work at all in 2021.39 And an even smaller 5 million did not do so because they could not find work, were ill or disabled, or were taking care of their home or a family member.40

There are over four times as many non-college educated who find it difficult or impossible to work because of an underlying health condition.41 13 million non-college Americans have a disability that limits or prevents work, versus 3 million of the college educated. 4 million of the non-college educated have poor health, compared to 1 million college-educated individuals.42
Half the Pay
The median income of non-college households is $61,000, less than half 0f the $127,000 college-educated households take in.43 Four out of five households in the bottom income quintile do not have a college degree.44 Three out of four household heads in the top income quintile have a college degree.45

10 million non-college educated, working age adults are in poverty and 4 million more would be in poverty without tax credits and government transfers.46 Just 2 million college-educated, working age adults are in poverty, with only 40,000 additional college-educated people being lifted out of poverty through public assistance.47

Renters, Owners, and Movers
College households own more and owe more. But their owing more reflects lenders’ greater faith in their credit relative to their non-college counterparts.48 Non-college educated households are denied any form of credit, including a mortgage, at higher rates than college-educated households.49
71% of college households own their home while just 57% of non-college households own theirs.50 Likewise, mortgage balances average 112% of college households’ income while it is only 71% for those who didn’t graduate college.51

Both populations move at similar rates (9-10% each year), but for different reasons. The non-college population is twice as likely to leave their home for adverse economic reasons such as losing their jobs, searching for cheaper housing, or foreclosure and eviction.52 College graduates are 20% more likely to move for a positive economic reason. If a calamity pushes a household out of its home, that house is disproportionately likely to be non-college.

The Uncovered
Of the 19 million uninsured Americans aged 25-64, 16 million didn’t graduate from college.53 Accordingly, non-college Americans are three times as likely to have medical debt (18% to 6%).54
Non-college Americans are also more likely to have public insurance. Of the 109 million non-college Americans, 25% have public insurance compared to only 8% of college graduates.55

Little to No Wealth
The college educated have amassed a large percentage of American wealth. Median household assets for working age, college-educated Americans is $442,700, compared to $124,400 for those without bachelor’s degrees.56 When mortgage and other debt is tallied, median household net worth for college-educated Americans is $252,400, compared to $58,800 for those without bachelor’s degrees.57
A large share of all Americans’ wealth comes from the value of their homes, but since non-college workers have fewer non-real estate assets than the college educated, homeownership is a larger portion of their wealth. Many households also diversify their assets by investing in the stock market, but college households invest at a significantly higher rate than non-college households (75% compared to 43%).58

On the other side of the ledger, mortgages are a large portion of most households’ debt (on average 54% for college educated and 39% for non-college). 38% of college households have education loan debt; 21% of households lacking a degree do as well.59
A household’s ability to pay off its debt directly relates to its income. Average nonmortgage debt as a percentage of income is 65% for college graduates and 40% for those without degrees.60 Overall, median nonmortgage debt for college-educated households is $21,900, surpassing non-college households’ $8,000.
Reliant on Federal Retirement Programs
Most non-college educated households are completely reliant on federal retirement programs for their elder years. 10 million of 16 million (60%) non-college educated households close to retirement (aged 55-64) have zero private retirement funds compared to only 2.3 million out of 8 million (29%) college households.61 Among those near retirement who do have private accounts, the median account balance for college workers is nearly four times higher ($282,800 to $73,300). Non-college households of all ages are also less likely to have a traditional employer pension (5% vs 12%).

A household can only save for retirement if it can afford to tuck away some income now. In 2018, only 28 million (52%) non-college households could afford to save money.62 In comparison, 24 million (69%) college-educated households saved money that year. A household that lacks retirement funds must stay in the workforce longer and is more likely to lower living its standards.63
Conclusion
The lives of college and non-college Americans have grown apart.
Over the last two years, the Biden Administration has focused on non-college America with large-scale initiatives creating jobs and driving down costs, in what he calls a blue-collar blueprint to rebuild America. It includes increasing the number of jobs available to non-college workers. Implementing recent jobs bills like CHIPS and infrastructure will help, as will easing supply chains, making entrepreneurship easier, and reversing punitive regulations like non-compete agreements.
Separately, giving workers the tools to succeed in those middle-class jobs can help these workers gain a more secure foothold in the economy. The apprenticeship model works splendidly in other advanced nations expanding skills and conferring status; it is vastly underutilized in America. Expanding apprenticeships beyond traditional fields would open this career ladder to more non-college women and people of color. As would expanded access to child care and paid leave.
Making a middle-class life more affordable, like capping out-of-pocket health care costs so no one is squeezed by medical debt, or boosting the earned income tax credit and child tax credit so working parents stay above water, can remove some of the precariousness of a working wage life.
But ultimately a greater understanding of the differences between non-college and college degree holders and the lives that they lead must be part of answer.
Appendix: Methodology
For this report, we used several public use microdata series. First is the 2021 one-year American Community Survey conducted by the U.S. Census Bureau in the 12 months of 2021. Second is the 2022 Current Population Survey Annual Social and Economic Supplement conducted by the U.S. Bureau of Labor Statistics and the U.S. Census Bureau in the three months surrounding March 2022. These two social and economic survey datasets are processed and made available by the Minnesota Population Center at the University of Minnesota (IPUMS). Third we used the Federal Reserve’s triennial Survey of Consumer Finances (SCF) for 2019.
In each dataset, we made our calculations for two groups of Americans: working age (25-64) people with and without a bachelor’s degree. All our counts were derived through the summation of the appropriate survey weights. All calculations were made in R. Code is available upon request from the authors.
In our occupational analysis, we sort 2018 U.S. Census Bureau defined occupations into two categories: blue-collar and white-collar. Blue-collar occupations include service occupations; farming, fishing, and forestry occupations; construction and extraction occupations; installation, maintenance, and repair occupations; production occupations; and transportation and material moving occupations. White-collar occupations include management, business, and financial occupations; professional and related occupations; sales and related occupations; and office and administrative support occupations.
Much of the financial data for this report comes from the SCF. It provides detailed information on household finances ranging from debt to retirement funds. Per Federal Reserve Practice, several thousand families are interviewed and each observation is multiply imputed to account for missing values. To calculate household counts while accounting for this sampling technique, the authors calculated precise percentages and applied them to household counts from the 2019 CPS.
Endnotes
Manning, Jennifer E. “Membership of the 117th Congress: A Profile.” Congressional Research Service, Report No. R46705, 14 Dec. 2022, https://crsreports.congress.gov/product/pdf/R/R46705. Accessed 3 Mar. 2022.
Manning, Jennifer E. “Membership of the 117th Congress: A Profile.” Congressional Research Service, Report No. R46705, 14 Dec. 2022, https://crsreports.congress.gov/product/pdf/R/R46705. Accessed 3 Mar. 2022.
Authors’ calculations based on Ruggles, Steven, et al. “IPUMS USA: Version 23.0”. 2021 1-year American Community Survey, Minnesota Population Center, University of Minnesota, 2022. https://doi.org/10.18128/D010.V12.0. Accessed 3 Mar. 2023.
Authors’ calculations based on Ruggles, Steven, et al. “IPUMS USA: Version 23.0”. 2021 1-year American Community Survey, Minnesota Population Center, University of Minnesota, 2022. https://doi.org/10.18128/D010.V12.0. Accessed 3 Mar. 2023.
Authors’ calculations based on Ruggles, Steven, et al. “IPUMS USA: Version 23.0”. 2021 1-year American Community Survey, Minnesota Population Center, University of Minnesota, 2022. https://doi.org/10.18128/D010.V12.0. Accessed 3 Mar. 2023.
Authors’ calculations based on Ruggles, Steven, et al. “IPUMS USA: Version 23.0”. 2021 1-year American Community Survey, Minnesota Population Center, University of Minnesota, 2022. https://doi.org/10.18128/D010.V12.0. Accessed 3 Mar. 2023.
Authors’ calculations based on Ruggles, Steven, et al. “IPUMS USA: Version 23.0”. 2021 1-year American Community Survey, Minnesota Population Center, University of Minnesota, 2022. https://doi.org/10.18128/D010.V12.0. Accessed 3 Mar. 2023.
Table POV11: Poverty Status by State: 2021.” U.S. Census Bureau, 2022, https://www.census.gov/data/tables/time-series/demo/income-poverty/cps-pov/pov-01.html. Accessed 3 Mar. 2022.
Cromwell, Mary. “Renters More Likely Than Homeowners to Spend More Than 30% of Income on Housing in Almost All Counties.” U.S. Census Bureau, 8 Dec. 2022, https://www.census.gov/library/stories/2022/12/housing-costs-burden.html. Accessed 3 Mar. 2022. And “Release Tables: Real Median Household Income by State, Annual, 2021.” Federal Reserve Bank of St. Louis, 2022, https://fred.stlouisfed.org/release/tables?eid=259515&rid=249. Accessed 3 Mar. 2022.
Authors’ calculations based on Ruggles, Steven, et al. “IPUMS USA: Version 23.0”. 2021 1-year American Community Survey, Minnesota Population Center, University of Minnesota, 2022. https://doi.org/10.18128/D010.V12.0. Accessed 3 Mar. 2023.
Authors’ calculations based on Ruggles, Steven, et al. “IPUMS USA: Version 23.0”. 2021 1-year American Community Survey, Minnesota Population Center, University of Minnesota, 2022. https://doi.org/10.18128/D010.V12.0. Accessed 3 Mar. 2023.
Authors’ calculations based on Ruggles, Steven, et al. “IPUMS USA: Version 23.0”. 2021 1-year American Community Survey, Minnesota Population Center, University of Minnesota, 2022. https://doi.org/10.18128/D010.V12.0. Accessed 3 Mar. 2023.
Authors’ calculations based on Ruggles, Steven, et al. “IPUMS USA: Version 23.0”. 2021 1-year American Community Survey, Minnesota Population Center, University of Minnesota, 2022. https://doi.org/10.18128/D010.V12.0. Accessed 3 Mar. 2023.
Authors’ calculations based on Ruggles, Steven, et al. “IPUMS USA: Version 23.0”. 2021 1-year American Community Survey, Minnesota Population Center, University of Minnesota, 2022. https://doi.org/10.18128/D010.V12.0. Accessed 3 Mar. 2023.
Authors’ calculations based on Ruggles, Steven, et al. “IPUMS USA: Version 23.0”. 2021 1-year American Community Survey, Minnesota Population Center, University of Minnesota, 2022. https://doi.org/10.18128/D010.V12.0. Accessed 3 Mar. 2023.
“Table 318.10: Degrees conferred by postsecondary institutions, by level of degree and sex of student: Selected years, 1869-70 through 2028-29.” Projections of Education Statistics to 2028, National Center for Education Statistics, 2022, https://nces.ed.gov/programs/digest/d18/tables/dt18_318.10.asp. Accessed 3 Mar. 2023.
Authors’ calculations based on Flood, Sarah, et al. “IPUMS CPS: Version 10.0” 2022 Current Population Survey Annual Social and Economic Supplement, Minnesota Population Center, University of Minnesota, 2022. https://doi.org/10.18128/D030.V10.0. Accessed 3 Mar. 2023.
Authors’ calculations based on Flood, Sarah, et al. “IPUMS CPS: Version 10.0” 2022 Current Population Survey Annual Social and Economic Supplement, Minnesota Population Center, University of Minnesota, 2022. https://doi.org/10.18128/D030.V10.0. Accessed 3 Mar. 2023.
Authors’ calculations based on Flood, Sarah, et al. “IPUMS CPS: Version 10.0” 2022 Current Population Survey Annual Social and Economic Supplement, Minnesota Population Center, University of Minnesota, 2022. https://doi.org/10.18128/D030.V10.0. Accessed 3 Mar. 2023.
Authors’ calculations based on Flood, Sarah, et al. “IPUMS CPS: Version 10.0” 2022 Current Population Survey Annual Social and Economic Supplement, Minnesota Population Center, University of Minnesota, 2022. https://doi.org/10.18128/D030.V10.0. Accessed 3 Mar. 2023.
Authors’ calculations based on Flood, Sarah, et al. “IPUMS CPS: Version 10.0” 2022 Current Population Survey Annual Social and Economic Supplement, Minnesota Population Center, University of Minnesota, 2022. https://doi.org/10.18128/D030.V10.0. Accessed 3 Mar. 2023.
Hughes, Bradley T. et al. “Occupational Prestige: The Status Component of Socioeconomic Status.” PsyArXiv, 28 Sep. 2022, https://psyarxiv.com/6qgxv/. Accessed 3 Mar. 2022.
Ruggles, Steven, Sarah Flood, Ronald Goeken, Megan Schouweiler and Matthew Sobek. “IPUMS USA: Version 23.0”. Dataset, Minnesota Population Center, University of Minnesota, 2022. https://doi.org/10.18128/D010.V12.0. Accessed 3 Mar. 2023.
Michael Price. “The risks of night work”. Article, American Psychological Association, Jan 2011, Vol 42, No.1. https://www.apa.org/monitor/2011/01/night-work. Accessed 3 Mar. 2023. andSerena Lei. “Working 5 to 9: nonstandard work schedules come with their own set of headaches”. Article, The Urban Institute, 14 Aug. 2013. https://www.urban.org/urban-wire/working-5-9-nonstandard-work-schedules-come-their-own-set-headaches. Accessed 3 Mar. 2023.
Ruggles, Steven, Sarah Flood, Ronald Goeken, Megan Schouweiler and Matthew Sobek. “IPUMS USA: Version 23.0”. Dataset, Minnesota Population Center, University of Minnesota, 2022. https://doi.org/10.18128/D010.V12.0. Accessed 3 Mar. 2023.
This section of our analysis is focused solely on wage and salary workers and excludes the self-employed.
Authors’ calculations based on Flood, Sarah, et al. “IPUMS CPS: Version 10.0” 2022 Current Population Survey Annual Social and Economic Supplement, Minnesota Population Center, University of Minnesota, 2022. https://doi.org/10.18128/D030.V10.0. Accessed 3 Mar. 2023.
Authors’ calculations based on Flood, Sarah, et al. “IPUMS CPS: Version 10.0” 2022 Current Population Survey Annual Social and Economic Supplement, Minnesota Population Center, University of Minnesota, 2022. https://doi.org/10.18128/D030.V10.0. Accessed 3 Mar. 2023.
Authors’ calculations based on Flood, Sarah, et al. “IPUMS CPS: Version 10.0” 2022 Current Population Survey Annual Social and Economic Supplement, Minnesota Population Center, University of Minnesota, 2022. https://doi.org/10.18128/D030.V10.0. Accessed 3 Mar. 2023.
Brenan, Megan. “Hourly Workers Unhappier Than Salaried on Many Job Aspects.” Gallup, 23 Aug. 2017, https://news.gallup.com/poll/216746/hourly-workers-unhappier-salaried-job-aspects.aspx. Accessed on 3 Mar. 2023.
Authors’ calculations based on Flood, Sarah, et al. “IPUMS CPS: Version 10.0” 2022 Current Population Survey Annual Social and Economic Supplement, Minnesota Population Center, University of Minnesota, 2022. https://doi.org/10.18128/D030.V10.0. Accessed 3 Mar. 2023.
Authors’ calculations based on Flood, Sarah, et al. “IPUMS CPS: Version 10.0” 2022 Current Population Survey Annual Social and Economic Supplement, Minnesota Population Center, University of Minnesota, 2022. https://doi.org/10.18128/D030.V10.0. Accessed 3 Mar. 2023.
Authors’ calculations based on Flood, Sarah, et al. “IPUMS CPS: Version 10.0” 2022 Current Population Survey Annual Social and Economic Supplement, Minnesota Population Center, University of Minnesota, 2022. https://doi.org/10.18128/D030.V10.0. Accessed 3 Mar. 2023.
Authors’ calculations based on Flood, Sarah, et al. “IPUMS CPS: Version 10.0” 2022 Current Population Survey Annual Social and Economic Supplement, Minnesota Population Center, University of Minnesota, 2022. https://doi.org/10.18128/D030.V10.0. Accessed 3 Mar. 2023.
Authors’ calculations based on Flood, Sarah, et al. “IPUMS CPS: Version 10.0” 2022 Current Population Survey Annual Social and Economic Supplement, Minnesota Population Center, University of Minnesota, 2022. https://doi.org/10.18128/D030.V10.0. Accessed 3 Mar. 2023.
Authors’ calculations based on Flood, Sarah, et al. “IPUMS CPS: Version 10.0” 2022 Current Population Survey Annual Social and Economic Supplement, Minnesota Population Center, University of Minnesota, 2022. https://doi.org/10.18128/D030.V10.0. Accessed 3 Mar. 2023.
Authors’ calculations based on Flood, Sarah, et al. “IPUMS CPS: Version 10.0” 2022 Current Population Survey Annual Social and Economic Supplement, Minnesota Population Center, University of Minnesota, 2022. https://doi.org/10.18128/D030.V10.0. Accessed 3 Mar. 2023.
Authors’ calculations based on Flood, Sarah, et al. “IPUMS CPS: Version 10.0” 2022 Current Population Survey Annual Social and Economic Supplement, Minnesota Population Center, University of Minnesota, 2022. https://doi.org/10.18128/D030.V10.0. Accessed 3 Mar. 2023.
Authors’ calculations based on Flood, Sarah, et al. “IPUMS CPS: Version 10.0” 2022 Current Population Survey Annual Social and Economic Supplement, Minnesota Population Center, University of Minnesota, 2022. https://doi.org/10.18128/D030.V10.0. Accessed 3 Mar. 2023.
Authors’ calculations based on Flood, Sarah, et al. “IPUMS CPS: Version 10.0” 2022 Current Population Survey Annual Social and Economic Supplement, Minnesota Population Center, University of Minnesota, 2022. https://doi.org/10.18128/D030.V10.0. Accessed 3 Mar. 2023.
Authors’ calculations based on Flood, Sarah, et al. “IPUMS CPS: Version 10.0” 2022 Current Population Survey Annual Social and Economic Supplement, Minnesota Population Center, University of Minnesota, 2022. https://doi.org/10.18128/D030.V10.0. Accessed 3 Mar. 2023.
Authors’ calculations based on Flood, Sarah, et al. “IPUMS CPS: Version 10.0” 2022 Current Population Survey Annual Social and Economic Supplement, Minnesota Population Center, University of Minnesota, 2022. https://doi.org/10.18128/D030.V10.0. Accessed 3 Mar. 2023.
Authors’ calculations based on Flood, Sarah, et al. “IPUMS CPS: Version 10.0” 2022 Current Population Survey Annual Social and Economic Supplement, Minnesota Population Center, University of Minnesota, 2022. https://doi.org/10.18128/D030.V10.0. Accessed 3 Mar. 2023.
Authors’ calculations based on Flood, Sarah, et al. “IPUMS CPS: Version 10.0” 2022 Current Population Survey Annual Social and Economic Supplement, Minnesota Population Center, University of Minnesota, 2022. https://doi.org/10.18128/D030.V10.0. Accessed 3 Mar. 2023.
Authors’ calculations based on Flood, Sarah, et al. “IPUMS CPS: Version 10.0” 2022 Current Population Survey Annual Social and Economic Supplement, Minnesota Population Center, University of Minnesota, 2022. https://doi.org/10.18128/D030.V10.0. Accessed 3 Mar. 2023.
Authors’ calculations based on Flood, Sarah, et al. “IPUMS CPS: Version 10.0” 2022 Current Population Survey Annual Social and Economic Supplement, Minnesota Population Center, University of Minnesota, 2022. https://doi.org/10.18128/D030.V10.0. Accessed 3 Mar. 2023.
Authors’ calculations based on Flood, Sarah, et al. “IPUMS CPS: Version 10.0” 2022 Current Population Survey Annual Social and Economic Supplement, Minnesota Population Center, University of Minnesota, 2022. https://doi.org/10.18128/D030.V10.0. Accessed 3 Mar. 2023.
J. Michael Collins. “Education levels and mortgage application outcomes: Evidence of financial literacy.” Discussion paper, University of Wisconsin-Madison, Institute for Research on Poverty, Dec 2009. https://www.irp.wisc.edu/publications/dps/pdfs/dp136909.pdf. Accessed 3 Mar. 2023.
Authors’ calculations based on Board of Governors of the Federal Reserve System (U.S.). “Survey of Consumer Finances”. Dataset, Federal Reserve, 2019. https://www.federalreserve.gov/econres/scfindex.htm. Accessed 3 Mar. 2023.
Authors’ calculations based on Flood, Sarah, et al. “IPUMS CPS: Version 10.0” 2022 Current Population Survey Annual Social and Economic Supplement, Minnesota Population Center, University of Minnesota, 2022. https://doi.org/10.18128/D030.V10.0. Accessed 3 Mar. 2023.
Authors’ calculations based on Flood, Sarah, et al. “IPUMS CPS: Version 10.0” 2022 Current Population Survey Annual Social and Economic Supplement, Minnesota Population Center, University of Minnesota, 2022. https://doi.org/10.18128/D030.V10.0. Accessed 3 Mar. 2023.
Ahmadi, Ladan, David Kendall, Kylie Murdock and Jim Kessler. “End Medical Debt”. Report, Third Way, 10 Jan. 2023. https://www.thirdway.org/report/end-medical-debt. Accessed 3 Mar. 2023.
Authors’ calculations based on Flood, Sarah, et al. “IPUMS CPS: Version 10.0” 2022 Current Population Survey Annual Social and Economic Supplement, Minnesota Population Center, University of Minnesota, 2022. https://doi.org/10.18128/D030.V10.0. Accessed 3 Mar. 2023.
Authors’ calculations based on Board of Governors of the Federal Reserve System (U.S.). “Survey of Consumer Finances”. Dataset, Federal Reserve, 2019. https://www.federalreserve.gov/econres/scfindex.htm. Accessed 3 Mar. 2023.
Authors’ calculations based on Board of Governors of the Federal Reserve System (U.S.). “Survey of Consumer Finances”. Dataset, Federal Reserve, 2019. https://www.federalreserve.gov/econres/scfindex.htm. Accessed 3 Mar. 2023.
Authors’ calculations based on Board of Governors of the Federal Reserve System (U.S.). “Survey of Consumer Finances”. Dataset, Federal Reserve, 2019. https://www.federalreserve.gov/econres/scfindex.htm. Accessed 3 Mar. 2023.
Authors’ calculations based on Board of Governors of the Federal Reserve System (U.S.). “Survey of Consumer Finances”. Dataset, Federal Reserve, 2019. https://www.federalreserve.gov/econres/scfindex.htm. Accessed 3 Mar. 2023.
Authors’ calculations based on Board of Governors of the Federal Reserve System (U.S.). “Survey of Consumer Finances”. Dataset, Federal Reserve, 2019. https://www.federalreserve.gov/econres/scfindex.htm. Accessed 3 Mar. 2023.
Authors’ calculations based on Board of Governors of the Federal Reserve System (U.S.). “Survey of Consumer Finances”. Dataset, Federal Reserve, 2019. https://www.federalreserve.gov/econres/scfindex.htm. Accessed 3 Mar. 2023. &, Sarah, et al. “IPUMS CPS: Version 10.0” 2019 Current Population Survey Annual Social and Economic Supplement, Minnesota Population Center, University of Minnesota, 2022. https://doi.org/10.18128/D030.V10.0. Accessed 3 Mar. 2023.
Authors’ calculations based on Board of Governors of the Federal Reserve System (U.S.). “Survey of Consumer Finances”. Dataset, Federal Reserve, 2019. https://www.federalreserve.gov/econres/scfindex.htm. Accessed 3 Mar. 2023.
Semuels, Alana. “This Is What Life Without Retirement Savings Looks Like”. Article, The Atlantic, 22 Feb. 2018. https://www.theatlantic.com/business/archive/2018/02/pensions-safety-net-california/553970/. Accessed 3 Mar. 2023.
Subscribe
Get updates whenever new content is added. We'll never share your email with anyone.