Report Published January 3, 2013 · Updated January 3, 2013 · 34 minute read
The Next Phase: Ushering in a New Era of American Retirement

What's NEXT
Well before the Great Recession, middle-class Americans questioned the ability of the public sector to adapt to the wrenching forces re-shaping society. And as we’ve begun to see a “new economic normal” many Americans are left wondering if anyone or any institution could help them, making it imperative that both parties—but especially the self-identified party of government—re-think their 20th century orthodoxies.
With this report Third Way is launching NEXT—a series of in-depth commissioned research papers that look at the economic trends that will shape policy over the coming decades. In particular, we’re bringing this deeper, more provocative academic work to bear on what we see as the central domestic policy challenge of the 21st century: how to ensure American middle class prosperity and individual success in an era of ever-intensifying globalization and technological upheaval. It’s the defining question of our time, and one that as a country we’ve yet to answer.
Each of the papers we commission over the next several years will take a deeper dive into one aspect of middle class prosperity—such as education, retirement, achievement, and the safety net. Our aim is to challenge, and ultimately change, some of the prevailing assumptions that routinely define, and often constrain, Democratic and progressive economic and social policy debates. And by doing that, we’ll be able to help push the conversation towards a new, more modern understanding of America’s middle class challenges—and spur fresh ideas for a new era.
This first NEXT paper addresses a novel and potentially powerful idea—phased retirement—into the well-worn debates around social security and the aging of the American population. According to Dr. John C. Scott, “phased retirement is the reduction of work with a long-term employer as an older employee approaches full retirement. Under this framework, phased retirement is part of the broader concepts of part-time work and flexible work arrangements.”
Until now the debate about an aging America has been more or less a top down debate; focusing on the cost of Social Security and Medicare. One of the most commonly discussed options regarding the future of those programs is whether or not to increase the age at which people are eligible for benefits in order to save money. This debate invariably invites thorny questions; on the one hand people are living longer, on the other hand, people who work manual labor are often forced to retire early.
But, as Scott shows us, while this debate has been going on in Washington, retirement-eligible Americans have been making their own adaptations to retirement—changing it from an all or nothing proposition to a more gradual transition from work.
Several factors are driving “phased retirement.” First and foremost is that fact that, as Scott points out, “many indicators point to inadequate income for retired Americans.” In the paper, Scott shows how the shift from defined benefit retirement plans to defined contribution retirement plans has led to an increase in labor force participation rates for older workers. Other factors, such as dramatic increases in health and longevity and changes in the nature of the economy that de-emphasize physical labor make phased retirement a feasible alternative for many workers.
Scott’s paper illustrates how some of these phased retirement programs work and he argues that there are many advantages to phased retirement: perhaps the biggest being that they “delay or slow withdrawals from pension plans, thereby preserving retirement assets” and they decrease pressure on the social security system. In his conclusion he points to some of the ways that current pension law inadvertently stands in the way of phased retirement programs.
This paper is the beginning of a new way of thinking about retirement for those of us on the center-left who worry about the effects of increasing the retirement age on some workers, but who understand the fiscal pressure an aging population will place on the current federal budget. Our hope is that the ideas in this paper may increase the economic security of middle class Americans in their later years.
Dr. Elaine C. Kamarck
Resident Scholar, Third Way
Jonathan Cowan
President, Third Way
—
Older Americans are changing the very definition of what it means to be retired. Work and retirement affects not just the individual well-being of the person involved but also the broad economy and the fiscal health of the nation. Older persons who continue working contribute to national income and rely less on savings, pensions, and Social Security. But what it means to “retire” or “work” is not clear beyond the two extremes of: (a) complete withdrawal from the labor force while receiving pension or Social Security benefits and (b) working for compensation but not receiving any pension or Social Security benefits.1 This paper will explore a third option called phased retirement.
Phased retirement is generally understood to mean a gradual reduction in paid work as a transition to full retirement. This report discusses the idea of phased retirement in the context of broader trends in population aging, old-age income security, and the aging workforce.
The report is organized in three sections. Section One asks “Why do older Americans work?” in an attempt to explore the fact that work by older Americans is both more important and increasingly prevalent. Section Two asks “What is Phased Retirement?” and provides both definitions of the term and examples of how different institutions are exploring this new model. Section Three looks at broader trends in both aging and in retirement security and shows how phased retirement could help boost retirement savings, provide additional income, and contribute to the broader society through taxes and less demands on government transfers. In the conclusion, I discuss the obstacles to expanding phased retirement.
Section One
Why Do Older Americans Work?
Work by older Americans is both important and increasingly prevalent. As Maestos and Zissimopoulos note, “the economic impact of population aging on our future standard of living depends a great deal on the evolution of labor force participation among older workers."2 Earnings from work provide 30% of older Americans’ aggregate income, on average.3 Table 1, shown below, provides the historical trends in income sources of older Americans, and it shows that the share of aggregate income coming from earnings has increased since the mid-1980s, partly because older people, especially women, increasingly work past age 55. In 2012, over 7 million Americans age 65 and over were in the labor force (working or actively seeking work), including 3.9 million men and 3.1 million women. They constituted 4.6% of the U.S. labor force.4
Table 1: Percentage Distribution of Sources of Income for Married Couples and Non-married Persons Age 65 and Older, 1962-2010
Year | Social Security | Asset Income | Pensions | Earnings | Other |
1962 | 31 | 16 | 9 | 28 | 16 |
1967 | 34 | 15 | 12 | 29 | 10 |
1976 | 39 | 18 | 16 | 23 | 4 |
1978 | 38 | 19 | 16 | 23 | 4 |
1980 | 39 | 22 | 16 | 19 | 4 |
1982 | 39 | 25 | 15 | 18 | 3 |
1984 | 38 | 28 | 15 | 16 | 3 |
1986 | 38 | 26 | 16 | 17 | 3 |
1988 | 38 | 25 | 17 | 17 | 3 |
1990 | 36 | 24 | 18 | 18 | 4 |
1992 | 40 | 21 | 20 | 17 | 2 |
1994 | 42 | 18 | 19 | 18 | 3 |
1996 | 40 | 18 | 19 | 20 | 3 |
1998 | 38 | 20 | 19 | 21 | 2 |
1999 | 38 | 19 | 19 | 21 | 3 |
2000 | 38 | 18 | 18 | 23 | 3 |
2001 | 39 | 16 | 18 | 24 | 3 |
2002 | 39 | 14 | 19 | 25 | 3 |
2003 | 39 | 14 | 19 | 25 | 2 |
2004 | 39 | 13 | 20 | 26 | 2 |
2005 | 37 | 13 | 19 | 28 | 3 |
2006 | 37 | 15 | 18 | 28 | 3 |
2008 | 37 | 13 | 19 | 30 | 3 |
2009 | 37 | 11 | 19 | 30 | 3 |
2010 | 37 | 11 | 19 | 30 | 3 |
Source: Federal Interagency Forum on Aging-Related Statistics. Older Americans 2012. The underlying data was collected through the Current Population Survey, Annual Social and Economic Supplement, 1977-2011. Note: Data for various years is not available.
Labor Force Participation
A key workforce indicator is the labor force participation rate for various age groups. Figures 1a and 1b demonstrate the changes in labor force participation by different age groups (55 to 61, 62-64, and 65 and older) for males and females, respectively. From the 1950s to the late 1980s, older men were increasingly leaving the labor force as both private employer-sponsored pensions and Social Security expanded. According to data from the Bureau of Labor Statistics, 5 out of 6 men aged 55 to 64 participated in the labor force in the 1950s. By 1985, about 66% of men in that age group were working or looking for work. Since the 1980s, the labor force participation rate among men aged 55 to 61 has fluctuated around 75%. But labor force participation of men aged 62-plus steadily grew over the past 20 years.5
Among older women below the age of 70, the labor force participation rate has been rising sharply since the mid-1980s. Even labor force participation among women 70 and older has seen a modest increase over the last 10 years. The acceleration in labor force participation by women has narrowed the labor force participation gap between men and women. In 1963, men aged 55 to 61 and 62 to 64 had participation rates 46% and 47% higher, respectively, than women. By 2011, the difference was 10% and 8.5%, respectively. Over the same time period, the difference in participation rates for men and women aged 65 to 69 dropped from 24% to 10%.
Figure 1a: Labor Force Participation of Men Age 55 and Over, by Age Group, Annual Averages, 1963–2011
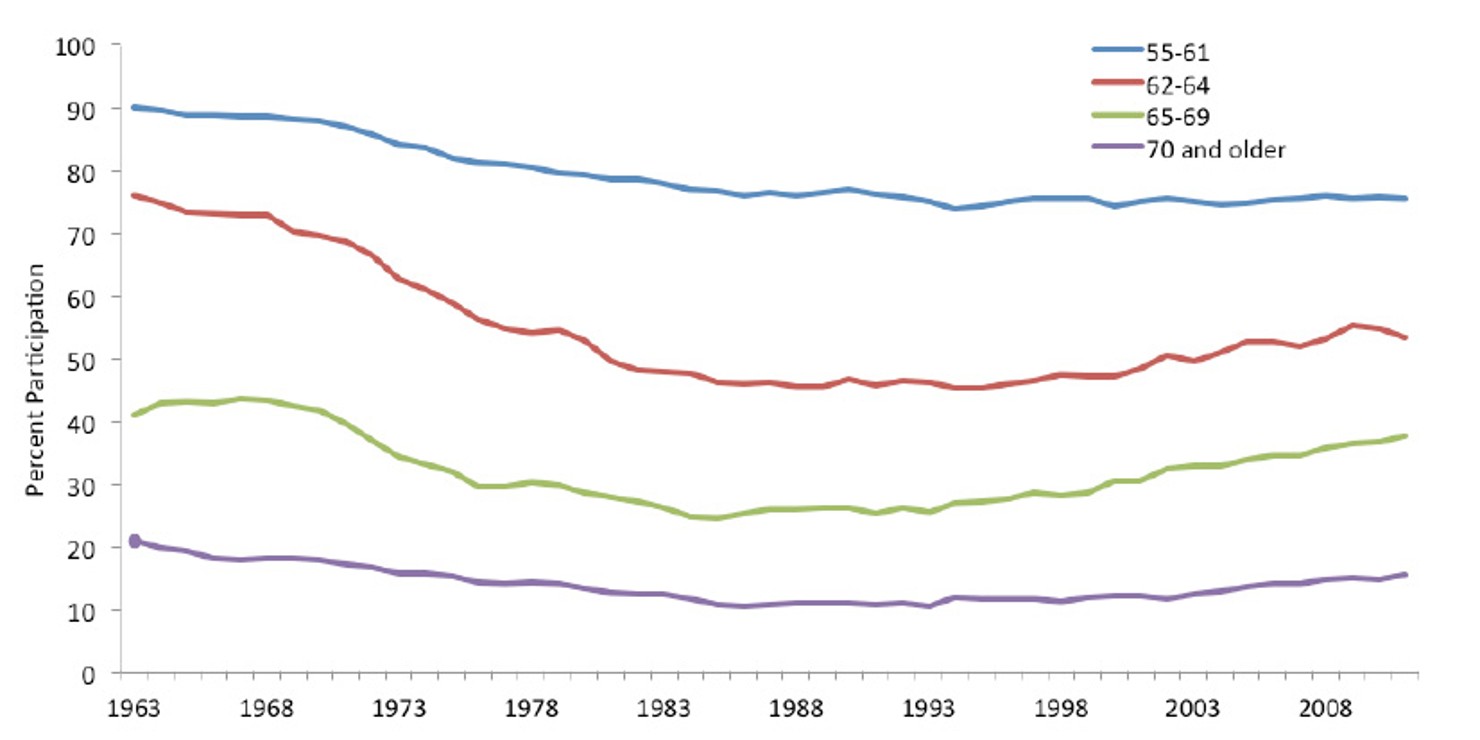
Source: Author’s compilation of data from the Bureau of Labor Statistics, Current Population Survey.
Figure 1b: Labor Force Participation of Women Age 55 and Over, by Age Group, Annual Averages, 1963–2011
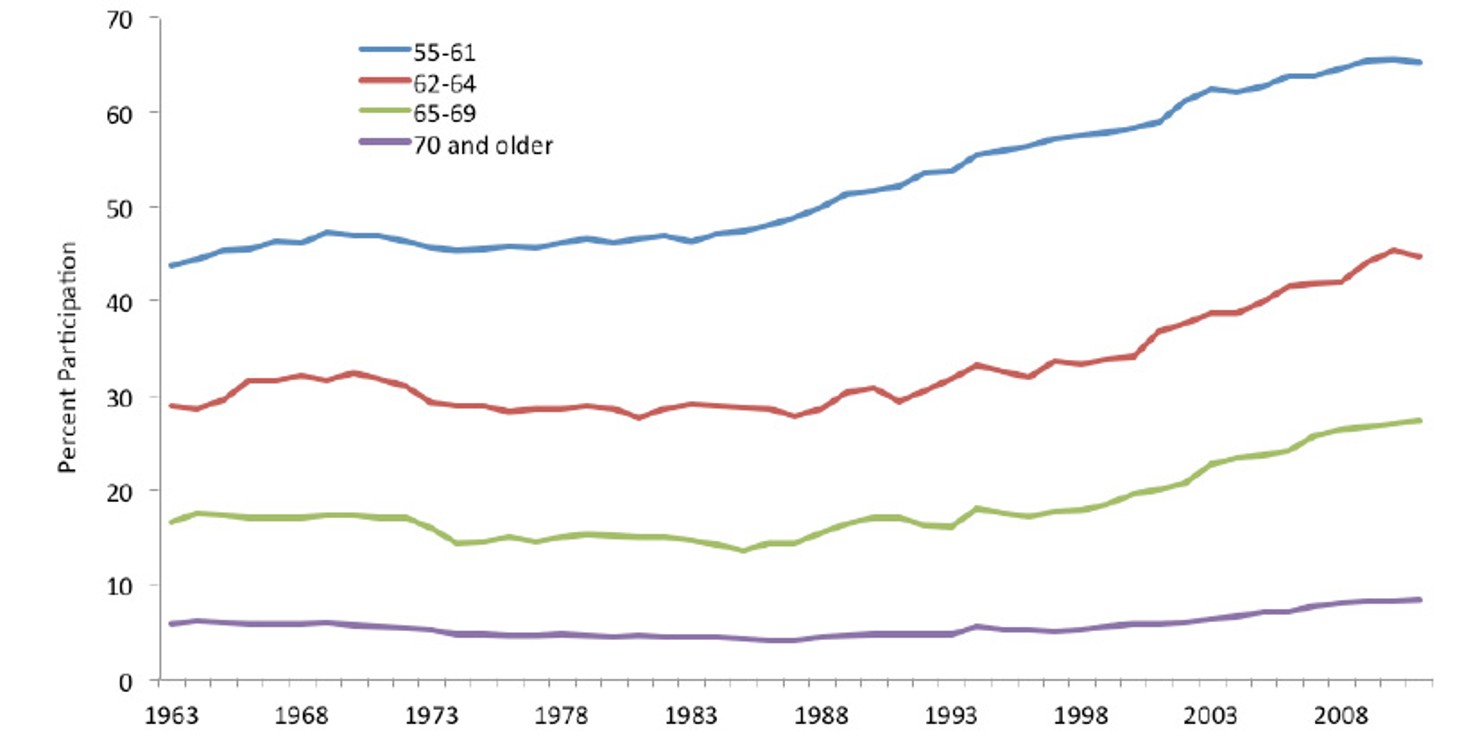
Source: Author’s compilation of data from the Bureau of Labor Statistics, Current Population Survey.
The reasons for greater participation in the labor force are varied, but they include changes in the nature of Social Security benefits, shifts in private sector pension plans, and changes in the nature of work.
Social Security
As older Americans retire, Social Security serves as a floor of protection for their incomes, and Social Security provides, on average, about a third of the income received by Americans age 65 and older. But Social Security’s importance varies for different groups. For example, among married couples and non-married people age 65 and over in the lowest fifth of the income distribution, Social Security accounts for 84% of their aggregate income, and cash public assistance adds another 8%. For those in the highest income category, Social Security provides only 20% of aggregate income.6
As a result of the 1983 Social Security amendments, the age at which one can receive full Social Security benefits is increasing over a 22-year period from 1998 to 2020. For individuals born after 1943, the full retirement age under Social Security is 66 while full retirement for those born after 1959 is 67.7 Social Security retired-worker benefits are first available at age 62, but benefits that begin before the full retirement age are permanently reduced by up to 25% below the amount that would be payable at the full retirement age.
While most people still choose to receive reduced benefits before the full retirement age, male and female workers are increasingly delaying the receipt of Social Security pension benefits.8 This trend may be due in part to the incremental increase in the full retirement age; the increasing percentage of workers whose only retirement plan is a defined contribution plan (see below); and—since few employers provide health insurance to retirees—some workers are delaying retirement until they are eligible for Medicare.
Private Sector Retirement Plans
Private sector retirement plans are another source of income as they cover 130 million Americans, approximately 61% of the active workforce, and they hold over $5 trillion in assets. But employer-sponsored pension income is becoming less important as a source of income for older Americans. Over the period of 1990 to 2008, the proportion of men receiving pension income declined from 49% to 42% while the proportion of women aged 65 and older receiving a pension remained essentially flat at 29%.9
The type of retirement plan can encourage additional work. Employer-provided retirement plans come in two basic types, defined benefit (DB) pensions and defined contribution (DC) plans. DB plans use a formula to provide a specified benefit to employees at a specified retirement age and are funded completely by employers. In DC plans, workers’ benefits are a function of annual contributions and actual investment returns, and DC plans do not promise a specific benefit at retirement, hence the term “defined contribution.”
Neither type of plan is risk-free.10 For example, inflation may eat into the annuity from a DB pension if cost of living allowances are not included or the sponsoring firm may fail before the worker can accumulate a sufficient level of benefits.11 The risks associated with DC plans can be broken into several parts,12 including the following:13
- Longevity risk—Will workers and their dependents outlive their retirement savings? According to the Society of Actuaries, many people underestimate their life expectancy, and most only make financial plans a few years into the future.14 In addition, cognition and physical ability declines with age, making planning later in life more difficult.
- Investment risk—Will investment returns on those accounts be sufficient to reach an adequate level of income?
- Consumption risk—Will unforeseen expenses, like medical costs, drain off retirement funds too quickly?
- Inflation risk—Will inflation erode the purchasing power of retirement funds, particularly if “safe” assets do not keep up with the cost of living?
The critical point is who bears these risks. Workers shoulder all the risks in a DC plan while these risks are shared in DB plans between workers and employers. This is a key point because since the 1970s DC plans have become the dominant retirement plan type. In 1980, more than 148,000 DB plans covered 30 million active workers (38% of the workforce), but by 2008 just over 48,000 DB plans covered 18.9 million American active workers (13% of the workforce). Over the same period, the number of DC plans increased from 340,850 to 669,156 with an increase in active workers covered from 14 million (14% of the workforce) in 1980 to more than 67 million (46% of the workforce) in 2008.15 Figure 2 below shows the percentage of the American workforce covered by DB and DC plans since 1975.
Figure 2: Percent of American Labor Force Participating in Defined Benefit and Defined Contribution Retirement Plans, 1975-2009
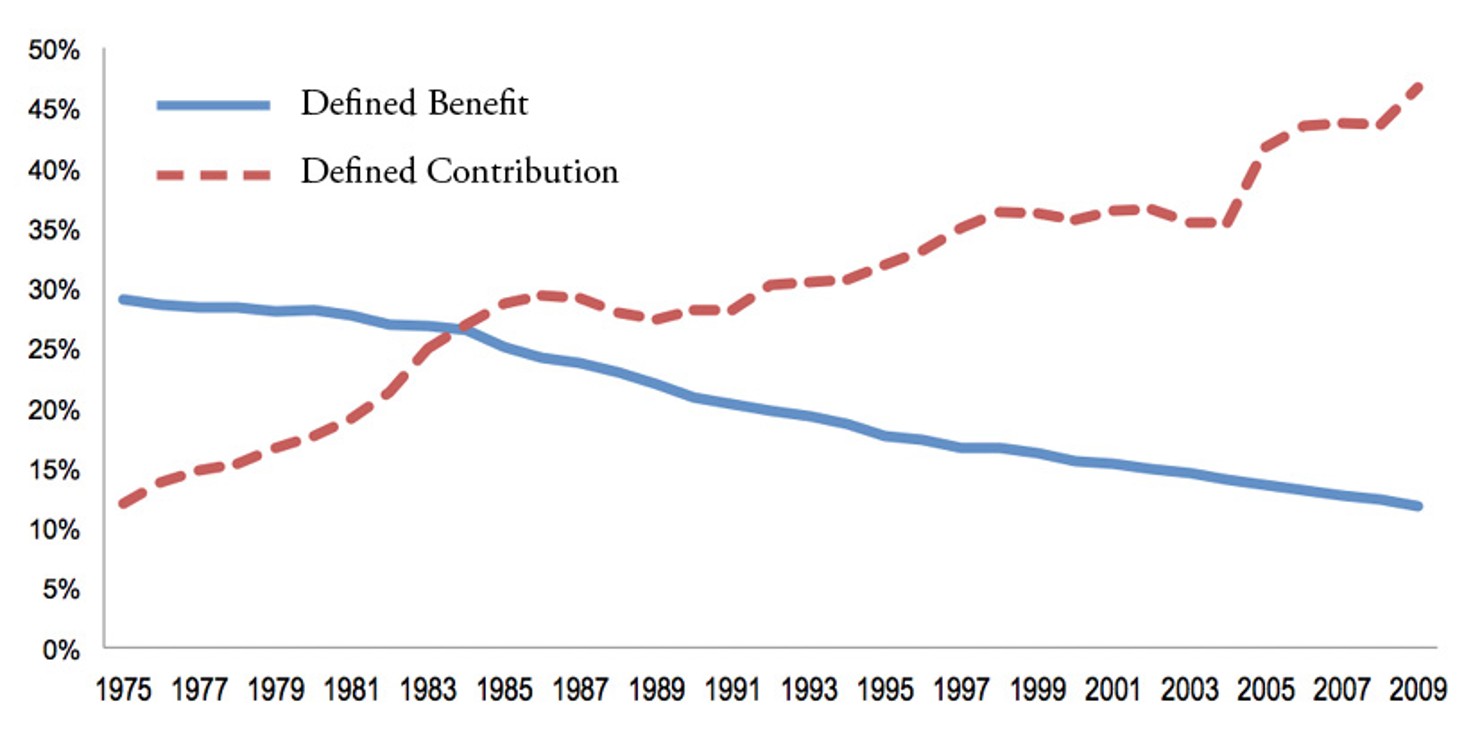
Source: U.S. Department of Labor, Bureau of Labor Statistics, Current Population Survey; U.S. Department of Labor, Employee Benefits Security Administration, Form 5500 filings.
In terms of how many Americans are covered by retirement plans, the growth of DC plans has offset the decline of DB plans.16 But mere coverage is not the whole story, and the issue becomes whether DC plans will adequately provide income security in retirement.
While some studies have reached different conclusions, many indicators point to inadequate income for retired Americans.17 For example, a 2004 study estimated that America’s retirees will face an aggregate income gap of at least $45 billion annually by 2030 if savings rates do not change,18 and a 2012 study estimates that between 30% and 40% of Baby Boomers will not have enough income at age 70 to replace 75% of their preretirement earnings, a common standard for judging income adequacy in retirement.19 The National Retirement Risk Index (NRRI) provides a measure of the percentage of working-age American households that are at risk of being financially unprepared for retirement. The NRRI indicates that the number of American households that face a decline in their standard of living in retirement has increased from 30% in 1989 to 51% in 2009.20 Not surprisingly, economic insecurity among older Americans of color is much higher than among white older Americans.21 And according to the Government Accountability Office, older women have both less retirement income and higher rates of poverty relative to men despite the fact that the composition of their income did not vary greatly over time.22
Table 2 breaks out account balances for all DC retirement savings by age.23 The median account balance for persons between the ages of 55 and 64 is approximately $100,000. The financial folk wisdom24 is that we should be able to live off of 4% of our accounts per year or that we should have 10 times the amount of our desired yearly income. When compared to a median income of $56,575 for households between the ages of 55 and 64, the savings amounts suggest a discouraging prospect for many older Americans. Indeed, this prospect may be coming true already: Half of single elderly and one-third of elderly in relationships die with less than $10,000 in assets.25
Table 2: Household Retirement Account Balances in 2007 by Age of Householder
(Households in thousands; Account balances in 2007 dollars)
Age of Householder | Number of Households | Households w/Accounts | Percent | Mean Value, | Median Value, |
Under 35 | 25,148 | 10,708 | 42.6% | $ 25,279 | $ 9,600 |
35 to 44 | 22,745 | 13,306 | 58.5% | $ 81,308 | $ 37,000 |
45 to 54 | 24,120 | 15,968 | 66.2% | $ 156,124 | $ 63,000 |
55 to 64 | 19,564 | 12,199 | 62.4% | $ 271,920 | $ 100,000 |
65 or older | 24,545 | 10,050 | 40.9% | $ 207,321 | $ 60,800 |
All households | 116,122 | 62,231 | 53.6% | $ 148,579 | $ 45,000 |
Source: Purcell, Patrick, “Retirement Savings and Household Wealth in 2007,” CRS Report for Congress (Washington: Congressional Research Service, April 8, 2009), http://assets.opencrs.com/rpts/RL30922_20090408.pdf.
The dominant form of DC retirement savings occurs within the 401(k) plan, which permits pre-tax deductions from paychecks to grow tax-free until the money is withdrawn. The average balance in a 401(k) plan was $58,351 at the end of 2009 with a median balance of $17,794.26 Some research suggests retirement may not be as bad as the above discussion suggests,27 but the weight of the evidence points to significant problems for an aging America.
These statistics are reflected in people’s perceptions. More than four out of five people are worried about their financial situation after retirement and 89% say it is important for them to start saving now.28 These concerns over financial security make work more important for older people.29 In fact, a new report suggests that half of those retiring at age 65 will be financially prepared for retirement, but 85% will be prepared if they work an additional 5 years to age 70.30 A recent study finds that the shift from DB to DC pensions has had a significant effect on increasing labor force participation rates by older workers, a nearly 5% increase for those aged 60 to 64.31
The Nature of Work
Changes in the nature of work may be benefitting older workers. For example, the growth of dual-income families could encourage longer active working years as spouses may prefer to retire around the same time.32 Education trends may also be a factor: In 1965, 24% of the older population had graduated from high school, and only 5% had at least a bachelor’s degree. By 2008, 77% were high school graduates or higher, and 21% had at least a bachelor’s degree.33 Educated workers tend to work longer because they are paid more and they face fewer physical demands in their jobs.34 The enactment of the Americans with Disabilities Act required employers to provide reasonable accommodations to disabled employees. In sum, longer lives, less physically demanding jobs, and increasing education among workers has made it possible for many older Americans to extend their working careers.
In an AARP survey,35 a key reason for increasing work by older Americans is financial necessity such as the need for money or health insurance according to 78% of surveyed workers age 50 and older who are working or looking for work today. And many older Americans are not eager to leave their jobs: an annual Retirement Confidence Survey by the Employee Benefit Research Institute found that 50% of retirees left the work force earlier than planned this year. The reasons cited included health problems or disability (51%); changes at their company, such as downsizing or closure (21%); or having to care for a spouse or another family member (19%).36
Employers have mixed perceptions of older workers.37 Older workers are recognized for having a good work ethic, being loyal and stable, and for possessing experience and knowledge. But employers also perceive older workers to be inflexible and resistant to change and learning new skills, particularly with regard to technology. However, any skill differentials between older and younger workers should decrease over time.38
Finally, older Americans are finding a variety of work arrangements beyond traditional full-time employment, with movement between jobs and classes of work, and in and out of retirement. For example, self-employment is a popular form of work for older Americans. Longitudinal studies reveal that self-employment rates peak at 24% for women and 38% for men at ages 66 and 65, respectively.39
Section Two
Phased Retirement
What is Phased Retirement? There is no statutory or legal definition of phased retirement. The practice that I am calling “phased retirement” has been and is associated with other terms, such as “partial retirement,” “gradual retirement,” “Deferred Retirement Option Plans (DROP),” and “retire and rehire” arrangements, among others. In general, phased retirement is the reduction of work with a long-term employer as an older employee approaches full retirement. Under this framework, phased retirement is part of the broader concepts of part-time work and flexible work arrangements.40
The first part of the definition is the “reduction of work,” and this is usually expressed in terms of hours worked per week. The U.S. Bureau of Labor Statistics definition41 of full-time work is 35 or more hours a week such that fewer than 35 hours a week but more than 0 would be considered part-time work. There are exceptions to this standard, of course, depending on industry and occupation-specific standards. For example, among elementary school teachers, 32 hours per week is considered full-time.42 Moreover, a reduction in work can be gradual (e.g., 35 hours a week reduced to 30 hours a week in the first year, 30 hours a week reduced to 25 hours a week in the second year, etc.). A reduction in work also could be more abrupt as in a one-time reduction from full-time to half-time.
In theory at least, a reduction in work could be based on criteria other than hours worked, such as a reconfiguration of job responsibilities. For example, a manager nearing retirement might transfer to a position that does not require supervision responsibilities and is more like a consultant within a firm. However, most commentators and scholars consider phased retirement in terms of reduced hours at a job.43
The second term in the definition—“with a long-term employer”—suggests a state of full-time work from which a reduction in hours worked begins.44 By this definition, the requirement of phasing down work with a long-term employer makes phased retirement distinct from what have been called “bridge jobs."45 For example, the worker who “retires” from a career employer and then takes a part-time job with a different employer or in a different line of work would not be considered a phased retiree but a worker in a bridge job.
Why make this distinction between phased retirement and bridge jobs? Phased retirement has the potential to provide the better pay, benefits, and working conditions that bridge jobs do not.46 A worker who has accrued any substantial amount of tenure is likely to have access to health insurance and pensions and will be higher up on the salary schedule. The better working conditions and benefits likely found in phased retirement also reflect greater control over the terms of work by the employee. That control may stem from seniority in the firm, the attainment of a management position, or an institution-wide program that provides phased retirement to employees who satisfy certain age and/or service criteria.47
The third component of the definition, which is that phased retirement occurs as the worker “approaches full retirement,” may seem tautological, but it distinguishes those employees who are working part-time as a way to transition to full retirement from workers who may be working part-time involuntarily and hoping to resume working full-time in the future. Thus, phased retirement requires some intention or expectation on the part of the worker that the process of phased retirement will lead to full-time retirement.
But phased retirement is a term that can be defined in several ways, and different approaches would have different implications for both research and policy. For example, there are other arrangements related to phased retirement. First, there are “retire and rehire” arrangements, also known as “reverse retirement,” in which one returns to work following a period of full or partial retirement.48 DROP plans are in essence phased retirement programs in state and local governmental pension plans in which workers can continue working following the normal retirement date, but their pension distributions are deposited into accounts that are held until the workers actually retire.49
Examples of Phased Retirement
Below are some examples of different phased retirement programs in various institutions.
Academia: The University of North Carolina: The University of North Carolina Phased Retirement Program provides an opportunity for tenured faculty to make a seamless transition to retirement through half-time service for a predetermined period in return for half-time compensation. The goals of the program “are to promote renewal of the professoriate in order to ensure institutional vitality and to provide additional flexibility and support for individual faculty members who are nearing retirement.” Participating faculty may, but are not required to, begin receiving pension benefits during phased retirement. While each campus in the university system may set different rules, generally participating faculty must be full-time employees, be at least 62 years old, and be eligible for retirement benefits under the applicable state retirement plan. Phased retirement must occur over at least one but not more than five years.50
Federal Employees: Under legislation enacted in 2012,51 federal workers will be able to phase into retirement. To qualify, a federal employee must have worked full-time for at least three years and be eligible for retirement. That means the earliest age at which anyone could take phased retirement would be 55. In an interesting twist, phased retirees must spend at least 20% of their time mentoring other employees. Each federal agency may adapt phased retirement to its needs. For example, an agency might offer phased retirement only to employees working on certain projects. In general, pension payments will be adjusted according to the amount of time worked. For instance, phased retirees working one day a week would receive 80% of their annuity; those putting in a four-day work week would get 20%. The Congressional Budget Office estimated that phased retirement would save the government $427 million in pension costs over 10 years.52
Private Sector: This past spring, IBM effectively offered a temporary phased retirement program to certain employees in its U.S. operations.53 Eligible workers would be able to cut their schedule down by 40% yet receive 70% of their pay while continuing to receive full benefits. Workers qualify if they are at or near retirement eligibility. The program would guarantee employment, even against layoffs, through December 31, 2013 as long as participants agree to retire on or before December 31, 2013.
What are the Indicators and Trends for Phased Retirement? To date, there has been relatively little research on the number of people taking part in phased retirement in the United States. Gustman and Steinmeier54 made one of the first distinctions between phased retirement and part-time work in retirement. They found that nearly 3% of their sample were what they termed “partially retired in their main job” versus 11% who were partially retired outside of their main job. Subsequently, Ruhm noted that 6.2% of his sample of workers “were partially retired and working for their career employer."55 Even and Macpherson56 estimated the percentage of phased retirees at 3.9% of those aged 50-54; 2.7% of those aged 55-59; 3.5% of those aged 60-61; 8.3% of those aged 62-64; and 14.3% of those aged 65 and older.
Perhaps as a result of the prevalence of informal phased retirement programs rather than formal, broad-based plans, phased retirement appears to be unevenly distributed. For example, phased retirement is much more prevalent in white-collar, skilled positions, and those older workers who engage in phased retirement are generally better educated and have higher levels of household wealth and income than those who are not phased retirees.57 Phased retirement, in its most common form, may be more of a retention tool for key older workers and less of a broad approach for dealing with labor shortages due to population aging.
Demand for Phased Retirement
Generally, employees who are contemplating retirement respond favorably to the option of phased retirement.58 In one survey, formal phased retirement programs were deemed important by 57% of surveyed workers.59 Responses to phased retirement can vary, however, depending on how the program operates.60 In an AARP study, 48% of workers said that, if being a phased retiree meant that they would have to hold a different job with the same employer, it would make phased retirement less attractive to them, and 63% of all workers indicated that phased retirement would be less attractive to them if it reduced pension benefits.61 Perhaps because of a fear of benefit reductions, workers covered by DB pension plans are less likely to transition to part-time work than those not covered by pension programs, and of those that do make the switch to part-time work, those with pension coverage are more likely to make a switch of employers in the process.62
Regarding employer practices, one survey of 600 large private firms found that 16% of employers provided a formal phased retirement program.63 In a study of 950 public and private organizations that employ 20 or more workers, 73% of surveyed employers permitted an employee to reduce hours before official retirement, but only 14% of those employers had a formal, written phased retirement policy that applied broadly to employees.64 What most employers have in mind is an informal arrangement that would largely depend on the employer’s need for the worker. In addition, the survey found that formal phased retirement programs were more common among large employers than small employers.
What Factors Influence or Are Associated With Phased Retirement?
Several demographic and economic factors, including many discussed earlier, are driving the development of phased retirement. These factors include the increasingly long work weeks of highly educated workers, which may be making full-time work schedules less appealing for older workers. The increasing numbers of older Americans who are available to work and who want to work, in part due to the large Baby Boom cohorts and in part due to health and longevity gains, could also be responsible for increased employee interest in phased retirement. Increased work at the older ages, including phased retirement, could also be a function of changes in the nature of an economy that de-emphasizes physical labor. The increasing prevalence of DC plans, such as the 401(k) plan, and the decline of traditional DB pensions as a source of retirement income to current and future retirees may also be a factor: without the guaranteed income from DB plans, workers may need to continue to stay on the job to save more for retirement. Aside from a source of savings, phased retirement may also delay or slow withdrawals from pension plans, thereby preserving retirement assets. The growth of medical and pharmaceutical costs and the decline of employer-provided health insurance plans for retired workers that augment Medicare may encourage continued work as individuals seek to pay for, and ensure continued access to, insurance coverage. Scholars are also calling for reduced-hours options as a means to increase employee flexibility, reduce stress, and improve general quality of life.65
Employers may be developing phased retirement policies as a way to retain employees with special skills or extensive experience which can be a resource to other workers.66 Phased retirement could also reduce the high costs of recruiting and training new employees. Moreover, phased retirement may be appealing to employers and institutions because it allows for better and more orderly succession plans, minimizes unfilled positions, and avoids costly buyouts in order to induce exit.67 The demand for phased retirement by employers may be caused in part by the increasing scarcity of younger workers due to population aging.68
Effects of phased retirement: Phased retirement might influence the timing of retirement: Nearly 25 % of phased retirees expected to work past age 65 and another 20% did not plan to retire at all.69 In an AARP survey, 78% of older workers who expressed an interest in phased retirement anticipated that the availability of phased retirement would encourage them to work past their expected retirement age.70 In a different survey of employees in a state public school system, 44% of respondents indicated that they would consider delaying full-time retirement if a phased retirement option were made available.71
Section Three
Aging Trends
Continued population aging heightens the importance of both the aging workforce in general and phased retirement in particular. Population aging in the U.S. refers to both the number and the proportion of the population that is older. Figure 3 below shows growth in the 65 and older population expressed as a percentage of the population as well as the old-age dependency ratio. It also shows that the older population has been growing since the 1960s. Persons 65 years or older numbered 40.4 million or 13% of the population in 2010. But the older population will burgeon from the present through 2030 as successive waves of the “Baby Boom” generation reach age 65. According to the Census Bureau, the population of those aged 65 and older will increase by 79% between 2010 and 2030 while the 25 to 34 and 35 to 44 age groups—the prime working age population—will only increase by 12% and 17%, respectively.72 By 2030, there will be about 72.1 million older persons, over twice their number in 2000, and they will account for 19% of the total population.73
Figure 3: Percentage of Persons Aged 65 and Older and Old-Age Dependency Ratio, 1960-2030
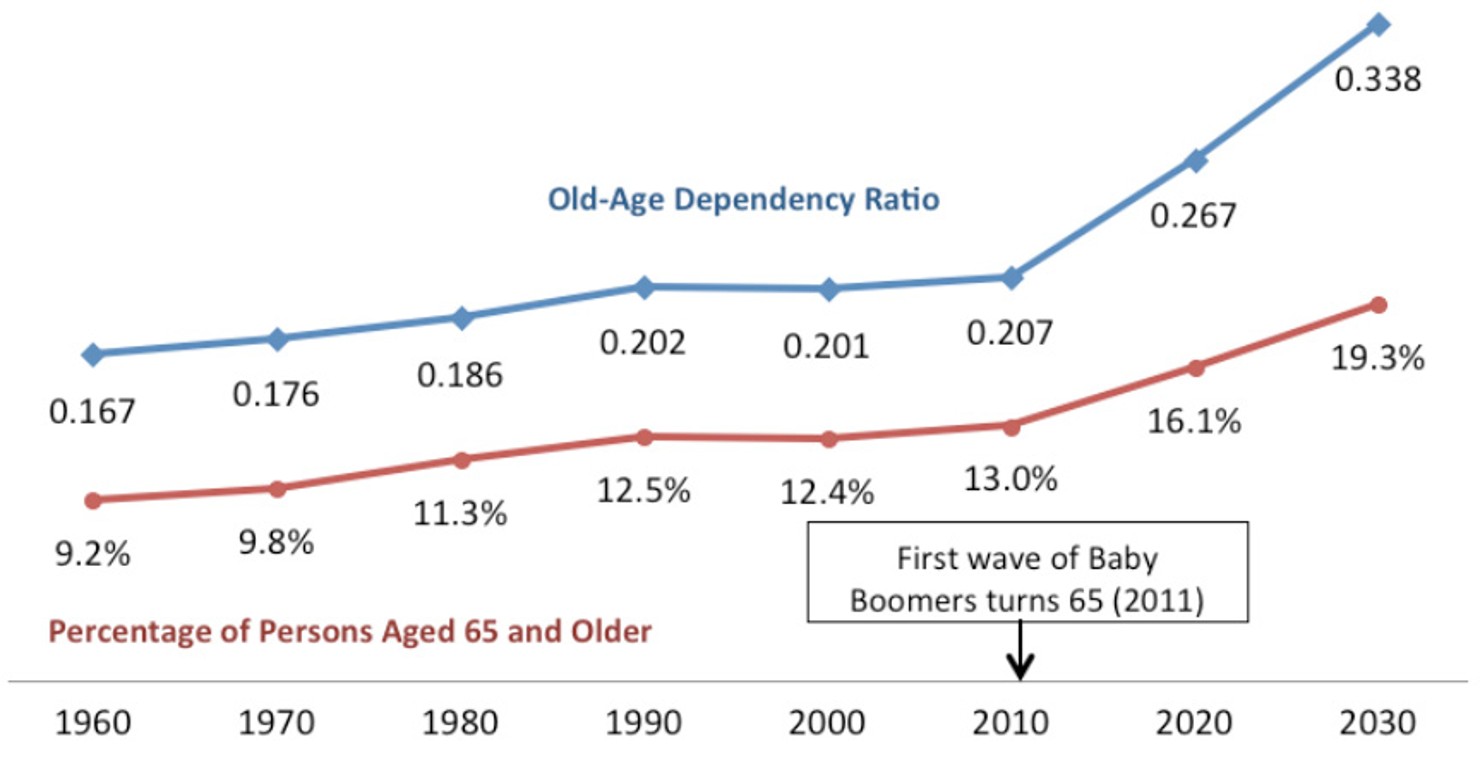
Source: Author’s calculation of data from the 1970, 1980, and 2012 Statistical Abstract of the United States, available at http://www.census.gov/compendia/statab/. Note: The old-age dependency ratio is the proportion of the number of persons aged 65 and older to the number of persons aged 18 to 64.
Different subgroups within the older population will experience different rates of growth, and these groups are central in terms of income security and health policy. The 85 and older population, a group that will require greater care and resources, is projected to increase from 5.5 million in 2010 to 6.6 million in 2020, a rise of nearly 20%. The older population is also diverse: minority populations have increased from 5.7 million in 2000 (16.3% of the elderly population) to 8.1 million in 2010 (20% of the elderly population) and are projected to increase to 13.1 million by 2020 (24% of the elderly population). Between 2010 and 2030, the Hispanic 65-plus population is projected to increase by 202%, the African-American 65-plus population by 114%, and the Asian and Pacific Islander 65-plus population by 145%.74
Sources of Aging
While the Baby Boom is a cause of rapid population aging, longevity and fertility trends have made aging an important and permanent feature of the U.S. experience. In 2009, persons reaching age 65 could expect to live an additional 19 years (20 years for females and 17 years for males). Death rates for the population aged 65-84 over the past two decades has declined significantly, especially for men—by 42% for men aged 65-74 and by 30% for men aged 75-84.75
The decline in fertility ensures both that surviving older persons will make up a larger proportion of the population and that the smaller number of younger persons will struggle to support a retired generation. The birth rate has decline from 23.7 births per 1,000 in 1960 to 14.0 per 1,000 in 2008.76 However, the number of births has been rising since the 1970s as the Baby Boomers started having children, and this trend has slowed population aging.77
Economics of Aging
Due largely to Social Security and Medicare programs, older Americans have more economic protection today than 50 years ago. Between 1974 and 2007, the proportion of older people with income below the poverty line declined from 15% to 10% and those with low income dropped from 35% to 26%.78
But population aging will place pressure on the social programs that have benefitted older Americans. Figure 3 above also shows a simplified age-dependency ratio, which is the ratio of the 65 and older population to the 18-64 age group. The age-dependency ratio will see a sharp upward increase in the coming decades, and this increase suggests a fiscal strain as relatively fewer workers support increasing numbers of Medicare and Social Security beneficiaries with their payroll taxes.
Despite the improvements in income and poverty rates, long-term trends and short-term events put increasing economic pressure on older Americans. For example, inflation-adjusted health care costs increased significantly among older Americans from $9,224 in 1992 to $15,081 in 2006. From 1977 to 2006, the percentage of household income allocated to out-of-pocket spending for health care services increased among poor and near-poor older Americans from 12% to 28%.79
The current economic crisis also adversely affects older Americans in many ways. People who were close to retirement age may have been most affected by the downturn as retirement accounts of those 50 and over lost 18% of their value during the onset of the crisis. In May 2009, retirement accounts had lost $2.7 trillion or 31% since September 2007. The economic downturn also resulted in falling housing prices. For an older person whose major financial asset is their home, the drop in housing prices is especially painful as the build-up in equity is a major component of their wealth.80 As of July 2012, the unemployment rate among workers age 55 and older was 6.2% with average duration of unemployment at 51 weeks.81
Conclusion
This paper discussed phased retirement within the overall context of population aging, old-age income security, and larger trends in the aging labor force. Continued work can have many benefits for both older Americans and for society. Continued work can boost retirement savings, provided additional income, and be a source of satisfaction and social contact for individual workers. For society, older workers contribute to the national economy, provide taxes, and demand less in government services and transfers.
However, many older Americans continue to work out of necessity rather than out of choice. In this sense, work and retirement policies like phased retirement must take into consideration the broad range of influences on continued work and retirement.
Population aging will provide a large pool of potential workers who are more productive and can work longer than prior generations. Moreover, pensions are changing in a way that encourages continued work. Phased retirement may provide an avenue for older workers who wish to begin reducing their work with an eye toward retiring in the near future. Public employers appear to be embracing phased retirement programs.
But at present phased retirement in the private sector remains a hodge-podge of ad hoc arrangements in which only very skilled or highly paid employees have access to phased retirement. Public policy must balance the flexibility demanded by employers with the public desire to open access to a broad range of workers and address several barriers to phased retirement, which are described below.
Barriers to phased retirement: Given some of the benefits discussed above, why are formal, broad-based phased retirement programs uncommon? Significant legal and institutional barriers stand in the way of the implementation of broad-based phased retirement programs and/or in the use of phased retirement by workers.
A critical issue is how a phased retirement program would mesh with existing employee benefit programs, in particular retirement plans such as traditional DB pensions and savings plans such as the 401(k). Researchers have found that employers with savings or DC plans were more likely to offer phased retirement than employers with traditional DB plans.82 Specifically, complicated tax rules on distributions from DB pension plans may hinder the coordination of pension benefits with a phased retirement program. A critical stumbling block is that tax law prevents the payment of pensions, sensibly, until a worker has fully retired. The Pension Protection Act of 2006 permitted in-service distributions from DB plans when a participant reaches age 62 even if the normal retirement age is after age 62, but many experts feel that more clarity is needed.83 In contrast, DC plans have more flexibility in terms of when distributions can be made, but distributions before age 591/2 are generally prohibited.
Traditional DB pension plans also have built-in incentives via the benefit formula for retiring at a specified age, which is usually age 65, and these incentives may conflict with phased retirement programs. In addition, benefits in a DB plan are often tied to the salary of an employee (such as when a monthly pension is calculated as a percentage of last year’s pay or the average of the last three years of salary) so that phased retirement, with a consequent drop in salary, might cause a reduction in pension benefits.
Pension plans are also subject to a set of technical and complicated rules known as nondiscrimination rules. The nondiscrimination rules require that benefits under the plan must be made available to all, or almost all, participants, and complicated mathematical tests are used to demonstrate compliance. If employers are looking at phased retirement as a tool to target key or highly skilled employees for retention, then the nondiscrimination rules may make phased retirement unappealing to them. Private sector employers are unlikely to institute phased retirement programs, particularly broad-based programs, without the flexibility to adapt such programs to their own needs.84
Moreover, other benefit or legal considerations beyond pension rules may come into play. For example, the health benefits of many employers depend on a minimum number of hours worked. A phased retirement program must deal with how health benefits would continue to be provided to phased retirees. Finally, it is unclear how age discrimination laws would apply to phased retirement programs, if at all. Employers and employees may also be concerned about how phased retirement will affect savings accounts in DC plans.
In summary, phased retirement may provide a number of benefits to workers, employers, and the larger economy. But public policy must overcome barriers, and employers and workers should carefully plan how to use phased retirement.
About the Author
John C. Scott is an Assistant Professor who teaches public policy at the University of North Carolina at Chapel Hill. He is also a research scientist at the UNC Institute on Aging. Dr. Scott is an interdisciplinary sociologist with an interest and expertise in health care and pension policy as well as in social network analysis as applied to the policy making process. Current research projects include entrepreneurship at older ages, financial decision making at retirement, and interest group lobbying on pension and Medicare issues. Prior to receiving his Ph.D. from Cornell University, Dr. Scott worked as Director of Retirement Policy at the American Benefits Council in Washington, D.C. and has worked as an employee benefits consultant and attorney in private practice and in the financial services sector. Dr. Scott also received an M.A. from the University of Maryland, a J.D. from the Dickinson School of Law at Penn State, and a B.A. from Swarthmore College.
